


Sensitivity analysis helps you understand how changes in one or more input values affect the result of a formula. Instead of changing inputs manually one by one, Excel’s Data Table feature can calculate many possible scenarios at once. The Data Table feature, found under What-If Analysis, makes this easy by calculating multiple scenarios automatically. This approach can be used for profit analysis, budgeting, forecasting, investment analysis, break-even analysis, and other financial models.
In this tutorial, we will show how to use Excel’s Data Table feature for sensitivity analysis. We will create both a one-variable and two-variable Data Table.
Prepare Your Dataset
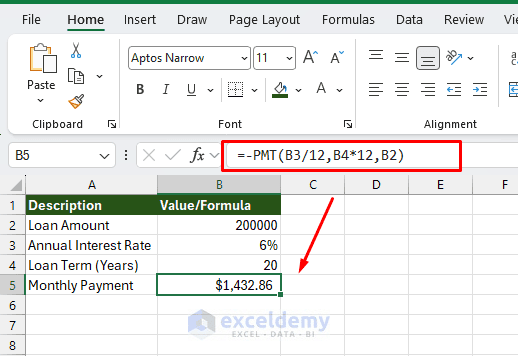
First, create the following loan model in Excel.
- In cell B5, enter the following formula:
=-PMT(B3/12,B4*12,B2)
The PMT function calculates the monthly loan payment based on the loan amount, interest rate, and loan term. This cell will be the output that we analyze in the sensitivity analysis.
Create a One-Variable Data Table
A one-variable sensitivity analysis shows how the result changes when you vary only one input while keeping all other inputs unchanged.
Suppose you want to determine how the monthly payment changes when the interest rate ranges from 4% to 8%.
Step 1: Enter the Possible Interest Rates
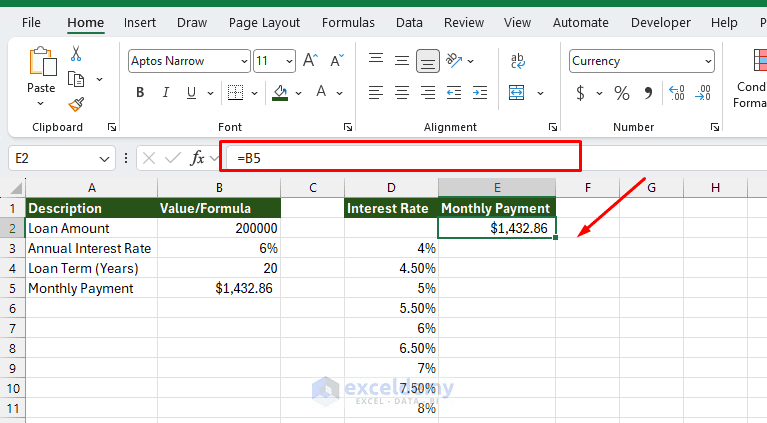
- In another part of the worksheet, enter the following values
- Place the interest rates in D3:D11
Link the Output Formula:
- In cell E2, enter:
=B5
This links the sensitivity analysis table to the original monthly payment result.
Step 2: Create the Data Table
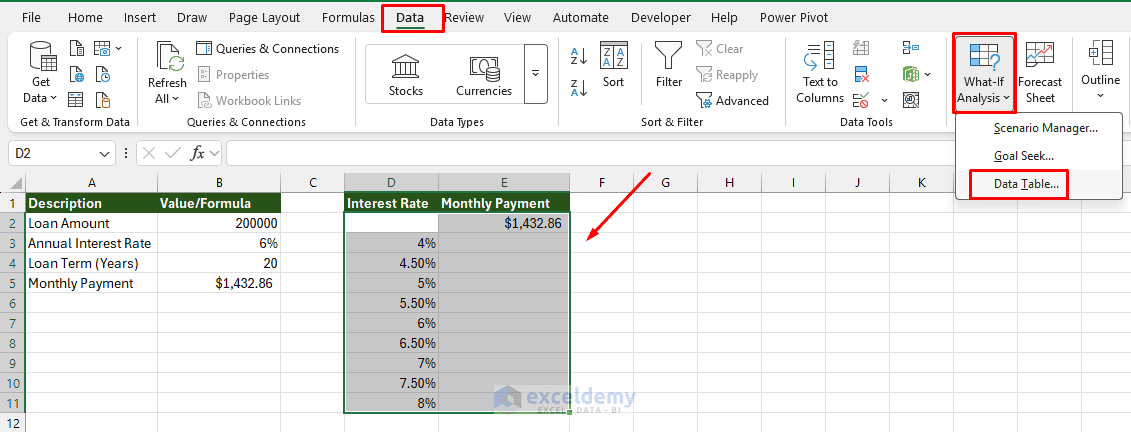
- Select the entire range containing the formula and possible input values, such as D2:E11
- Go to the Data tab >> select What-If Analysis >> choose Data Table
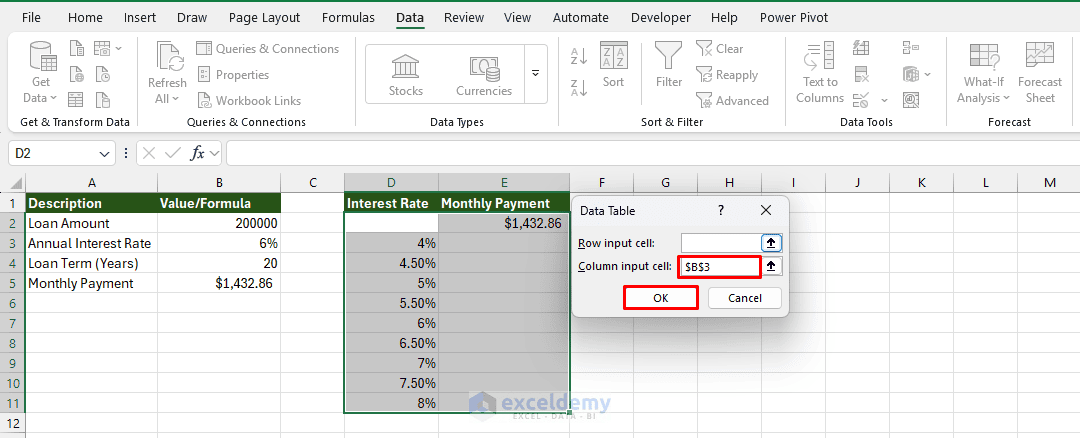
- In the Data Table dialog box:
- Row input cell: Leave blank
- Column input cell: Select the original interest rate cell, B3
- Click OK
Excel substitutes each interest rate from the sensitivity table into B3 and recalculates the monthly payment automatically. It fills the second column with the monthly payment corresponding to each interest rate.
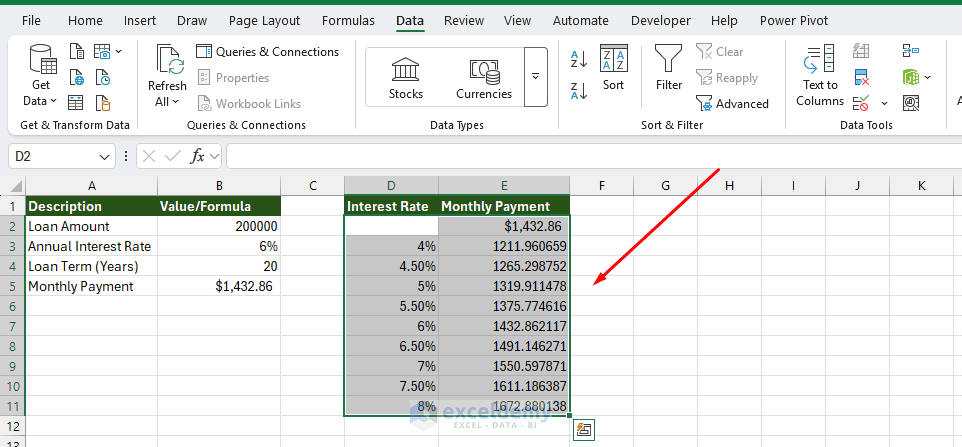
The sensitivity analysis clearly shows that the monthly payment increases as the interest rate increases. This allows you to see how sensitive the loan payment is to changes in the interest rate without changing the original model repeatedly.
Create a Two-Variable Data Table
A two-variable sensitivity analysis lets you examine the effect of changing two inputs simultaneously.
Suppose you want to see how both the interest rate and loan amount affect the monthly payment.
Step 1: Set Up the Two-Variable Table
Arrange the Input Values:
The values across the top represent interest rates, while the values down the first column represent loan amounts.
- Start the table in cell D14
- Create a table similar to the following
| Loan Amount / Interest Rate | ||||
| 4% | 5% | 6% | 7% | |
| $150,000 | ||||
| $175,000 | ||||
| $200,000 | ||||
| $225,000 | ||||
| $250,000 |
Reference the Result Formula:
- In the upper-left corner of the table, cell D14, enter:
=B5
The formula refers to the result you want Excel to analyze. Enter the interest rates across the first row and loan amounts down the first column.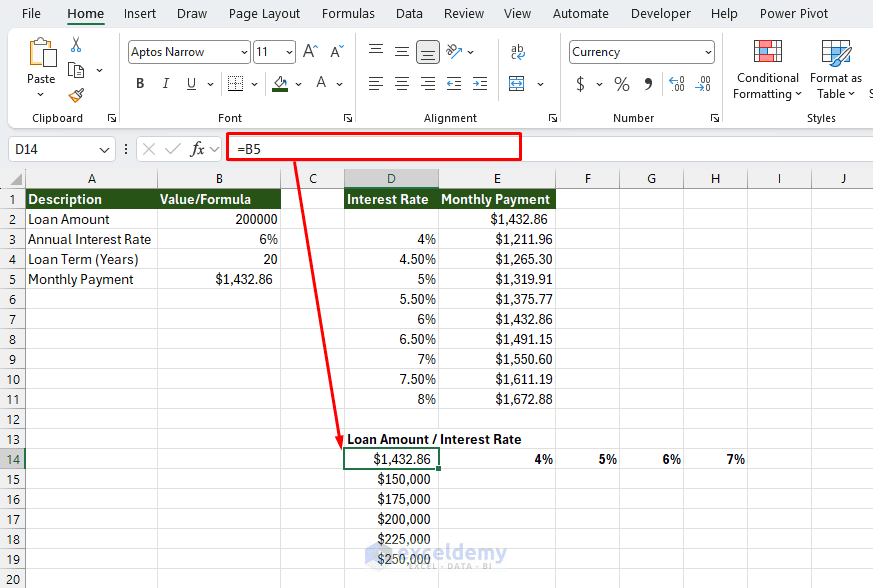
Step 2: Create the Two-Variable Data Table
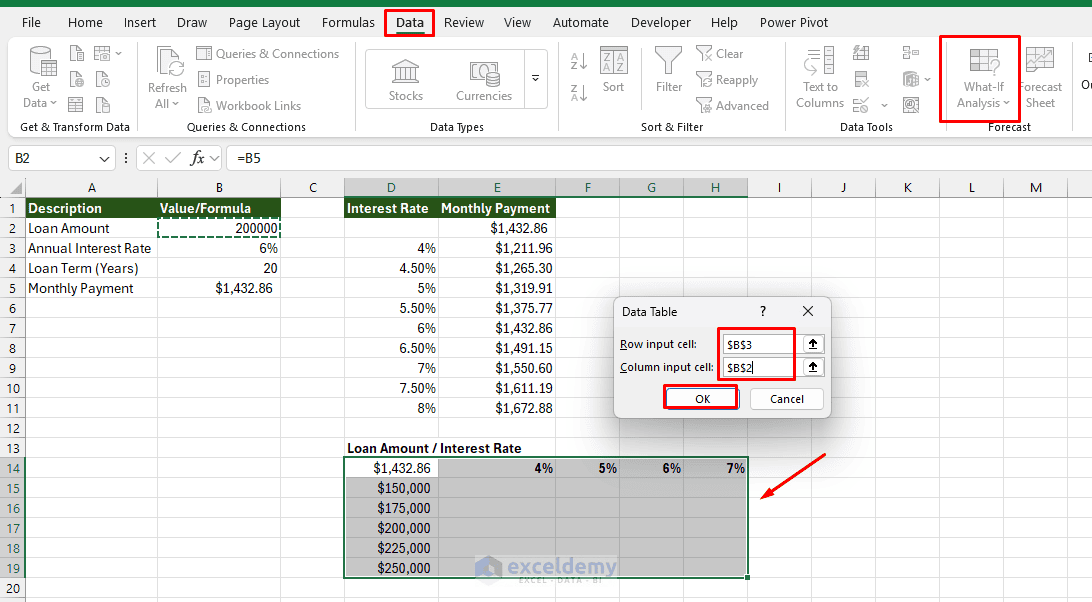
- Select the entire range D14:H19
- Go to the Data tab >> select What-If Analysis >> select Data Table
- This time, specify both input cells:
- Row input cell: $B$3
- Column input cell: $B$2
- Click OK
Excel fills the complete table with calculated monthly payments. This two-variable sensitivity analysis makes it easy to compare multiple scenarios.
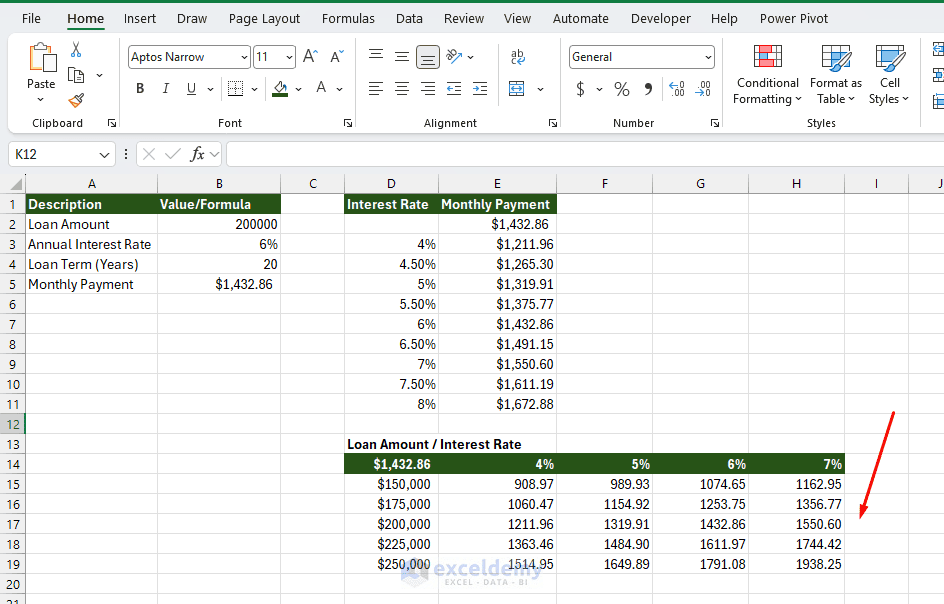
For example, a $200,000 loan at 4% requires a much lower monthly payment than a $250,000 loan at 7%. The table helps you understand the combined impact of changes in both assumptions.
This makes it much easier to compare different loan scenarios without manually changing the original inputs.
Apply Conditional Formatting to the Results
You can make sensitivity results easier to interpret with Conditional Formatting.
- Select only the calculated values in the Data Table
- Go to the Home tab >> select Conditional Formatting >> select Color Scales
- Choose a suitable color scale
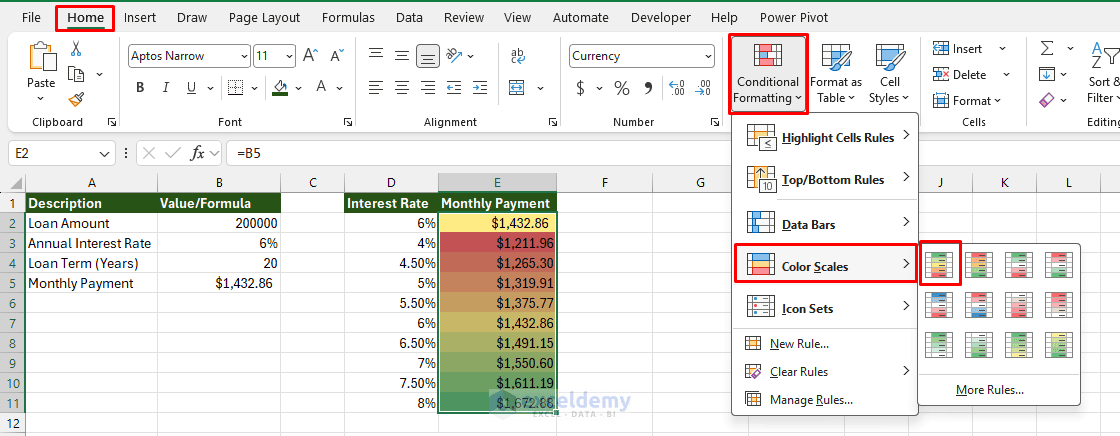
Excel will visually highlight smaller and larger results, making the impact of different assumptions easier to compare.
Quick Reference: One-Variable vs. Two-Variable
| Feature | One-Variable Table | Two-Variable Table |
| Inputs tested | 1 | 2 |
| Outputs shown | Multiple allowed | 1 only |
| Input layout | Column OR row | One in column, one in row |
| Input Cell fields used | Column Input Cell OR Row Input Cell | Both |
| Best for | “How does X affect several results?” | “How do X and Y together affect one result?” |
Important Things to Know About Excel Data Tables
- Data Tables Require a Formula Reference: The corner or heading cell of the Data Table must reference the result you want to analyze. Do not type the calculated monthly payment manually — it must be linked to the actual formula result.
- Data Table Results Cannot Be Edited Individually: Excel treats the calculated area of a Data Table as a single array-like structure. If you try to change one calculated result, Excel will display a message stating that you cannot change part of a Data Table. To remove the Data Table, select the entire calculated range and delete it.
- Data Tables Can Slow Large Workbooks: Excel recalculates Data Tables whenever relevant workbook calculations occur. A workbook containing many large sensitivity tables can therefore become slow. For large financial models, you can control this from: Formulas >> Calculation Options >> Automatic Except for Data Tables. This allows normal formulas to recalculate automatically while Data Tables are recalculated separately.
Common Mistakes to Avoid
- Forgetting to link the corner/output cell to the original formula (you will get the same value repeated, or errors)
- Selecting the wrong input cell (must be the original model cell, not a cell inside the table)
- Mixing up Row vs. Column input (remember: values arranged in a column → use Column input cell)
- Putting the Data Table on a different sheet from the inputs
- Trying to vary three or more inputs at once (Data Tables support only one or two; use Scenario Manager or more advanced tools for more)
Conclusion
By following the steps above, you can use Excel’s Data Table feature for sensitivity analysis. Data Tables provide a quick way to test multiple scenarios without repeatedly changing input values yourself. A one-variable Data Table is useful when you want to test several possible values for one assumption, such as interest rates. A two-variable Data Table lets you analyze two assumptions together, such as interest rate and loan amount. By combining Data Tables with formulas, you can quickly evaluate how different assumptions affect financial and business outcomes.
Get FREE Advanced Excel Exercises with Solutions!

