

Building a financial model in Excel usually requires you to organize assumptions, create forecast formulas, and test different scenarios. ChatGPT can make this process faster by helping you design the model structure and generate formulas based on your worksheet layout.
In this tutorial, we will show how you can build financial models in Excel with ChatGPT. Let’s build a simple five-year financial forecast using ChatGPT.
Step 1: Ask ChatGPT to Suggest the Forecast Structure
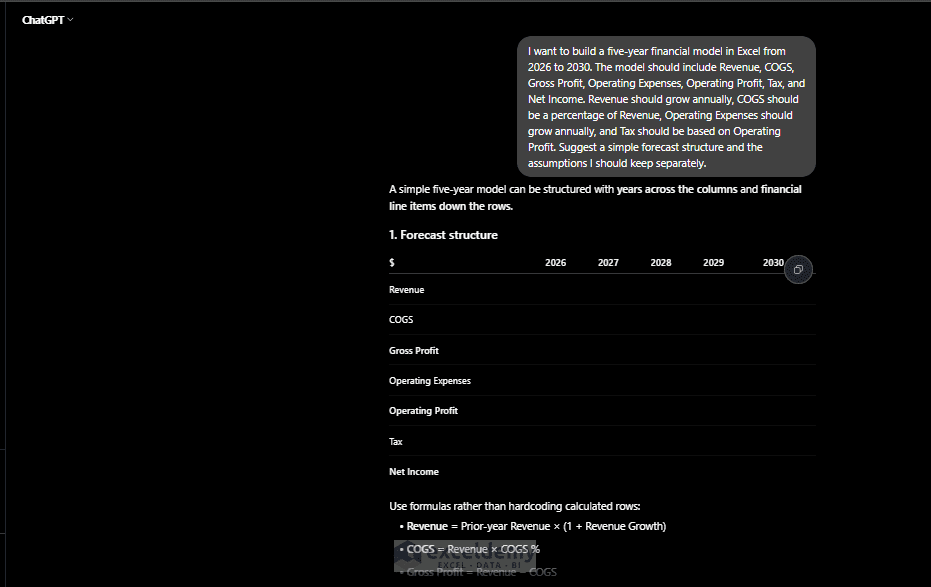
Before entering formulas in Excel, determine what sections the model should contain. Suppose you want to forecast a company’s financial performance from 2026 to 2030. Start by asking ChatGPT how the model should be organized.
Prompt:
I want to build a five-year financial model in Excel from 2026 to 2030. The model
should include Revenue, COGS, Gross Profit, Operating Expenses, Operating Profit, Tax, and
Net Income. Revenue should grow annually, COGS should be a percentage of Revenue,
Operating Expenses should grow annually, and Tax should be based on Operating Profit.
Suggest a simple forecast structure and the assumptions I should keep separately.
ChatGPT may return:
A simple model can use years across columns and financial line items down rows.
| Financial Metric | 2026 | 2027 | 2028 | 2029 | 2030 |
| Revenue | |||||
| COGS | |||||
| Gross Profit | |||||
| Operating Expenses | |||||
| Operating Profit | |||||
| Tax | |||||
| Net Income |
It may also suggest this calculation logic:
- Revenue = Prior-year Revenue × (1 + Revenue Growth)
- COGS = Revenue × COGS %
- Gross Profit = Revenue − COGS
- Operating Expenses = Prior-year OpEx × (1 + OpEx Growth)
- Operating Profit = Gross Profit − Operating Expenses
- Tax = Operating Profit × Tax Rate
- Net Income = Operating Profit − Tax
For assumptions, ChatGPT may suggest:
| Assumption | 2026 | 2027 | 2028 | 2029 | 2030 |
| Revenue Growth | — | 10% | 10% | 8% | 8% |
| COGS % of Revenue | 40% | 40% | 39% | 39% | 38% |
| OpEx Growth | — | 7% | 7% | 6% | 6% |
| Tax Rate | 25% | 25% | 25% | 25% | 25% |
It may also recommend keeping separate starting values for 2026 Revenue and 2026 Operating Expenses. This will give you the basic structure for the workbook.
Step 2: Ask ChatGPT Which Values Should Be Assumptions
Next, ask ChatGPT which values should remain as inputs rather than being hardcoded inside formulas.
Prompt:
I am forecasting Revenue, COGS, Gross Profit, Operating Expenses, Operating Profit,
Taxes, and Net Income for five years. Which values should be treated as assumptions
rather than hardcoded inside the forecast formulas?
ChatGPT may return:
The main assumptions should be the values that drive the forecast:
- 2026 Revenue
- Annual Revenue Growth %
- COGS % of Revenue
- 2026 Operating Expenses
- Annual OpEx Growth %
- Tax Rate %
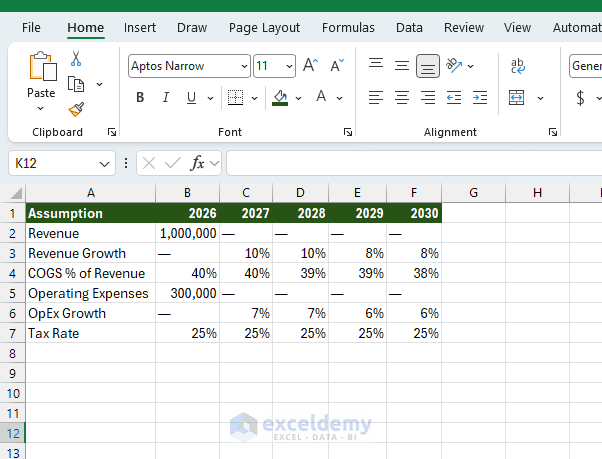
It may suggest an Assumptions table like this:
| Assumption | 2026 | 2027 | 2028 | 2029 | 2030 |
| Revenue | 1,000,000 | — | — | — | — |
| Revenue Growth | — | 10% | 10% | 8% | 8% |
| COGS % of Revenue | 40% | 40% | 39% | 39% | 38% |
| Operating Expenses | 300,000 | — | — | — | — |
| OpEx Growth | — | 7% | 7% | 6% | 6% |
| Tax Rate | 25% | 25% | 25% | 25% | 25% |
ChatGPT may also explain that the remaining values should be calculated in the forecast rather than entered manually:
- COGS = Revenue × COGS %
- Gross Profit = Revenue − COGS
- Operating Expenses = Prior-year OpEx × (1 + OpEx Growth)
- Operating Profit = Gross Profit − Operating Expenses
- Taxes = Operating Profit × Tax Rate
- Net Income = Operating Profit − Taxes
This separation makes the model easier to update. If a business assumption changes, you only need to update the relevant value on the Assumptions sheet instead of editing forecast formulas.
Rule of thumb: Keep business drivers as assumptions and calculate any value that can be derived mathematically from those assumptions.
Step 3: Ask ChatGPT to Generate the Forecast Formulas
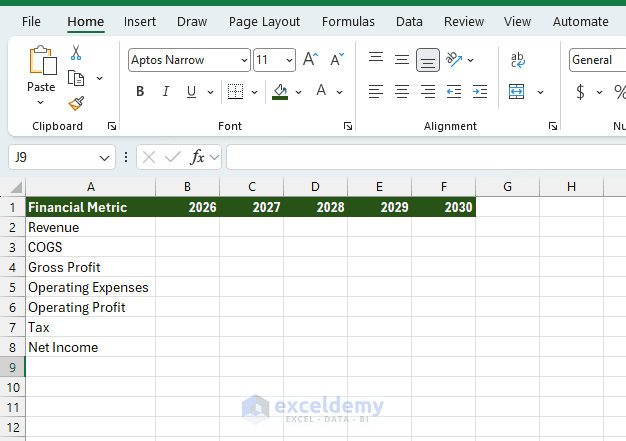
- Create another worksheet named Forecast
- You can copy the following table to set up the Forecast sheet
| Financial Metric | 2026 | 2027 | 2028 | 2029 | 2030 |
| Revenue | |||||
| COGS | |||||
| Gross Profit | |||||
| Operating Expenses | |||||
| Operating Profit | |||||
| Tax | |||||
| Net Income |
Now use ChatGPT to generate formulas.
Prompt:
My Assumptions sheet has years 2026-2030 in B1:F1. Revenue is in B2 as the starting value. Revenue Growth is in C3:F3. COGS % is in B4:F4. Operating Expenses is in B5 as the starting value. OpEx Growth is in C6:F6. Tax Rate is in B7:F7.
My Forecast sheet has 2026-2030 in B1:F1 and Revenue through Net Income in rows 2-8.
Give me the Excel formulas needed to build the forecast. Use appropriate absolute and
relative references so I can copy formulas across where possible.
It may also explain that the 2027 formulas can be copied across because the year-specific assumption references will move with each column.
Step 4: Enter the Forecast Formulas in Excel
Use the formulas from ChatGPT in the Forecast sheet.
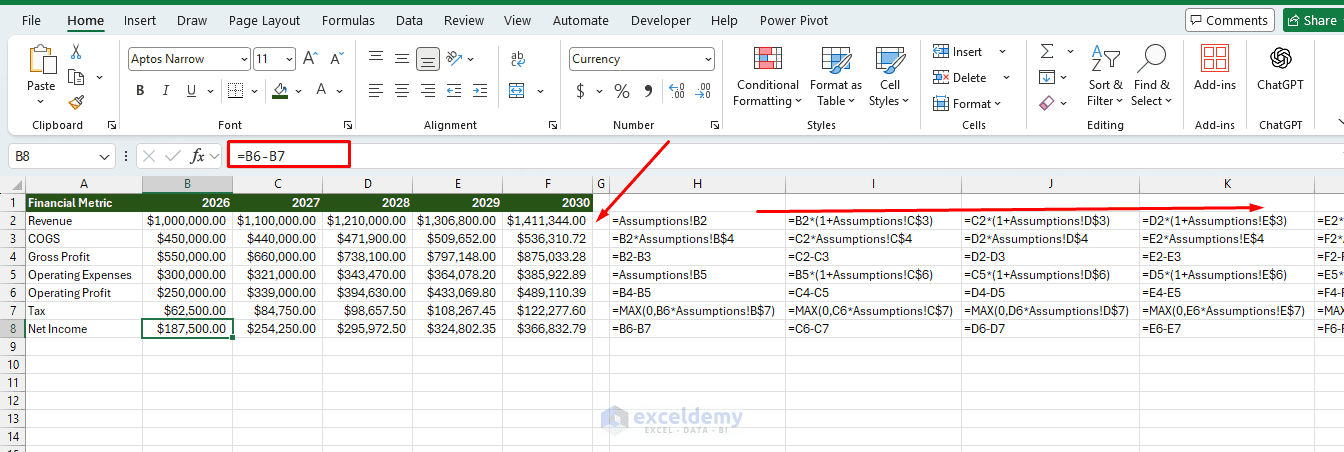
Build the Revenue Forecast:
- In B2, enter:
=Assumptions!B2
For 2027, use the previous year’s revenue and apply the growth assumption.
- In C2, enter:
=B2*(1+Assumptions!C$3)
- Drag C2 through F2
Because the formula references Assumptions!C$3, dragging it across columns picks up the correct year’s Revenue Growth assumption automatically.
Forecast COGS:
- In cell B3, enter:
=B2*Assumptions!B$4
- Drag it through F3
Forecast Gross Profit:
- Enter this in B4:
=B2-B3
- Drag it through F4
Forecast Operating Expenses:
- In cell B5, enter:
=Assumptions!B5
- In cell C5, enter:
=B5*(1+Assumptions!C$6)
- Drag C5 through F5
Forecast Operating Profit:
- Enter this in B6:
=B4-B5
- Drag it through F6
Forecast Tax:
- Enter this in B7:
=MAX(0,B6*Assumptions!B$7)
- Drag it through F7
Using MAX keeps Tax at zero if Operating Profit becomes negative.
- Finally, enter this in B8:
=B6-B7
- Drag it through F8
The forecast now updates automatically whenever you change the assumptions.
Step 5: Create Base, Best, and Worst Case Scenarios
A single forecast represents only one possible future. Financial models become more useful when they allow you to test different assumptions. For example, suppose management wants to compare:
- Base Case
- Best Case
- Worst Case
You can add scenario analysis so the model can show different possible outcomes.
Prompt:
I want to add Base Case, Best Case, and Worst Case scenarios to my five-year financial
model. The scenario should affect Revenue Growth, COGS %, Operating Expense Growth,
and Tax Rate. Suggest a simple scenario assumptions table.
ChatGPT may return:
| Assumption | Base Case | Best Case | Worst Case |
| Revenue Growth | 8% | 12% | 3% |
| COGS % | 40% | 36% | 45% |
| OpEx Growth | 6% | 4% | 9% |
| Tax Rate | 25% | 25% | 25% |
- Store the table in I1:L5 in the Assumptions sheet
- A10: Selected Scenario
- B10: Base Case
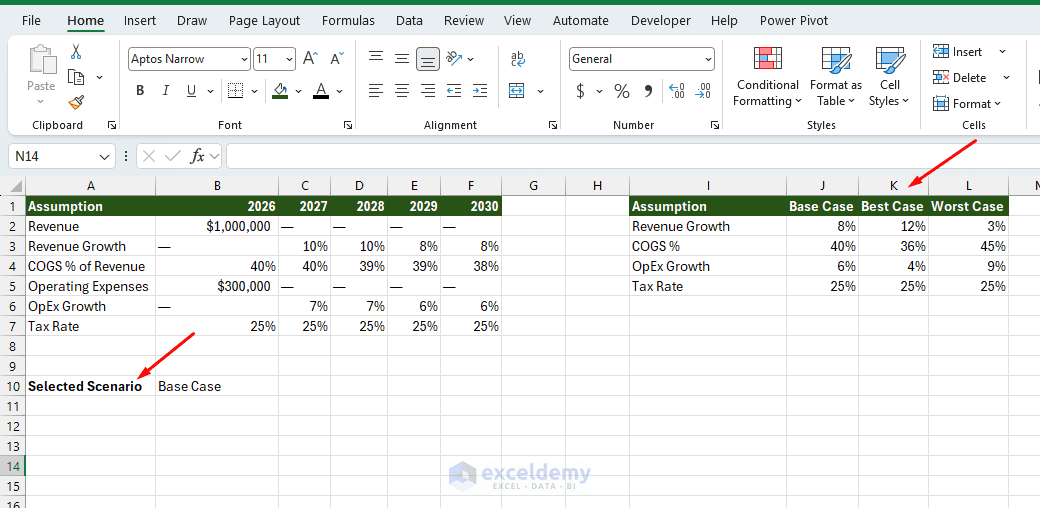
We will use B10 to control the model.
Step 6: Create a Scenario Drop-Down
- Select B10
- Go to the Data tab >> select Data Validation
- Choose List from the Allow box
- In Source, enter:
Base Case,Best Case,Worst Case
- Click OK
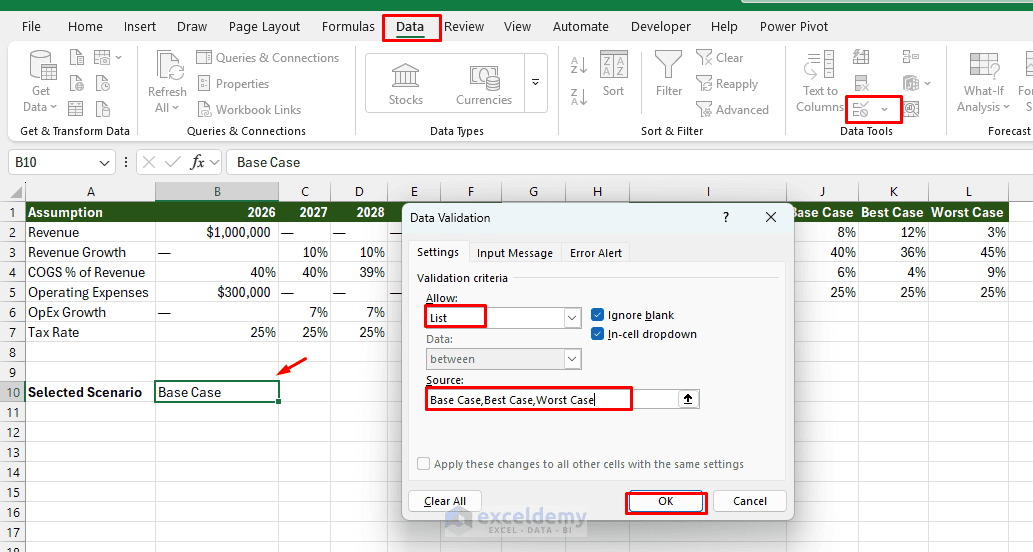
You can now select a scenario from the drop-down.
Step 7: Ask ChatGPT for Scenario Formulas
Next, replace the fixed assumptions with formulas that return values from the scenario table. You can ask ChatGPT to write formulas that return the assumption for the selected scenario.
Prompt:
My selected scenario is in B10. The scenario names Base Case, Best Case, and Worst Case
are in J1:L1. Revenue Growth is in J2:L2, COGS % in J3:L3, OpEx Growth in J4:L4, and
Tax Rate in J5:L5. Give me XLOOKUP formulas that return the selected assumption.
ChatGPT may return:
- Revenue Growth (B3):
=XLOOKUP($B$10,$J$1:$L$1,$J$2:$L$2)
- COGS % (B4):
=XLOOKUP($B$10,$J$1:$L$1,$J$3:$L$3)
- OpEx Growth (B6):
=XLOOKUP($B$10,$J$1:$L$1,$J$4:$L$4)
- Tax Rate (B7):
=XLOOKUP($B$10,$J$1:$L$1,$J$5:$L$5)
You can place these formulas in separate cells and use them as the active assumptions for the model.
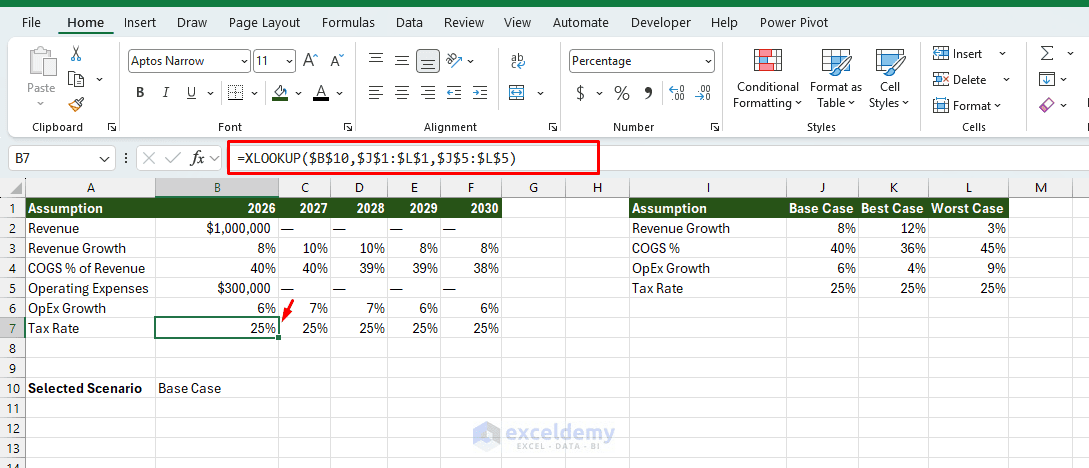
- The forecast model for the Base Case
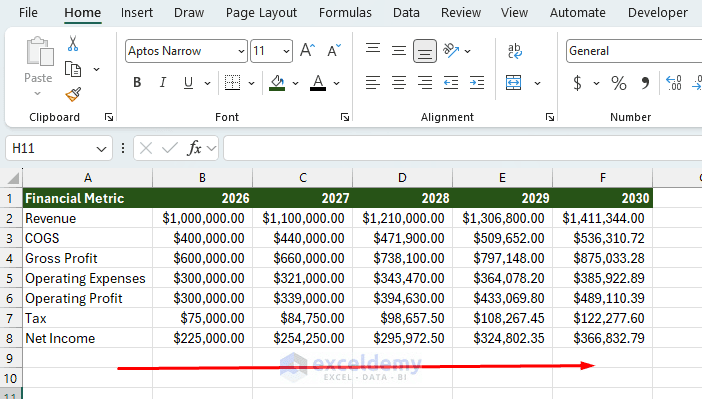
For example, when Best Case is selected, the Revenue Growth formula returns 12%. When Worst Case is selected, it returns 3%.
Step 8: Test the Financial Model
Switch between the three scenarios and check how the forecast changes.
- Select Best Case
- The model updates:
- Revenue Growth = 12%
- COGS = 36%
- Operating Expense Growth = 4%
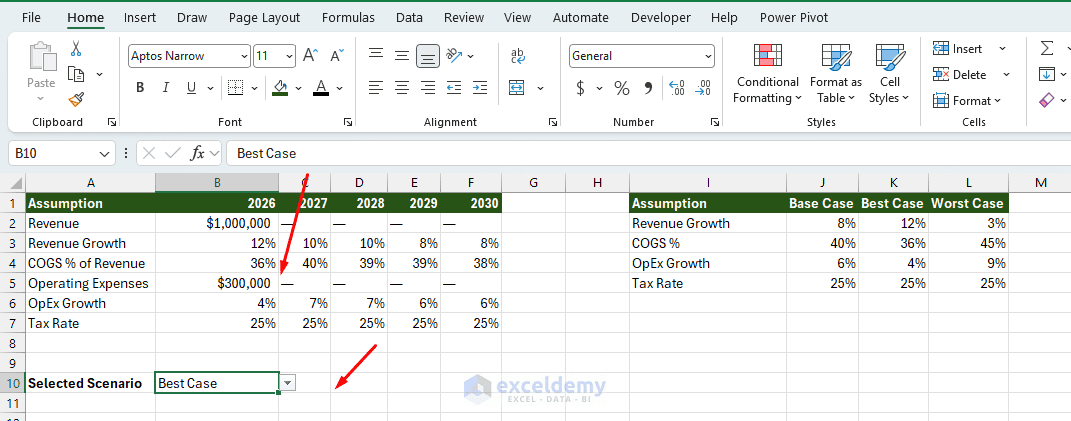
- Check the Forecast sheet
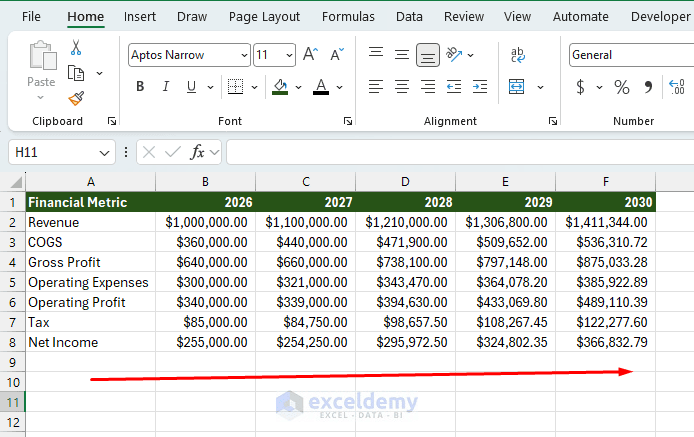
- Finally, select Worst Case:
- Revenue Growth = 3%
- COGS = 45%
- Operating Expense Growth = 9%
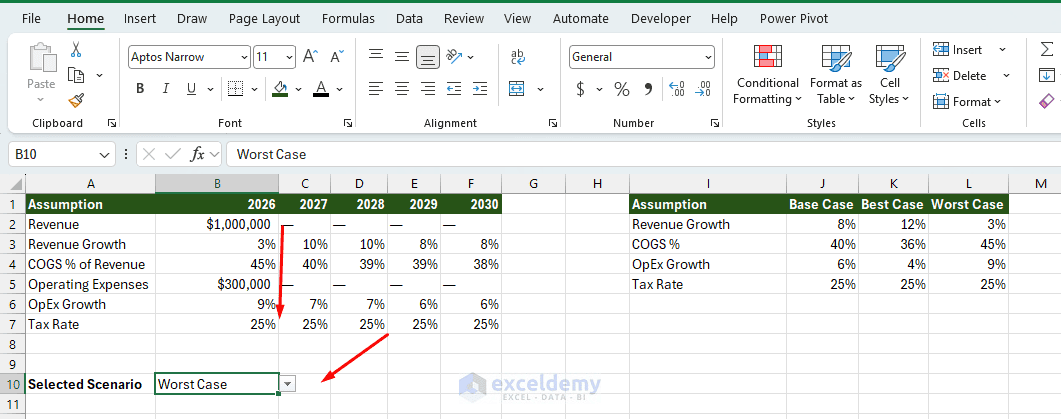
- The entire forecast should update automatically
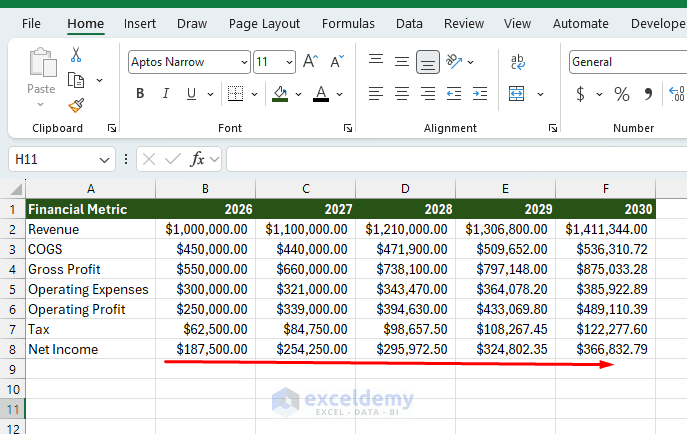
The Best Case should generally produce higher Revenue and Net Income, while the Worst Case should reduce profitability.
If the model does not change after selecting a scenario, check that the Forecast formulas reference the cells containing the selected scenario assumptions rather than the original fixed assumptions.
Tips for Better Financial Modeling Prompts
ChatGPT gives more useful formulas when your prompt includes the actual workbook structure. Include details such as:
- Worksheet names
- Cell references
- Forecast years
- Which assumptions vary by year
- Which formulas should be copied across
- Whether you want XLOOKUP, INDEX/MATCH, or another function
For example, instead of asking:
Give me a Revenue formula.
Ask:
Revenue Growth is in C3:F3 of the Assumptions sheet and changes by year.
Give me a Revenue formula for C2 that I can drag through F2.
This makes the response much more likely to match your workbook.
Conclusion
By following the steps above, you can build financial models in Excel with ChatGPT. ChatGPT can help simplify financial modeling by suggesting the model structure, identifying assumptions, generating forecast formulas, and creating scenario logic. The most effective approach is to give ChatGPT clear information about your worksheet layout and cell references rather than asking for a complete model with a vague prompt. Once the formulas are generated, review them carefully and make sure the financial logic matches your actual business assumptions.
Get FREE Advanced Excel Exercises with Solutions!

