Imagine you are handed a spreadsheet with tens of thousands of vendor payments and one question: is anything in here wrong? You cannot read every row, and the totals reconcile perfectly. This is where forensic accountants reach for a surprisingly simple tool: Benford’s Law. It provides a statistical method for detecting unusual patterns in financial data.
In this tutorial, we will analyze a real-world vendor-payment dataset to detect suspicious expenses with Benford’s Law in Excel. The case study has a deliberate twist: the file as a whole looks healthy, yet one vendor stands out clearly once you look closer.
What Is Benford’s Law?
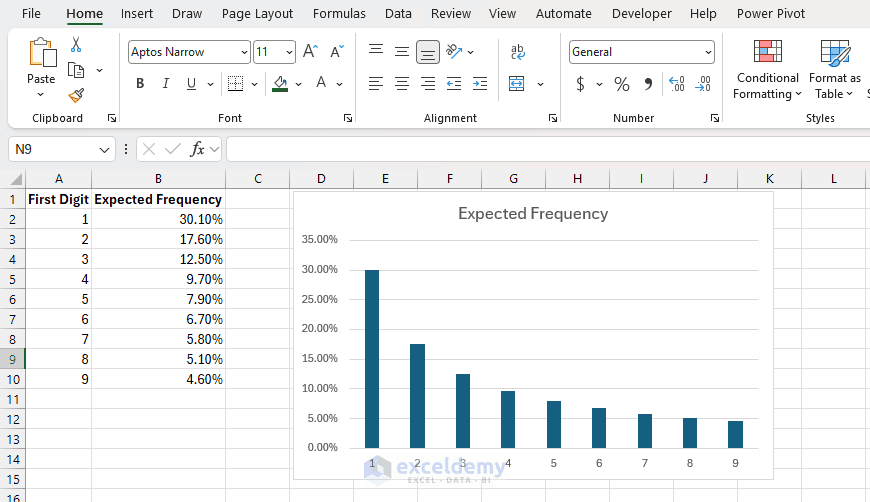
Benford’s Law states that in many naturally occurring numerical datasets, smaller digits appear more frequently as the first significant digit. The digit 1 appears as the first digit about 30% of the time, while 9 appears less than 5% of the time. The expected probability of a first digit d is:
P(d) = LOG10(1 + 1/d)The expected first-digit frequencies are:
| First Digit | Expected Frequency |
|---|---|
| 1 | 30.1% |
| 2 | 17.6% |
| 3 | 12.5% |
| 4 | 9.7% |
| 5 | 7.9% |
| 6 | 6.7% |
| 7 | 5.8% |
| 8 | 5.1% |
| 9 | 4.6% |
The pattern was noticed by Simon Newcomb in 1881 and described by Frank Benford in 1938. Accountant and researcher Mark Nigrini later popularized its use in auditing and fraud detection.
Why does it matter for expenses? Real payments come from many different processes: small purchases, mid-sized invoices, large contracts. When people invent numbers, or split and shape invoices to dodge an approval limit, the leading digits often drift away from the Benford pattern. A deviation is not proof of fraud, but it tells you where to look first.
Step 1: Download and Prepare the Vendor-Payment Dataset
We will use the City of Chicago’s publicly available Payments dataset, which provides information about payments made to vendors.
- Open the City of Chicago Payments dataset
- Export the dataset as a CSV or XLSX file
- Open Excel
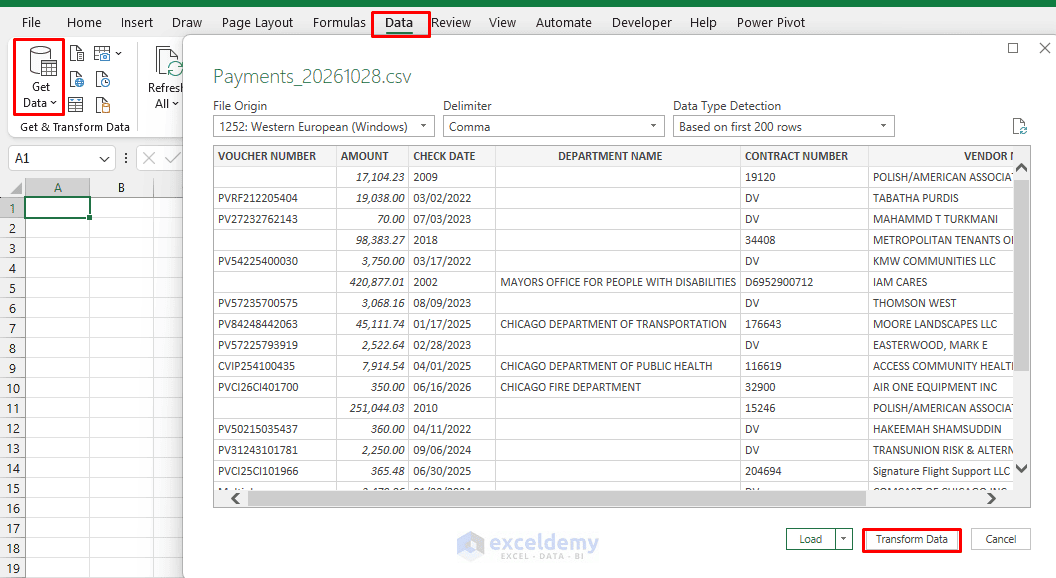
- Go to the Data tab >> select Get Data >> select From File >> select From Text/CSV
- Select the downloaded file >> click Transform Data
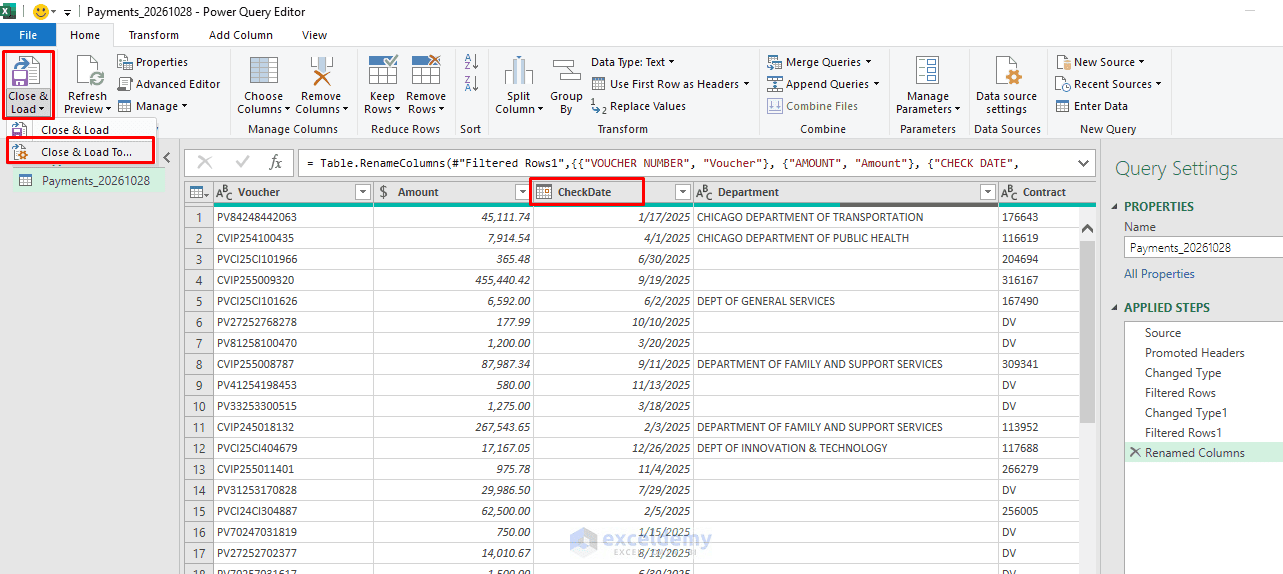
- Filter the CHECK DATE column to keep only 2025 payment records, then change its data type from Text to Date
- Exclude records where the voucher number is “Multiple”, which may represent aggregated payments
- Make sure the Amount column has a numeric data type
- Keep the following six fields and rename them as shown: Voucher, Amount, CheckDate, Department, Contract, and Vendor
- Go to the Home tab >> select Close & Load To to load the cleaned data into Excel as a table
- Go to the Table Design tab >> in Table Name, enter tblPayments
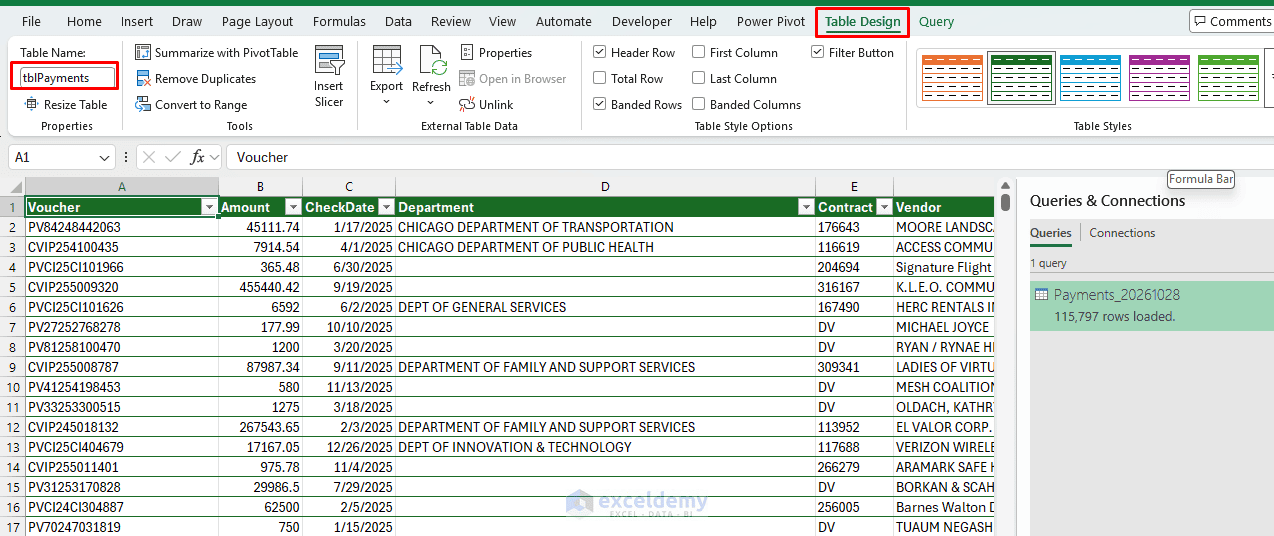
Note: We are using a recent year because older records in this dataset may contain summarized payments rather than individual transactions. We will analyze only positive amounts; refunds and negative adjustments should be reviewed separately.
Step 2: Extract the First Digit of Each Payment
- Create a new column named FirstDigit in column G
- Enter the following formula:
=IFERROR(IF([@Amount]>0,INT([@Amount]/10^INT(LOG10([@Amount]))),""),"")This formula identifies the first significant digit of each positive payment, including values below $1.
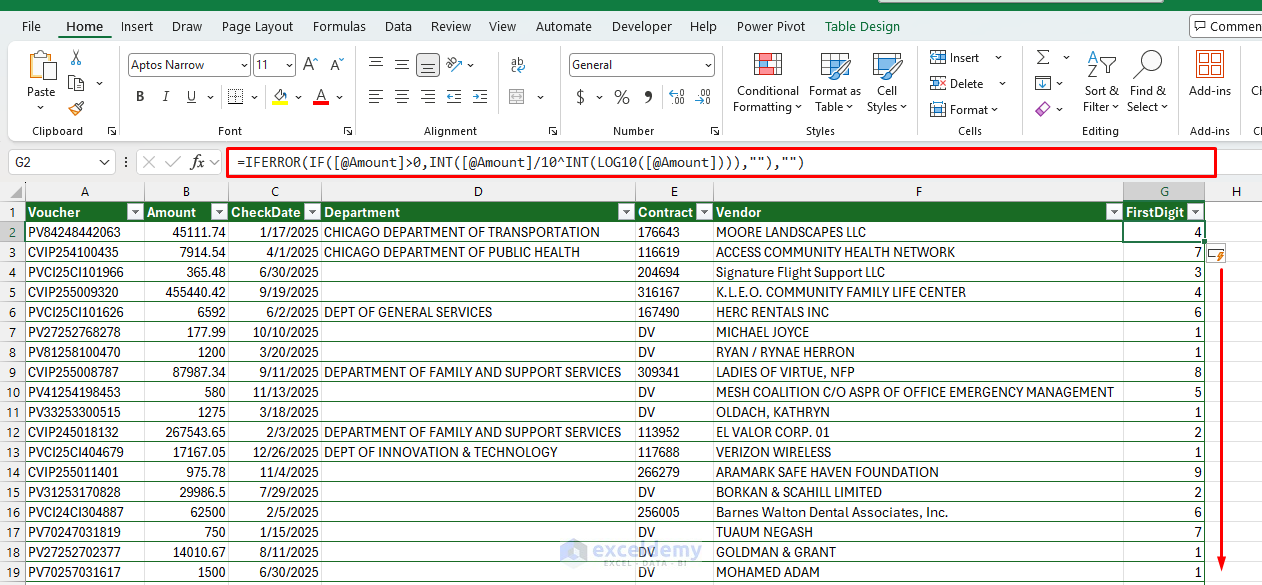
These amounts are examples to illustrate how the formula works, not records extracted from the dataset. Since the data is formatted as an Excel table, the formula automatically fills the entire column.
Step 3: Calculate Actual and Expected First-Digit Frequencies
- Create another worksheet named Benford Analysis
- Prepare the following columns:
- First Digit
- Expected %
- Actual %
- Difference
- Count
Insert First Digit
- Enter digits 1 through 9 in cells A2:A10
Calculate expected frequencies
- In B2, enter the following formula and copy it down to B10:
=LOG10(1+1/A2)- Format the Expected % column as percentages
This calculates the probability of each digit appearing first according to Benford’s Law.
Calculate actual frequencies
- In C2, enter the following formula and copy it down to C10:
=IFERROR(COUNTIF(tblPayments[FirstDigit],A2)/COUNT(tblPayments[FirstDigit]),0)This calculates the percentage of valid payments beginning with each digit.
Calculate the difference
- In D2, enter:
=C2-B2Positive differences indicate that a particular digit appears more frequently than Benford’s Law predicts.
Count the occurrences
- In E2, enter:
=COUNTIF(tblPayments[FirstDigit],A2)The table will now show the expected and actual distributions alongside their differences.
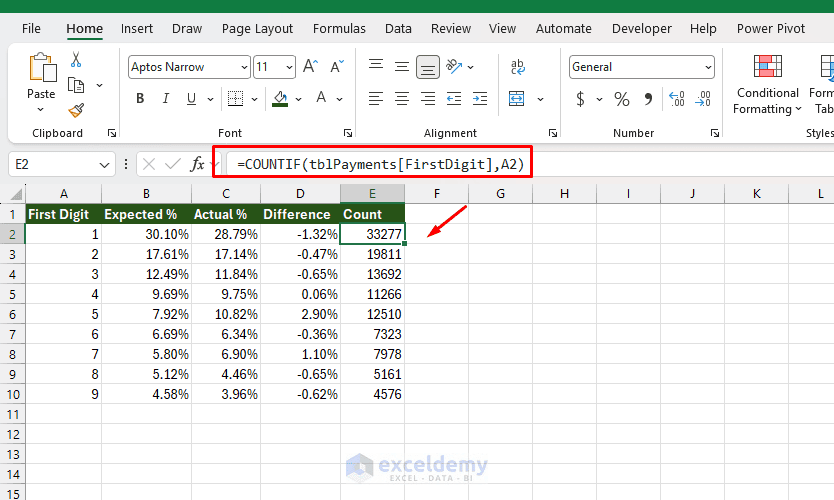
Step 4: Create a Benford’s Law Comparison Chart
A chart makes unusual payment patterns easier to recognize.
- Select B1:C10 (Expected % and Actual %)
- Go to the Insert tab >> select Combo Chart >> select Clustered Column – Line
- Set Actual % to Clustered Column
- Set Expected % to Line with Markers
- Click OK
- Right-click the chart >> click Select Data
- Under Horizontal (Category) Axis Labels, click Edit
- Select A2:A10 >> click OK
- Change the chart title to Benford’s Law vs. Actual Vendor Payments
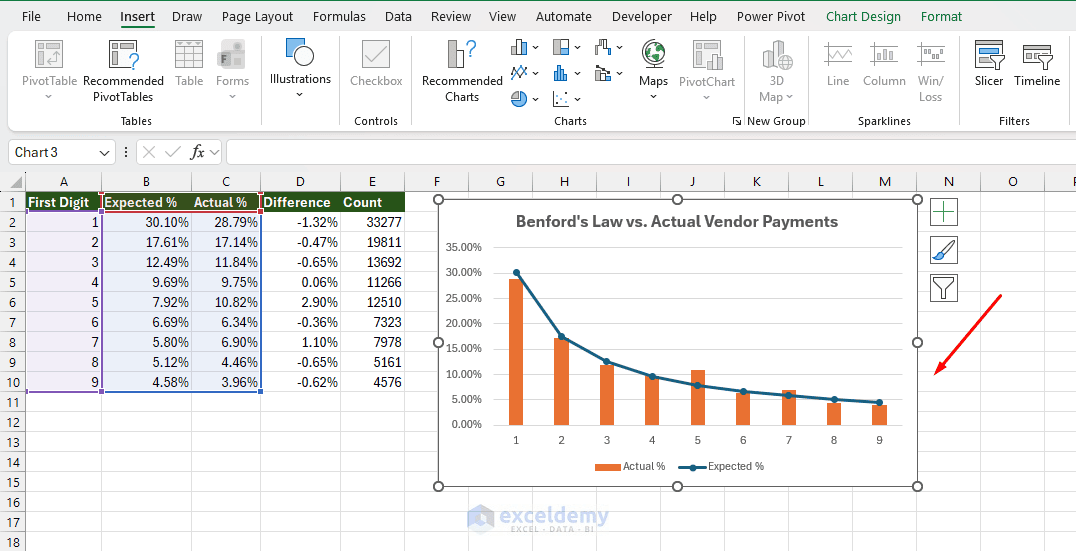
The resulting chart compares the actual leading-digit frequencies against the expected Benford distribution. Look for digits where the actual bars rise noticeably above the expected line. These are potential areas for further investigation, provided the payment population is suitable for Benford analysis.
Interesting finding from the data: Digit 5 appears in 10.82% of payments, compared with the expected 7.92%, a difference of +2.90 percentage points. This is worth investigating in the next step, but it doesn’t establish fraud.
Step 5: Identify Vendors Contributing to Unusual Digits
The comparison chart shows that payments beginning with 5 occur more frequently than expected. We can investigate which vendors account for those payments.
- Create a worksheet named Vendor Review
- Enter 5 in H2 as the digit to investigate; you can replace it with any digit that appears unusually frequently in your own analysis
- Add these headers in A1:F1:
Vendor | Digit Payments | Total Payments | Digit Share | Difference | Excess PaymentsList the relevant vendors
- In A2, enter:
=SORT(UNIQUE(FILTER(tblPayments[Vendor],(tblPayments[FirstDigit]=H2)*(tblPayments[Vendor]<>""))))This formula automatically spills a list of the vendors with payments beginning with the selected digit.
Count payments with the selected digit
- In B2, enter:
=COUNTIFS(tblPayments[Vendor],A2,tblPayments[FirstDigit],$H$2)Count all valid payments for each vendor
- In C2, enter:
=COUNTIFS(tblPayments[Vendor],A2,tblPayments[FirstDigit],">0")Calculate the vendor’s first-digit percentage
- In D2, enter:
=IFERROR(B2/C2,0)Compare with Benford’s Law
- In E2, enter:
=IF(C2>=100,D2-LOG10(1+1/$H$2),"")Calculate excess payments for the selected digit
- In F2, enter:
=B2-C2*LOG10(1+1/$H$2)- Copy the formulas in B2:F2 down for all vendors
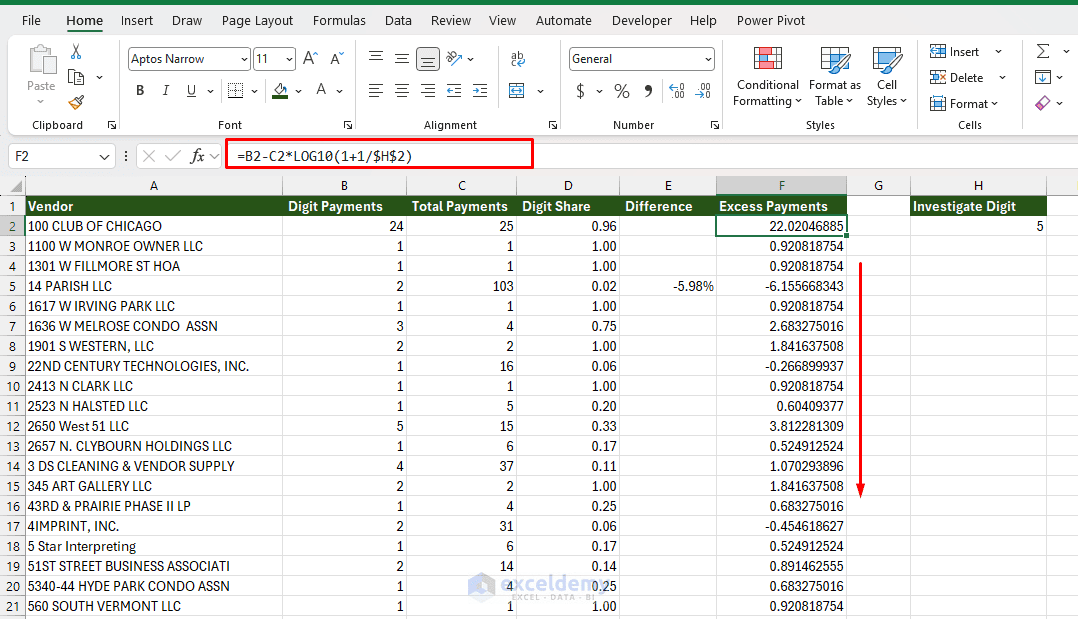
The Difference column compares each vendor’s actual first-digit percentage with Benford’s expected percentage. Vendors with fewer than 100 valid payments are left unscored to reduce misleading comparisons from small samples.
The Excess Payments column estimates how many more payments begin with the selected digit than Benford’s Law predicts. Larger positive values indicate vendors contributing more to the overall deviation.
The 100-payment threshold is an exploratory screening criterion, not a statistical guarantee. These results help prioritize vendors for further investigation but do not prove fraudulent activity.
Step 6: Highlight Vendors and Investigate Their Payments
We will now use conditional formatting and FILTER to examine vendors with unusual payment patterns.
Highlight Vendors with Large Differences
- Select the populated rows in column A of the Vendor Review worksheet
- Go to the Home tab >> select Conditional Formatting >> select New Rule
- Select Use a formula to determine which cells to format
- Enter the following formula:
=AND(C2>=100,E2>10%)- Choose a light red fill >> click OK
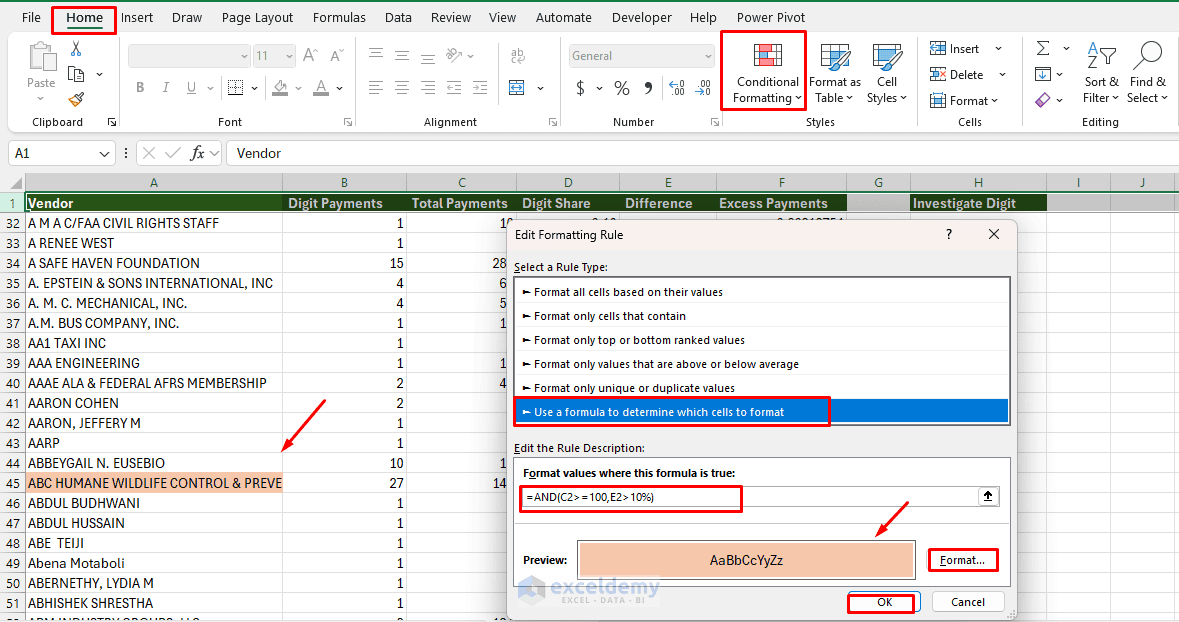
This highlights vendors whose selected-digit frequency exceeds the Benford expectation by more than 10 percentage points and who have at least 100 valid payments.
This is an adjustable investigation-priority rule, not a validated fraud threshold.
Filter the Transactions for a Selected Vendor
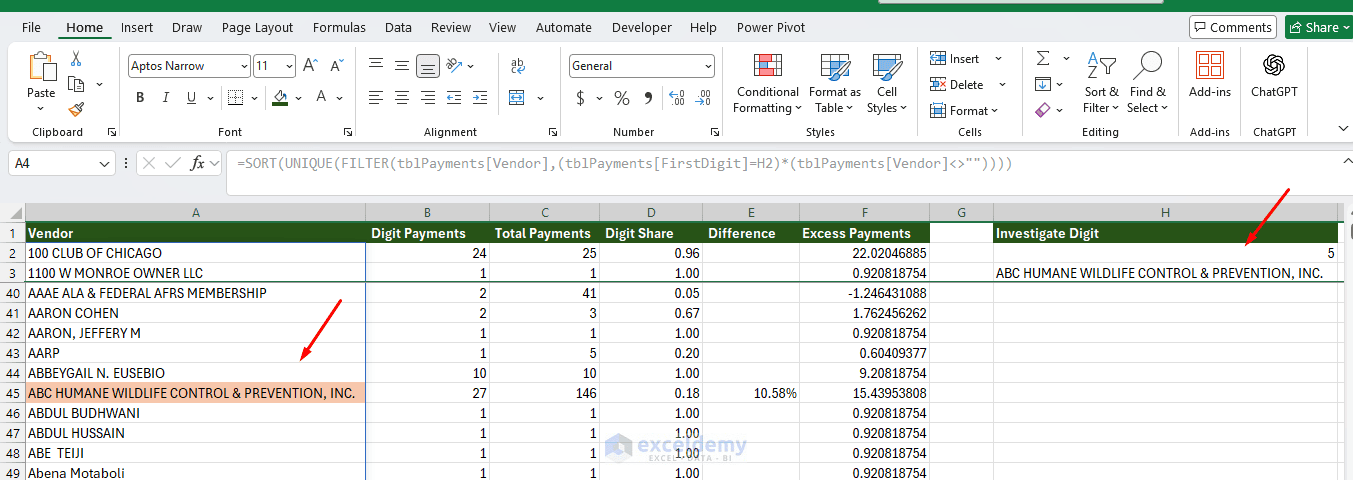
- Enter a vendor name from the highlighted list into cell H3 of the Vendor Review worksheet
- Here, we select “ABC HUMANE WILDLIFE CONTROL & PREVENTION, INC”. You can change it to any vendor you want to review
- Create a new worksheet named Investigation, with the same seven headers as the tblPayments table
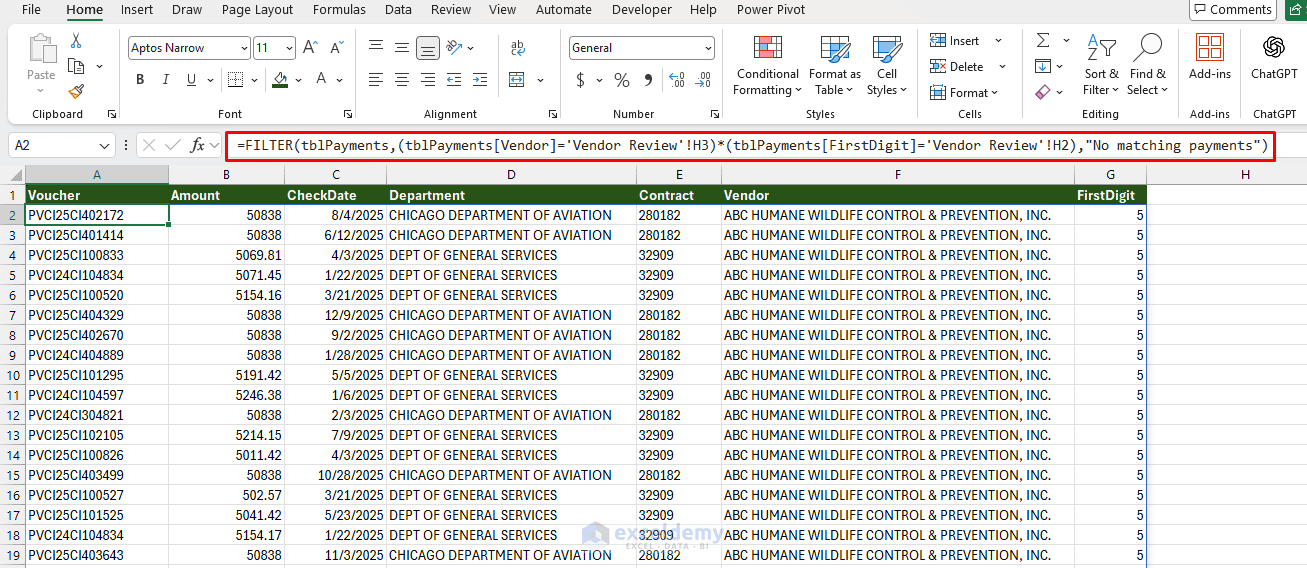
- In A2, enter:
=FILTER(tblPayments,(tblPayments[Vendor]='Vendor Review'!H3)*(tblPayments[FirstDigit]='Vendor Review'!H2),"No matching payments")This displays all matching transactions for the selected vendor and digit.
Highlight Repeated Payment Amounts
- In the Investigation worksheet, select the Amount column of the results, starting from B2
- Create another conditional formatting rule using:
=AND(ISNUMBER(B2),COUNTIF($B$2:$B$5000,B2)>1)- Choose a yellow fill >> click OK
Excel will highlight transactions containing repeated amounts within the filtered results.
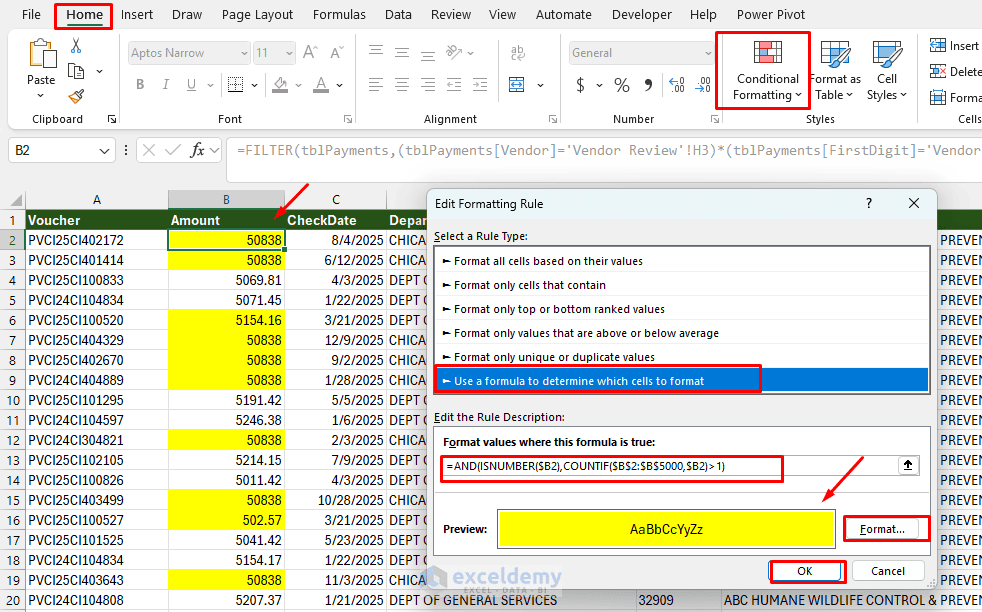
You can now examine whether the payments have identical amounts, recurring dates, matching voucher numbers, or other patterns that warrant checking against invoices and contracts.
Repeated amounts may be entirely legitimate, particularly for subscriptions, fixed-price contracts, and scheduled payments.
Step 7: Flag Potentially Suspicious Payments
We identified several repeated payment amounts during our investigation. To narrow the results, we’ll flag payments where the same vendor received the same amount on the same date under different voucher numbers.
Add a Review Flag
- Change the vendor in cell H3 of the Vendor Review worksheet to “MOBILE FACILITIES OF ILLINOIS, INC.”
- In the Investigation worksheet, enter Review Flag in H1
- In H2, enter:
=IF(A2="","",IF(COUNTIFS(tblPayments[Vendor],F2,tblPayments[Amount],B2,tblPayments[CheckDate],C2,tblPayments[Voucher],"<>"&A2)>0,"Review",""))Copy the formula down. It checks the original payment dataset and marks only matching same-day payments with different voucher numbers.
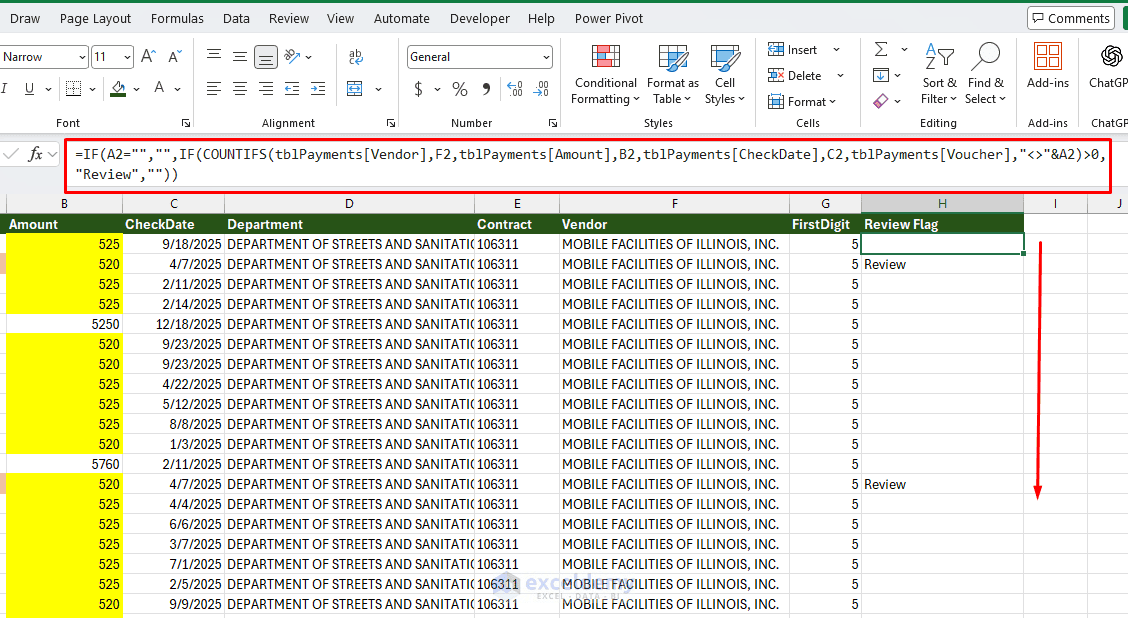
This identifies two situations:
- Check possible duplicate: Same vendor, amount, and payment date appear more than once.
- Check recurring payment: Same vendor and amount appear multiple times, possibly on different dates.
Highlight Flagged Payments
- Select A2:A28
- Go to the Home tab >> select Conditional Formatting >> select New Rule
- Create another conditional formatting rule using:
=$H2="Review"- Choose a light red fill and click OK
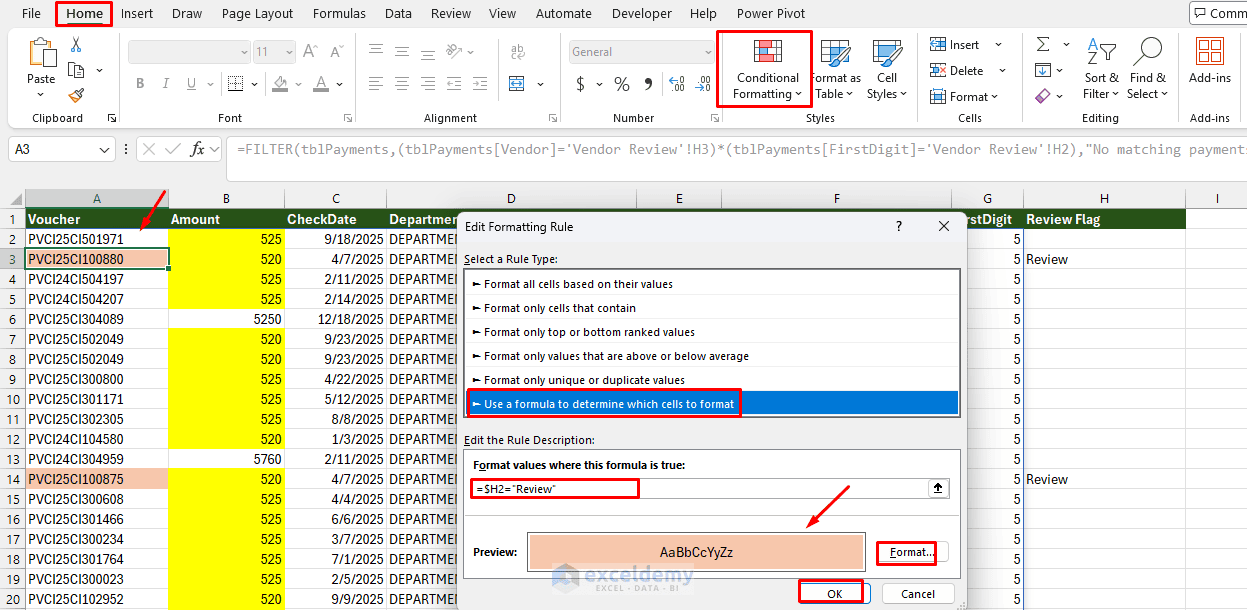
Now, only transactions marked Review are highlighted. Examine their vouchers, invoices, and supporting records to determine whether the payments are legitimate.
Finding: The analysis identified an unusual frequency of payments beginning with digit 5. This additional check helps narrow the investigation to potentially duplicate same-day payments. These flags are screening indicators, not proof of fraud.
Step 8: Summarize the Findings
Our analysis of 115,594 valid payment records revealed several patterns:
- Digit 5 showed the largest positive deviation. It appeared in 10.82% of transactions, compared with the expected 7.92%.
- Approximately 3,357 additional digit-5 payments were observed relative to Benford’s expected count. These are statistical excess occurrences, not identified fraudulent transactions.
- Digit 7 also exceeded the expected frequency, appearing in 6.90% of payments compared with 5.80%.
- Repeated payment amounts such as $50,838, $5,154.16, and $502.57 were identified in the vendor investigation.
- Transaction-level checks were introduced to flag matching same-day payments under different vouchers for verification.
The analysis identified unusual digit frequencies and repeated payment patterns. However, these findings do not establish fraudulent activity or confirm duplicate invoices.
Before drawing conclusions, auditors would need to examine payment vouchers, invoices, vendor contracts, and authorization records.
When Benford’s Law Does Not Apply
Before trusting any result, check that the data is a fair candidate:
- Too few records: Aim for at least a few hundred for a whole-file test, and treat small vendor samples with caution. Benford’s Law works best with sufficiently large datasets containing naturally occurring values that span different orders of magnitude.
- Narrow value range: Data should span several orders of magnitude. Amounts confined to, say, 100 to 900 will not follow the law.
- Assigned or capped values: Fixed fees, price lists (such as many items at 9.99), minimum charges, and policy limits create legitimate spikes.
- Identifiers, not measurements: Invoice numbers, phone numbers, and account codes are labels and should not be tested.
- Mixed populations: Combine very different payment types only if you would expect them to follow the same process.
An alarm from the test is a prompt to ask questions, such as whether a contract fixes the price or whether a policy caps the amount, before suspecting wrongdoing.
Conclusion
We have shown a step-by-step procedure to detect suspicious expenses with Benford’s Law in Excel using a real-world case study. Benford’s Law provides a useful starting point for detecting unusual patterns in large financial datasets. By combining first-digit formulas, a comparison chart, FILTER, and conditional formatting, you can move from thousands of payment records to a focused list of transactions worth reviewing. The key takeaway is that Benford’s Law is an anomaly-detection technique, not a fraud-detection verdict. Unusual digit frequencies can help auditors decide where to investigate, but only further evidence can establish whether a payment is improper.
Get FREE Advanced Excel Exercises with Solutions!