
A Power BI report can have accurate data and useful charts but still be difficult to read. Too many visuals, inconsistent colors, small labels, and unnecessary filters can make it harder for users to find important information. A well-designed report should answer questions quickly. Readers should be able to understand the main results without checking every chart or clicking through multiple filters.
In this tutorial, we will show 7 Power BI design rules for reports people actually read. The seven rules cover page layout, KPI placement, color consistency, slicers, chart readability, interactions, and mobile optimization.
Rule 1: Make Each Report Page Answer One Main Question
A common report design mistake is trying to display everything on a single page. When sales trends, targets, regional performance, and product details appear together, readers may not know where to look first.
Our original Sales Performance report has this problem. It shows overall KPIs, monthly revenue, regional profit, category comparisons, a target gauge, and product-level data on the same page. Instead, we can organize the report around specific business questions.
Before: All information on one page
The original report tries to answer several questions at once:
- How much revenue did we generate?
- Are we meeting our targets?
- Which region is most profitable?
- Which products perform best?
All the information is useful, but not every reader needs all these details at the same time.
After: Two focused report pages
We will divide the report into two pages.
| Page | Main question | Visuals |
|---|---|---|
| Sales Overview | How is the business performing overall? | KPI cards, Revenue vs. Target, Revenue by Category |
| Performance Details | Which regions and products drive performance? | Profit by Region, Revenue by Region, Product table, Profit vs. Target gauge |
Steps to Reorganize the Report
- Open the existing Sales Performance Report in Power BI Desktop
- Right-click the existing report page tab >> select Duplicate page
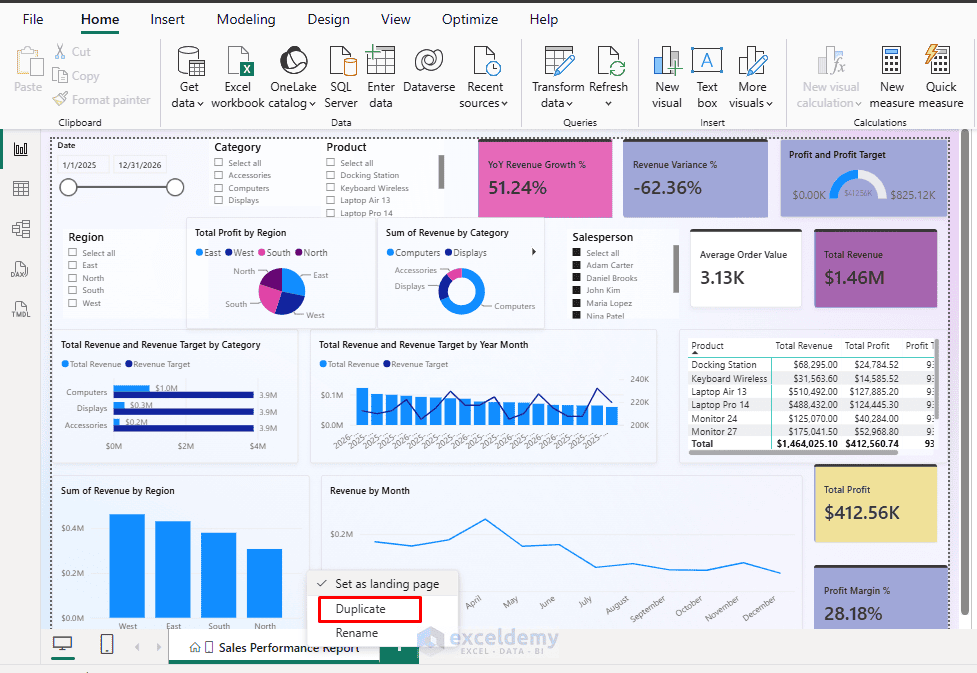
- Rename the first page Sales Overview and the second page Performance Details
- On the Sales Overview page, remove the product table, regional detail charts, and gauge
- Keep the overall KPI cards, monthly Revenue vs. Target chart, and Revenue by Category chart
- On the Performance Details page, remove the duplicate overview visuals and retain the regional, product, and target analysis visuals
- Go to the Insert tab >> expand Buttons >> select Navigator >> select Page navigator
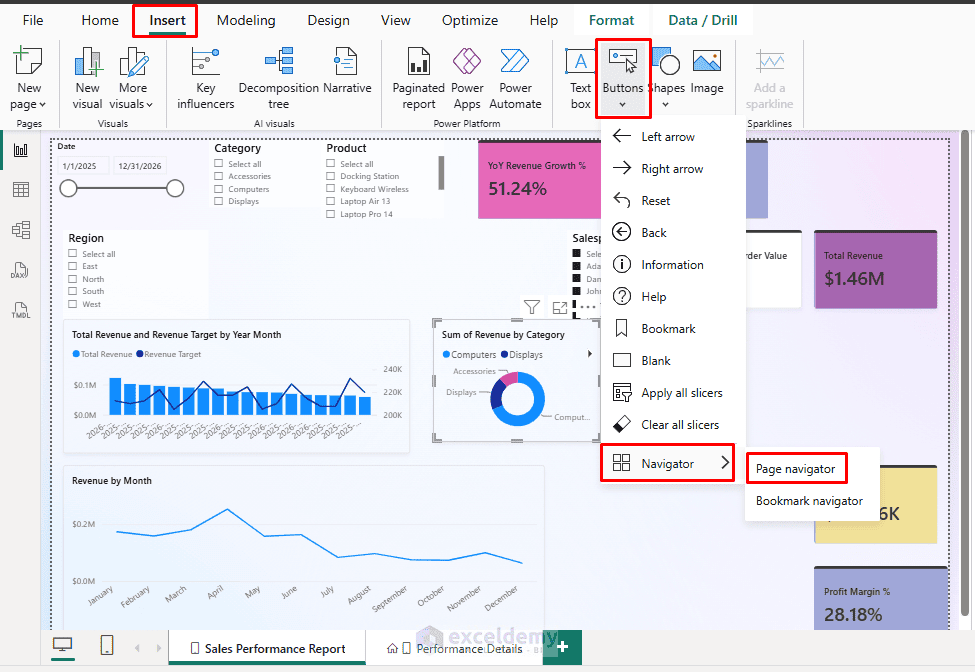
Power BI automatically creates page navigation buttons based on the report page names.
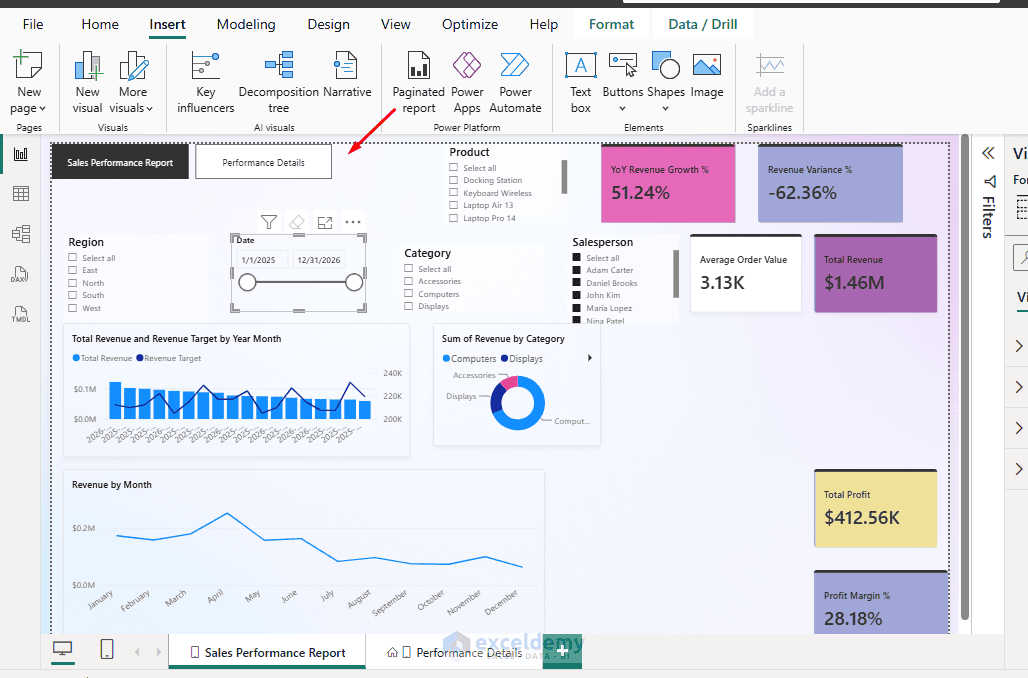
Now, readers can open the Sales Overview page to understand overall performance and switch to Performance Details when they need more information.
Design tip: Before adding a chart, ask what question it helps answer. If the chart does not support the page’s main question, consider moving it to another page.
Rule 2: Put the Most Important KPI Cards First
Readers should not need to search through charts to find basic performance numbers. KPI cards give readers a quick summary of business performance. Important numbers should be easy to find without scrolling through charts or tables.
However, if these cards are scattered across a report page or placed below detailed charts, they lose their usefulness.
Before: KPI cards scattered across the report
The Total Revenue and Total Profit cards appear in different areas. Other KPIs are placed between charts, making them difficult to compare quickly.
After: Place key metrics together at the top
We will organize four primary KPIs in one row:
Improved KPI arrangement
- Total Revenue
- Total Profit
- Profit Margin
- YoY Revenue Growth
- Revenue Variance
Steps to Organize KPI Cards:
- Open the Sales Overview page
- Select the Total Revenue card and move it to the upper-left section of the report canvas
- Place Total Profit, Profit Margin, and YoY Revenue Growth beside it
- Select all cards using Ctrl+Click
- Use the contextual Format ribbon’s alignment and distribution commands, where available, to align their top edges and space them evenly
- Resize the cards to maintain a consistent height and width
- Select each card >> open Format visual to adjust the labels, values, backgrounds, and borders
Use approximately 24–32 pt for the main numbers and 11–13 pt for their labels, adjusting based on the available space. Keep the background simple and avoid unnecessary decorative borders.
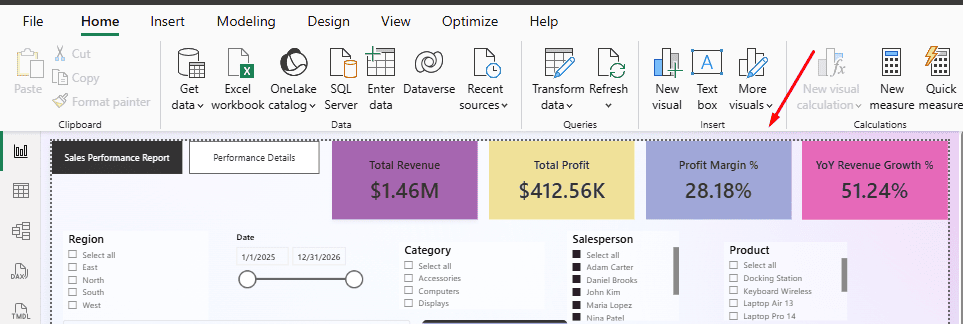
Readers can now identify overall revenue, profit, margin, and growth immediately.
Design tip: Limit the primary KPI row to the few metrics that matter most. Secondary metrics can appear near the chart they help explain.
Rule 3: Use Consistent Colors to Communicate Meaning
Colors are useful for distinguishing metrics and highlighting important changes. However, when the same metric appears in different colors, readers may find the report confusing.
Before: Different colors without a consistent meaning
In the original report, revenue appears in blue in one chart and purple in another. Profit uses other colors, while positive and negative values are not clearly distinguished. Readers must repeatedly check the legends to understand each chart.
After: Apply a consistent color system
We will use the following colors throughout our report.
- Revenue: Blue · #2563EB
- Profit and positive performance: Teal · #0F766E
- Targets and comparisons: Gray · #64748B
- Negative variance: Orange · #C2410C
For example, the Revenue by Category and Revenue by Region charts will both use blue. Profit by Region will use teal, while target values will use gray.
Steps to Apply a Consistent Color Theme:
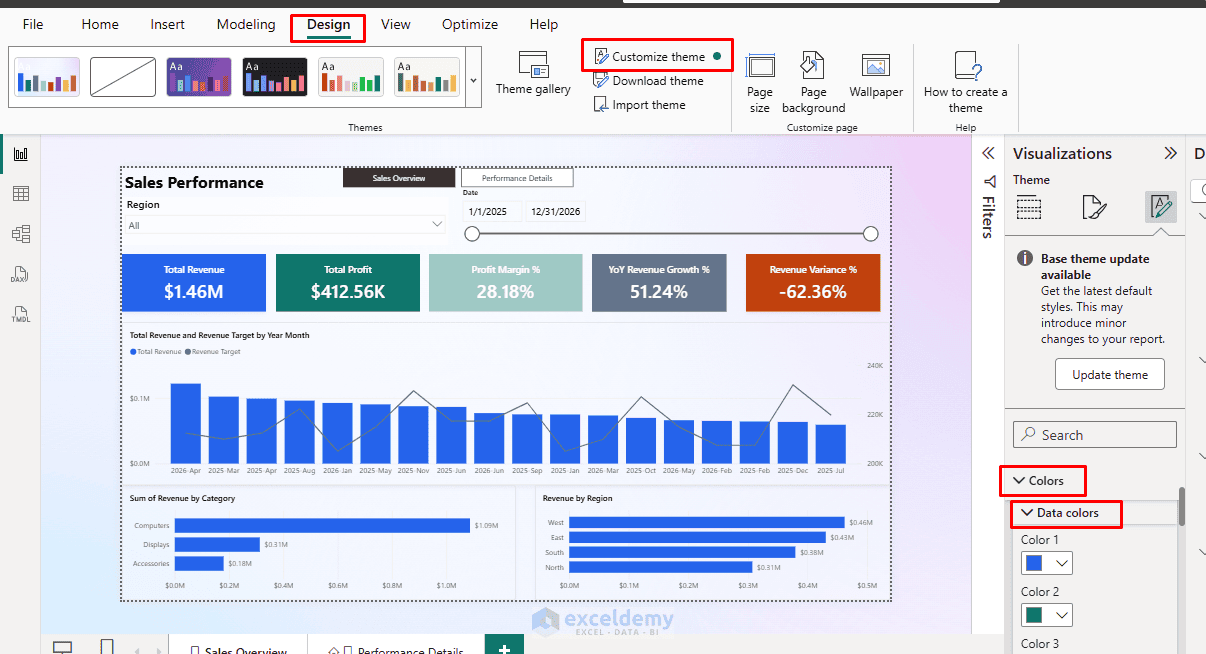
- Go to the Design tab in Power BI Desktop >> select Customize theme
- Open the Colors section in the Theme pane
- Configure a color palette using the colors shown above
- Apply the theme to the report
- Select the Revenue by Category chart >> open Format visual
- Find its data color settings >> set the revenue series to blue (#2563EB)
- Repeat the process for the other charts, applying teal to profit and gray to target series
The Design ribbon supports customizing theme colors and visual defaults. However, individual visual color settings can override theme defaults, so check important charts after applying the theme.
- For the Revenue vs. Target chart, apply blue to the revenue columns and gray to the target line
- Keep the negative Revenue Variance visible with an orange indicator and its numerical percentage
- Do not communicate negative performance through color alone
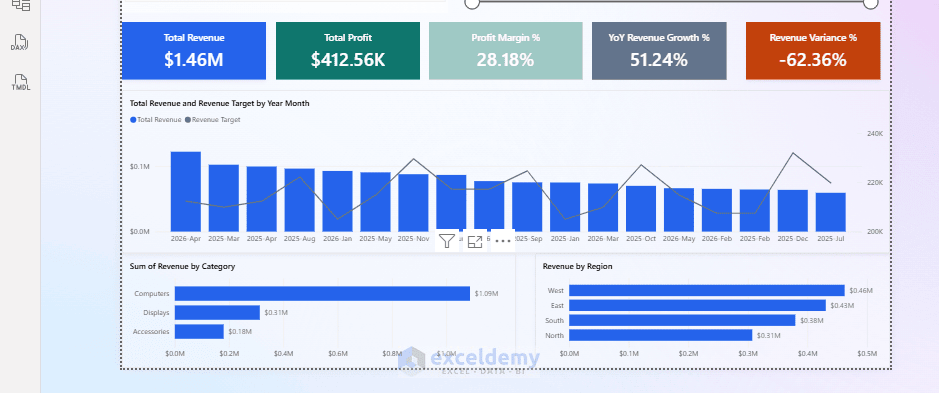
A reader can now recognize the meaning of each color without repeatedly checking the legends.
Design tip: Choose colors based on what they represent. Avoid changing a metric’s color simply to make each chart look different.
Rule 4: Keep Only the Most Useful Slicers Visible
Slicers let readers filter reports without changing the underlying data. They are useful, but having too many slicers can take attention away from the charts.
The existing report contains six slicers: Region, Date, Product Category, Product Name, Salesperson, and Year. Some overlap, while others are mainly needed for detailed analysis.
Before: The top of the report is filled with slicers
Users see several filter controls before reaching the actual report visuals. The slicers reduce the available space for charts, and it may be unclear which filters are most important.
After: Use two primary slicers
For the Sales Overview page, we will keep only Region and Date visible. The Product Category, Product Name, Salesperson, and Year fields can remain available through the Filters pane or be used on the Performance Details page when needed.
Steps to Simplify Slicers:
- Open the Sales Overview page
- Delete the Product Category, Product Name, Salesperson, and Year slicer visuals from that page
- Keep the existing Region and Date slicers
- Select the Region slicer >> open Format visual >> Visual >> Slicer settings >> Options
- Change its style to Dropdown
- Select the Date slicer >> set its style to Between to show a date range
- Resize and align both slicers at the top of the report
- Add less frequently used fields to the Filters pane if readers still need them
The Dropdown style saves space, while the Between style allows readers to select a date range.
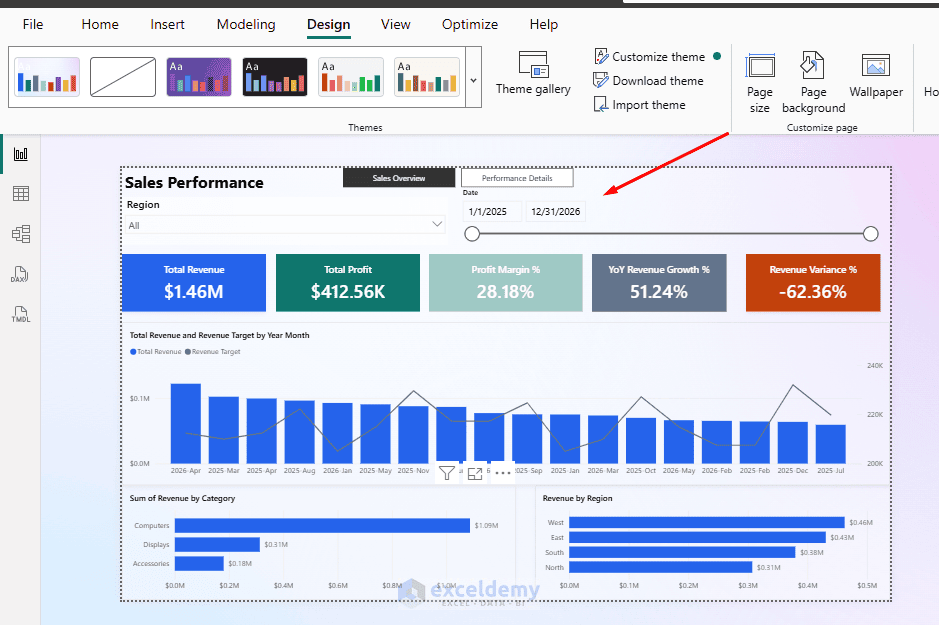
Sync Slicers Between Pages
If you want the same Region and Date selections to apply across both report pages:
- Select the Region slicer
- Go to the View tab >> select Sync slicers
- Enable synchronization for Sales Overview and Performance Details
- Repeat the process for the Date slicer
- Choose whether each synced slicer should also be visible on the other page
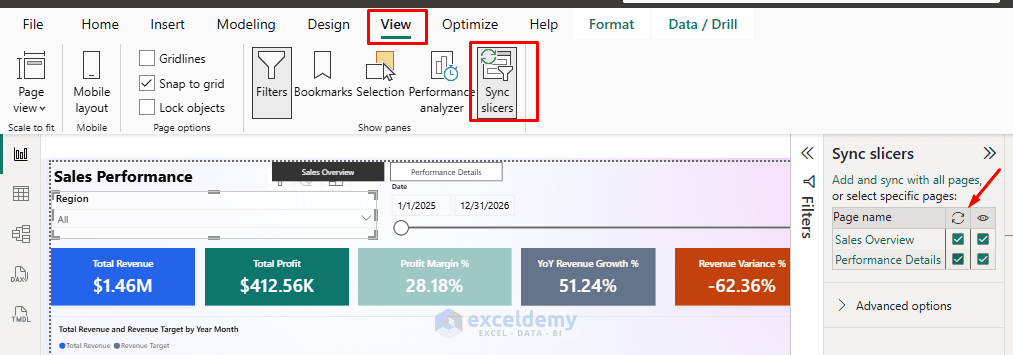
The report now has a cleaner filtering area, while users can still perform more detailed analysis when necessary.
Design tip: Keep frequently used filters visible and move occasional filters to the Filters pane. Do not remove useful filtering options just to reduce the number of slicers.
Rule 5: Use Clear Titles and Readable Labels
A report should be understandable without requiring readers to study its technical field names. Long chart titles, overlapping labels, and unnecessary decimal places make information harder to interpret.
Before: Technical titles and crowded labels
Our original report includes charts titled “Total Revenue and Revenue Target by Year Month” and “Total Revenue and Revenue Target by Category”.
These titles are accurate but longer than necessary. The monthly chart also contains many date labels, which appear crowded along the horizontal axis. The Profit by Region pie chart includes several small percentage and value labels.
After: Short titles and easy-to-read visuals
We will simplify the chart titles and adjust their formatting.
| Before | After |
|---|---|
| Total Revenue and Revenue Target by Year Month | Monthly Revenue vs. Target |
| Total Revenue and Revenue Target by Category | Revenue vs. Target by Category |
| Total Profit by Region | Profit by Region |
| Revenue by Month | Monthly Revenue Trend |
We will also replace the regional profit pie chart with a horizontal bar chart, making the values easier to compare.
Steps to Improve Chart Readability
- Select the Monthly Revenue vs. Target chart
- Open Format visual >> General >> Title
- Replace the existing title with Monthly Revenue vs. Target
- Set the title font size to approximately 14–16 pt
- Open the visual’s X-axis and Y-axis formatting settings and increase label sizes where necessary
- Use suitable display units such as Thousands (K) or Millions (M) to shorten large numbers
- Remove unnecessary gridlines and redundant axis titles
- Repeat the title and label formatting for the remaining charts
Replace the Profit by Region Pie Chart
Our original report uses a pie chart to compare profit across four regions. A bar chart is often easier to interpret because readers can compare the bar lengths instead of estimating differences between slices.
To replace the visual:
- Open the Performance Details page
- Select the Profit by Region pie chart
- In the Visualizations pane >> select Clustered bar chart
- Keep Region on the Y-axis and the existing Total Profit measure on the X-axis
- Sort the chart by Total Profit in descending order
- Apply the teal profit color from Rule 3
- Turn on data labels where they improve readability
- Sort the monthly trend chronologically and the category bars by Total Revenue in descending order
The charts now communicate their purpose quickly, and readers can compare values without struggling with crowded labels.
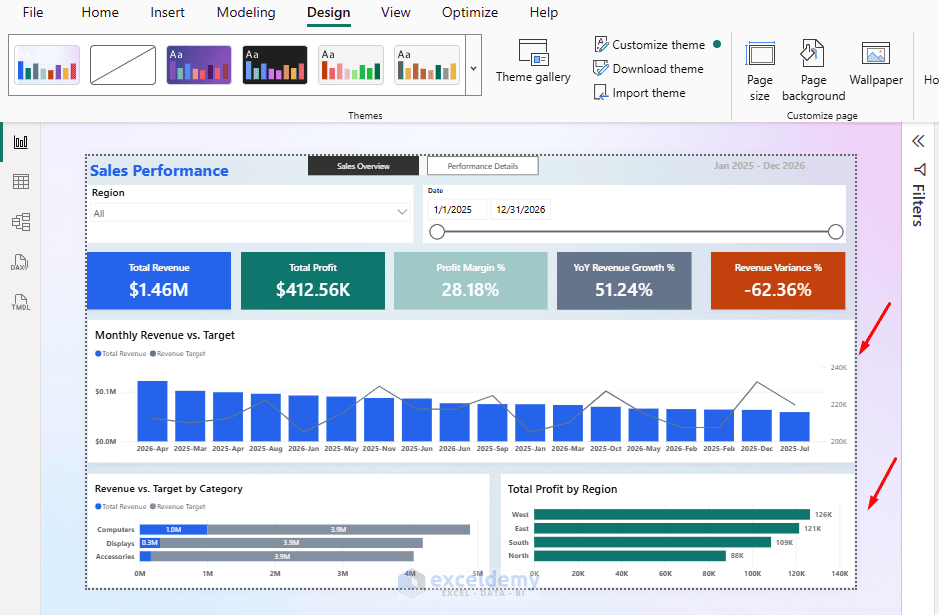
Design tip: Give each chart a title that describes the information readers will see. Remove text and labels that do not help them interpret the results.
Rule 6: Make Visual Interactions Purposeful
Power BI allows visuals to interact with one another. For example, selecting a region in one chart can filter or highlight related data in another chart. However, default interactions are not always appropriate for every report.
Before: Chart selections affect unrelated visuals
In our original report, selecting a region can change several other visuals. This behavior is useful for exploring related data, but it can also change metrics that readers expect to remain as a comparison.
After: Configure interactions based on purpose
We will set the regional revenue chart to filter the product performance table while keeping the regional profit chart and the target gauge unaffected by selections made directly on the chart.
Steps to Configure Visual Interactions
- Open the Performance Details page
- Select the Revenue by Region bar chart
- Go to the Format tab >> click Edit interactions
- Interaction icons will appear above the other visuals
- On the product performance table, select the Filter icon
- Review the interaction with the Revenue by Month chart and choose Filter or Highlight, depending on your intended comparison
- Click Edit interactions again to exit
Power BI provides Filter, Highlight, and None options for supported interactions. Available options depend on the target visual type.
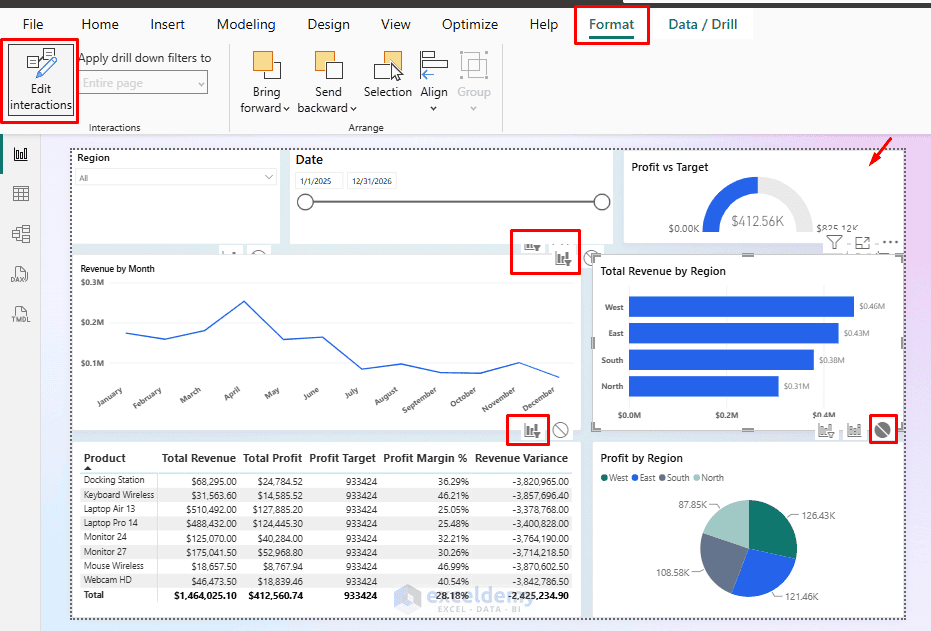
Now, selecting a region in the Revenue by Region chart filters the product table and other charts, while the gauge and the Profit by Region chart are unaffected by this specific chart selection.
Remember: Page filters and slicers can still affect the gauge and the Profit by Region chart.
Test the Interaction:
- Select one regional bar and check whether the product table responds correctly
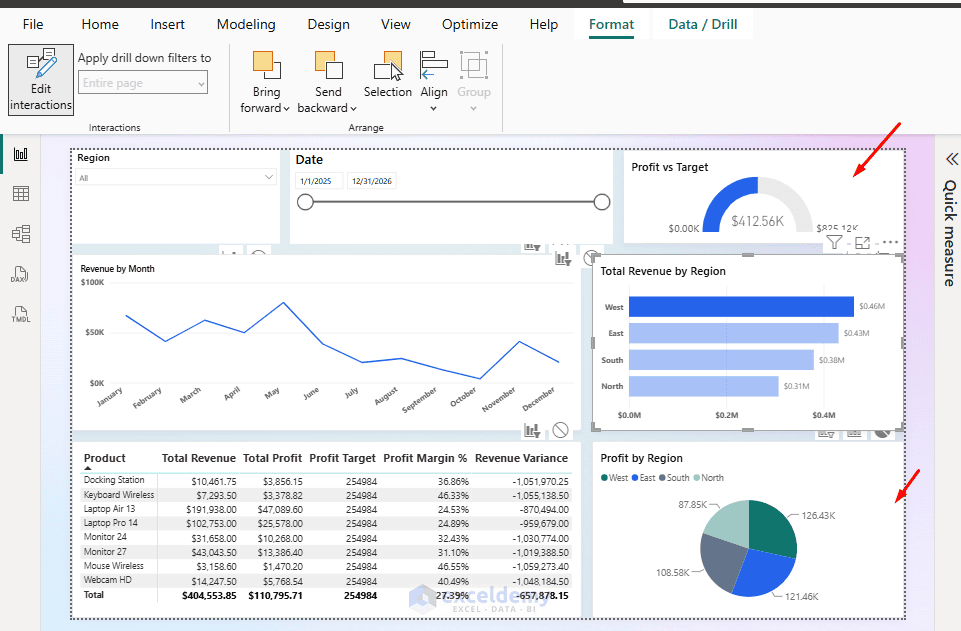
- Then clear the selection and confirm that the table returns to its previous state
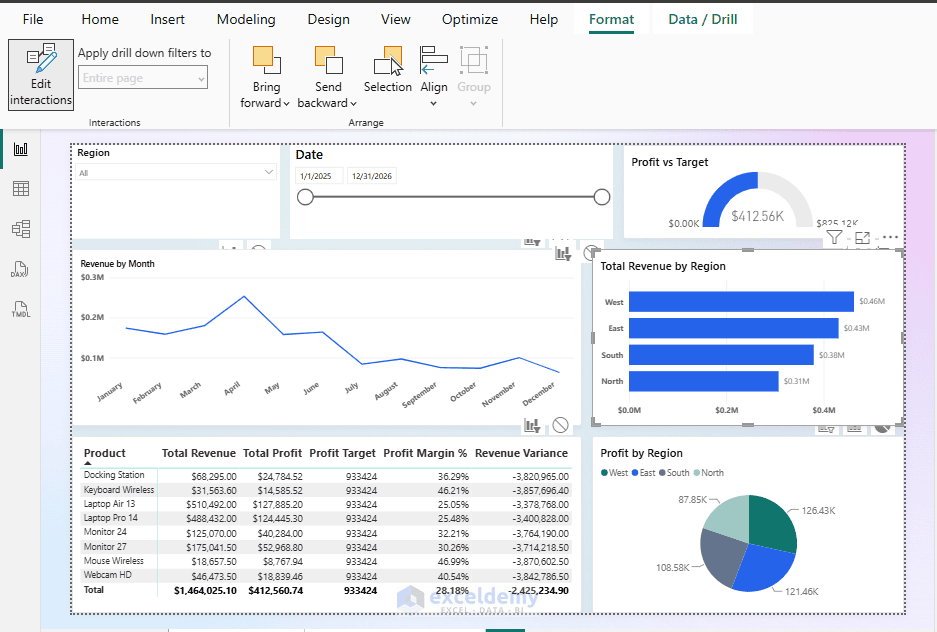
Design tip: Test important interactions before publishing. A chart should change another visual only when that interaction helps readers answer a question.
Rule 7: Test and Optimize the Report for Mobile Devices
A report that looks organized on a desktop may be difficult to use on a smaller screen. Power BI provides a mobile layout view so we can arrange visuals specifically for phone screens without changing the desktop layout.
Before: No optimized mobile layout
Our original report was designed for a wide desktop screen. It contains several KPI cards, charts, slicers, and a detailed table. Without a carefully planned mobile layout, users may need to zoom or navigate around the report to see the information.
After: Build a vertical mobile layout
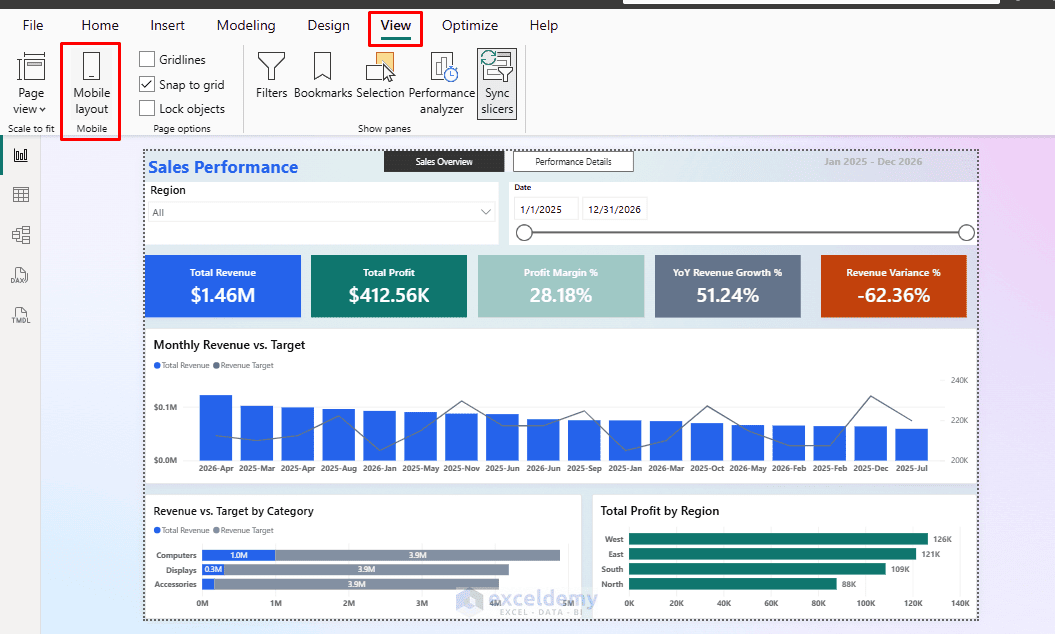
We will create a simpler version of the Sales Overview page for mobile users. The layout will contain the report title, important KPI cards, the Monthly Revenue vs. Target chart, and Revenue by Category.
- Open the Sales Overview page
- Go to the View tab >> select Mobile layout, or use the phone layout icon at the bottom of Power BI Desktop
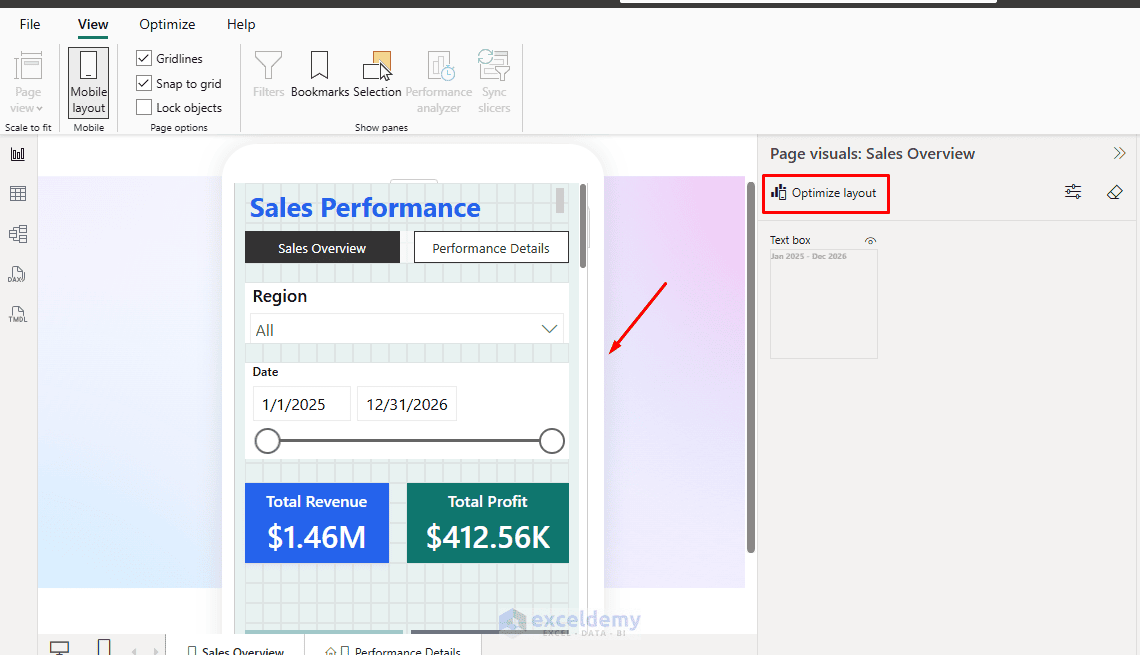
- Select Optimize layout to generate an initial mobile layout
- Review how the existing visuals are arranged
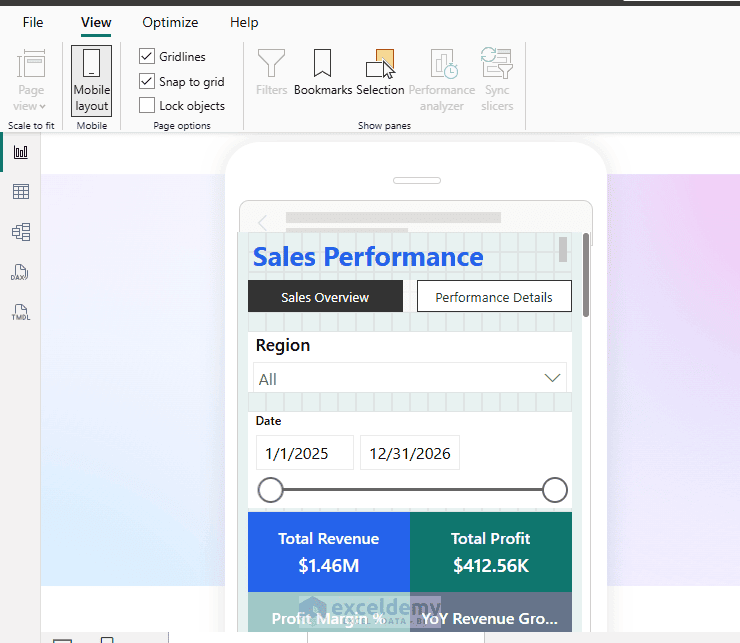
- Move the KPI cards toward the top of the mobile canvas
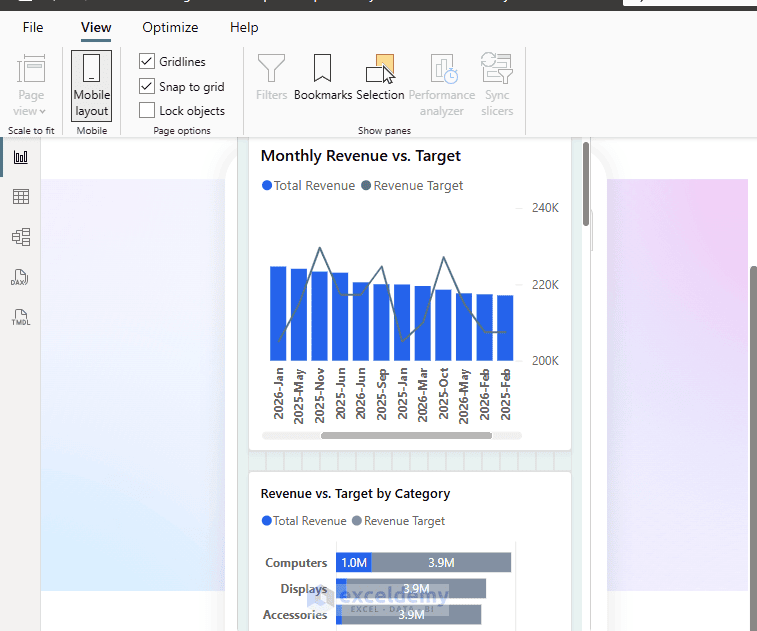
- Place Monthly Revenue vs. Target below the KPIs
- Position Revenue by Category below the monthly chart
- Leave unnecessary visuals out of the mobile arrangement
- Adjust font sizes and chart dimensions so the labels remain readable
- Check the result in the mobile layout preview and, when possible, the Power BI mobile app
The mobile layout supports automatic creation and manual arrangement of visuals. The automatically created version is a starting point, so you should review and adjust it before publishing.
Design tip: Do not try to display every desktop visual on a phone. Prioritize the information that users are most likely to check on mobile.
Final Result: A Report That Is Easier to Read
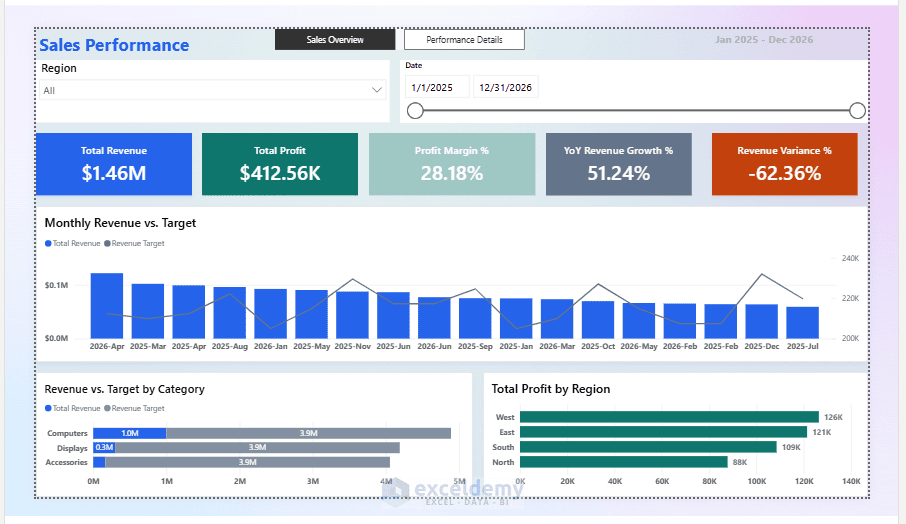
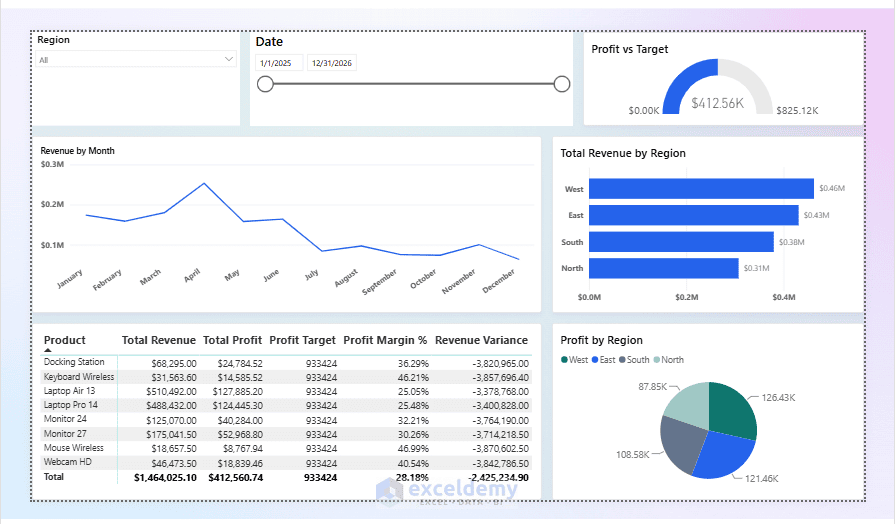
After applying all seven rules, our Sales Performance Report has changed from a crowded collection of charts into a focused report.
The Sales Overview page now follows a clear reading order: report title, useful filters, important KPI cards, monthly sales trend, and category comparison.
The Performance Details page provides a separate space for investigating regional differences. Colors and labels remain consistent, while interactions help readers explore the data without losing important context.
Before publishing, review the report using this checklist:
- Each page answers one main question
- Important KPIs are immediately visible
- Colors have consistent meanings
- Only necessary slicers appear on the page
- Titles, values, and labels are readable
- Visual interactions behave as expected
- Both desktop and mobile layouts have been tested
Conclusion
These are the 7 Power BI design rules for reports people actually read. An effective Power BI report does not need dozens of visuals or complicated design elements. It needs a clear purpose, important information in the right places, and a layout that helps readers understand the data. The seven rules in this tutorial provide a practical checklist for improving almost any report. They work whether you are building a sales dashboard, financial report, HR dashboard, or operational performance report. The goal is not to make people spend more time looking at a report. It is to help them find the answers they need in less time.
Get FREE Advanced Excel Exercises with Solutions!