Excel for Statistics

How to Perform Regression Analysis in Excel? (3 Methods)

Excel is a popular tool for doing regression analysis because it has a user-friendly interface and a variety of features. Here's the dataset we'll ...

Anova in Excel (One and Two-Way)

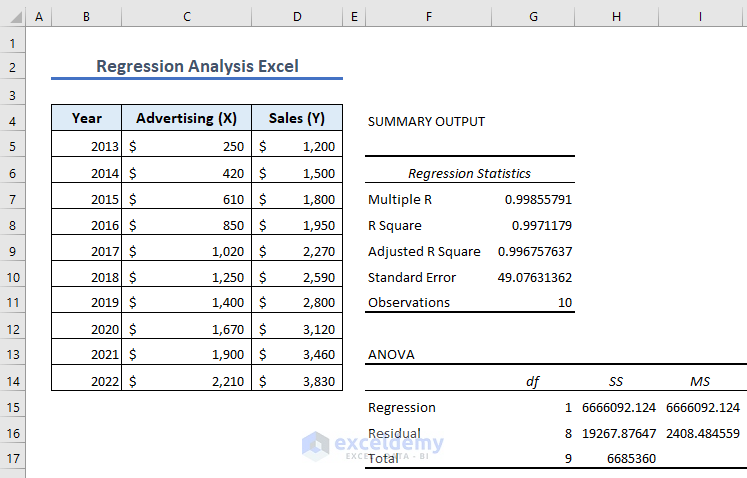
In this Excel tutorial, we provide a comprehensive look at ANOVA in Excel. We will demonstrate how to enable the Data Analysis feature and use it to ...

How to Calculate Median in Excel

How to Calculate Median in Excel: Knowledge Hub How to calculate the median age of the population in Excel << Go Back to Excel ...

Excel Demographic Data

Excel Demographic Data: Knowledge Hub How to calculate the population mean in Excel How to calculate population growth rate in Excel How ...

Excel Interpolation (Linear & Non-linear Interpolation)

This is an overview. Click the image for a detailed view Download Practice Workbook Excel Interpolation.xlsx What Is ...

Confidence Interval in Excel: Upper & Lower Limit

Method 1 - CONFIDENCE Function It returns the confidence value for the population mean using the normal distribution. The syntax for this function ...

Outliers in Excel: A Complete Guide

In this article, we will show you different methods to calculate outliers in Excel. You will get to know about various statistical concepts and Excel ...

Standard Error Excel (Mean, Skewness & Regression)

In this article, We will learn to calculate various types of standard error in Excel. First, we will learn the Standard Error of Mean. The standard ...

How to Use Standard Deviation Formula in Excel?

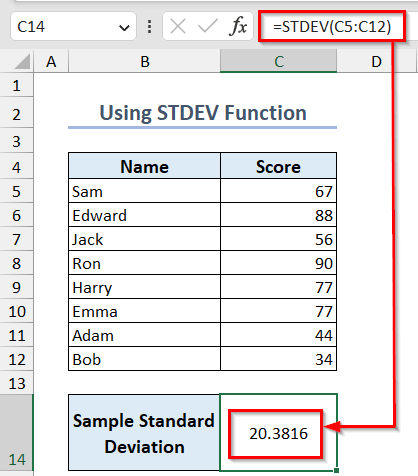
In this article, you’ll learn how to calculate standard deviation using formula in Excel. We'll calculate both the sample standard deviation and the ...

How to Find Deviation in Excel? (Sample & Population Standard Deviation)

In this Excel tutorial, you will find ways to calculate Standard Deviation using different arithmetic formulas in Excel. Here, we'll discuss how you ...

Excel Probability

In this article, we have used PROB, fractional method, NORM.DIST and NORMDIST function to find out Excel probability. Here's an overview of the ...

Bell Curve in Excel (Plot and Format)

The Bell curve provides a quick visualization of a dataset summary. We can get a dataset's mean, mode, and median using the Bell curve of a normal ...

Skewness and Kurtosis in Excel

Skewness and Kurtosis in Excel: Knowledge Hub How to calculate skewness in Excel Coefficient of skewness in Excel How to calculate ...

Normal Distribution in Excel

Normal Distribution in Excel: Knowledge Hub How to transform data to normal distribution in Excel << Go Back to Excel for ...

Frequency Distribution in Excel – 4 Methods

This is an overview. There is a list of 10 patients and their height in cm. A frequency distribution table was created by grouping the height ...

Close the CTA

Advanced Excel Exercises with Solutions PDF


ExcelDemy
Logo