Dataset Overview
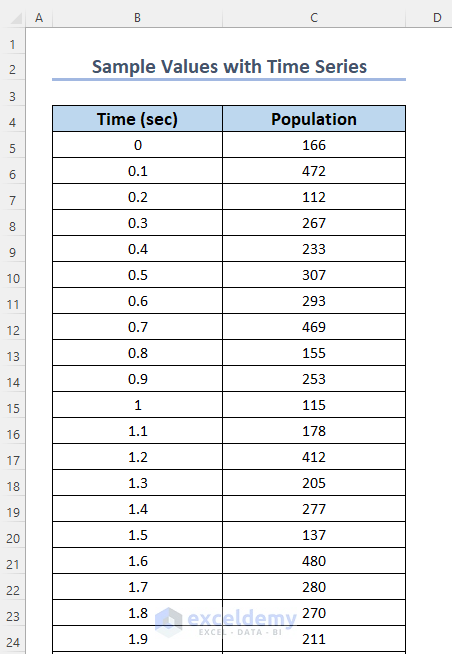
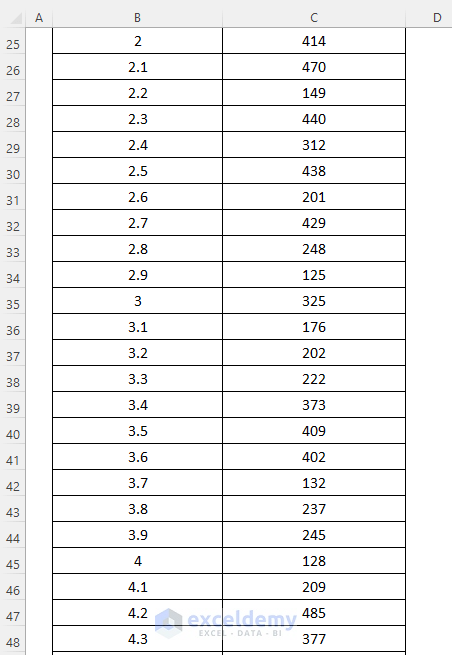
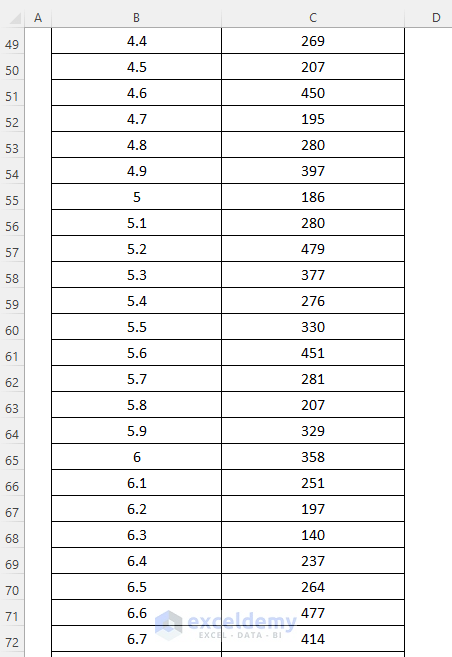
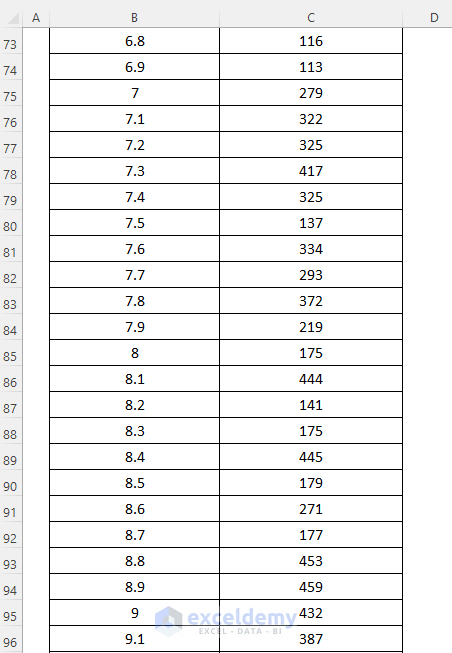
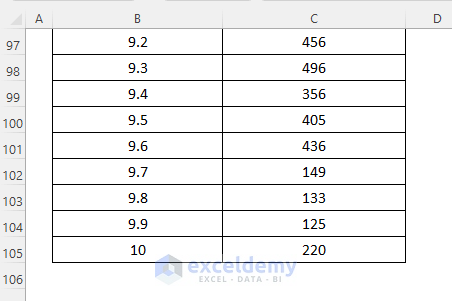
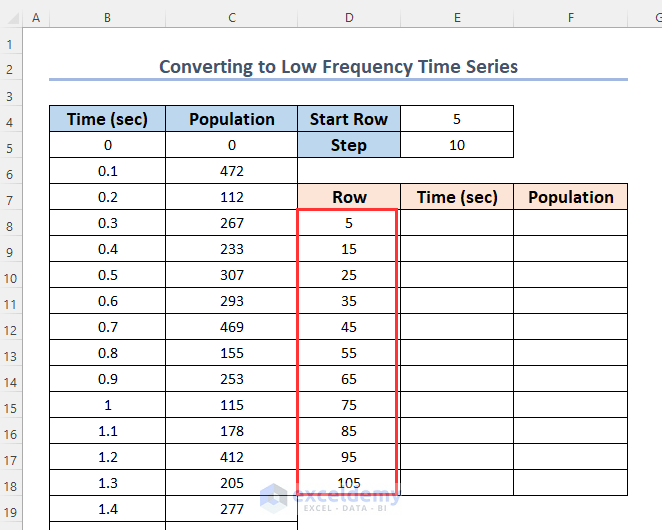
Here, we have the following time series and the gap between time is 0.1, starting from 0 to 10. With respect to these time periods, we have kept records of the population of a species. We will use this dataset for most of the cases in the following examples to resample this time series.
Example 1 – Resampling a High-Frequency Time Series to a Low-Frequency Time Series
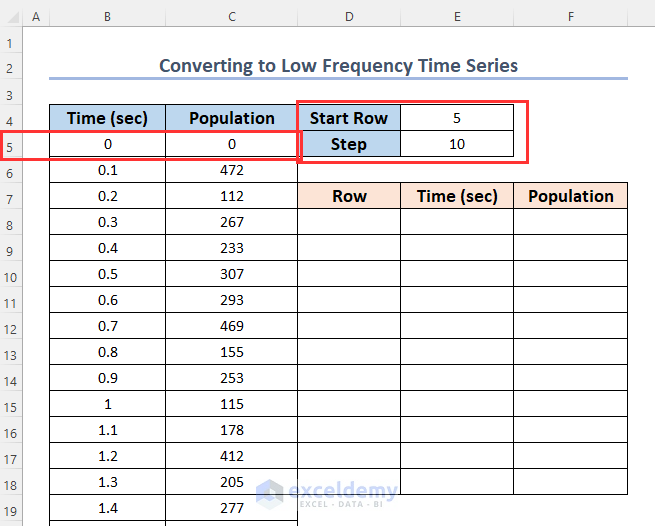
- You have a high-frequency time series dataset with a gap of 0.1 between each time period.
- To convert it to a low-frequency distribution, where the gap between each time period is 1, follow these steps:
- Consider the starting row number (which is 5 in your case).
- Calculate the next row number by adding the step value (10 in this case) to the previous row number.
Steps:
- Link up the value of cell D8 with the Start Row column.
=E4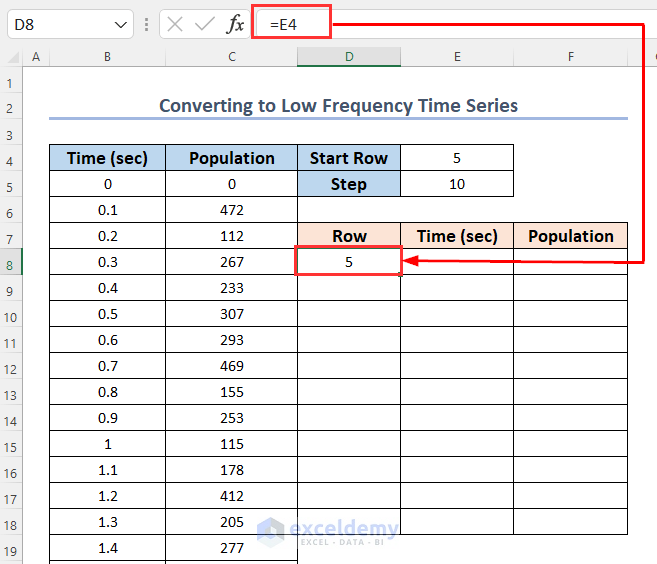
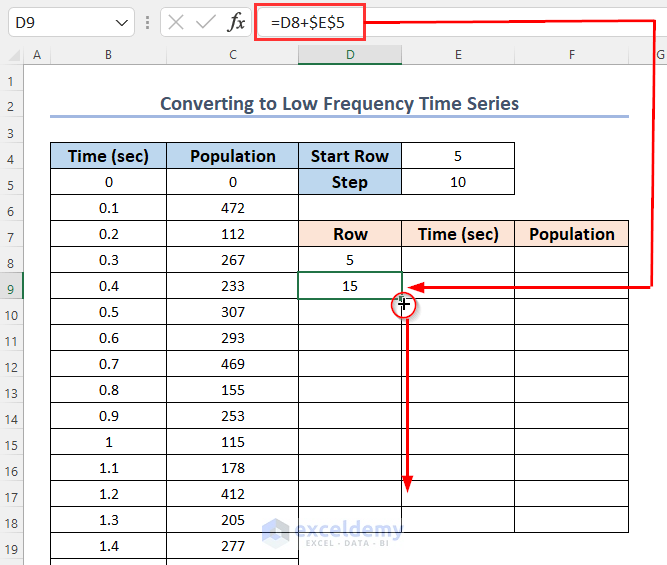
- For the second-row number (in cell D9) enter:
=D8+$E$5Here, D8 is the previous cell value, and $E$5 is the step value which will be added to the previous row number to give us the next row number.
- Press ENTER and drag down the Fill Handle tool.
You have gathered the row numbers from which we will extract the time series data and their corresponding population.
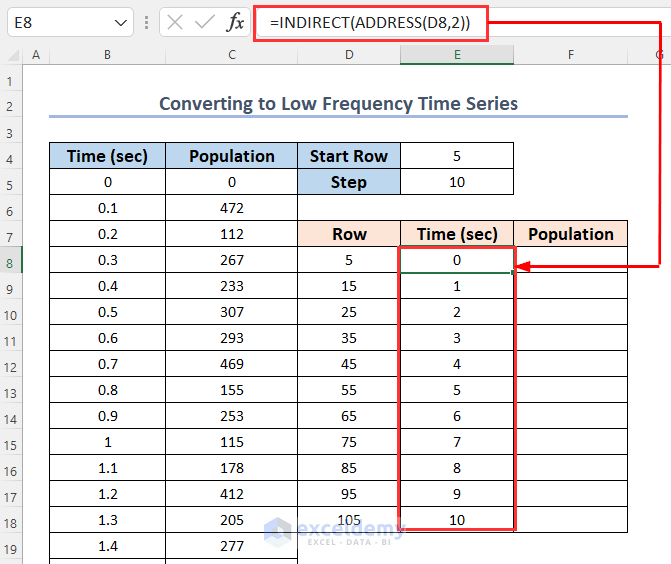
- For the time values (in cell E8) enter:
=INDIRECT(ADDRESS(D8,2))Formula Breakdown
- ADDRESS(D8,2) → becomes
- ADDRESS(5,2) → The ADDRESS function gives the address of a cell at the intersection point of Row 5 and Column 2.
- Output → “$B$5”
- ADDRESS(5,2) → The ADDRESS function gives the address of a cell at the intersection point of Row 5 and Column 2.
- INDIRECT(ADDRESS(D8,2)) → becomes
- INDIRECT(“$B$5”) → The INDIRECT function returns the value of cell “$B$5”
- Output → 0
- INDIRECT(“$B$5”) → The INDIRECT function returns the value of cell “$B$5”
- Press ENTER and use the AutoFill feature to copy the formula down to E18.
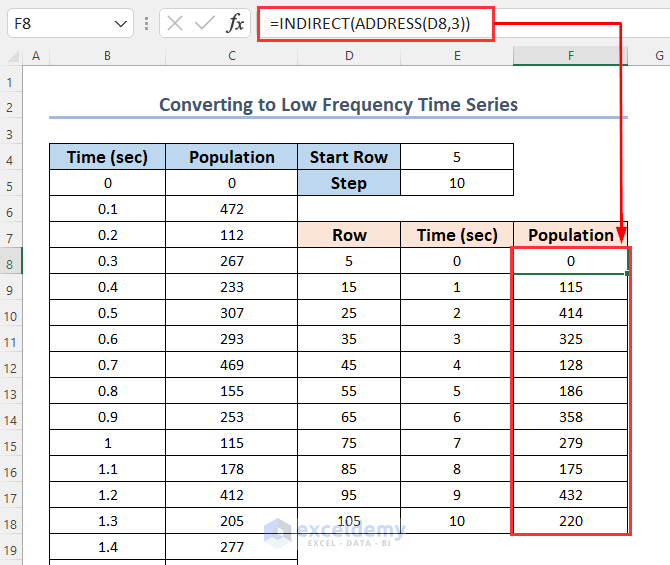
- For the population values (in cell F8) enter:
=INDIRECT(ADDRESS(D8,3))- Press ENTER and use the AutoFill feature to copy the formula down to F18.
Formula Breakdown
- ADDRESS(D8,3) → becomes
- ADDRESS(5,3) → gives the address of a cell at the intersection point of Row 5 and Column 3.
- Output → “$C$5”
- ADDRESS(5,3) → gives the address of a cell at the intersection point of Row 5 and Column 3.
- INDIRECT(ADDRESS(D8,3)) → becomes
- INDIRECT(“$C$5”) → returns the value of cell “$C$5”
- Output → 0
- INDIRECT(“$C$5”) → returns the value of cell “$C$5”
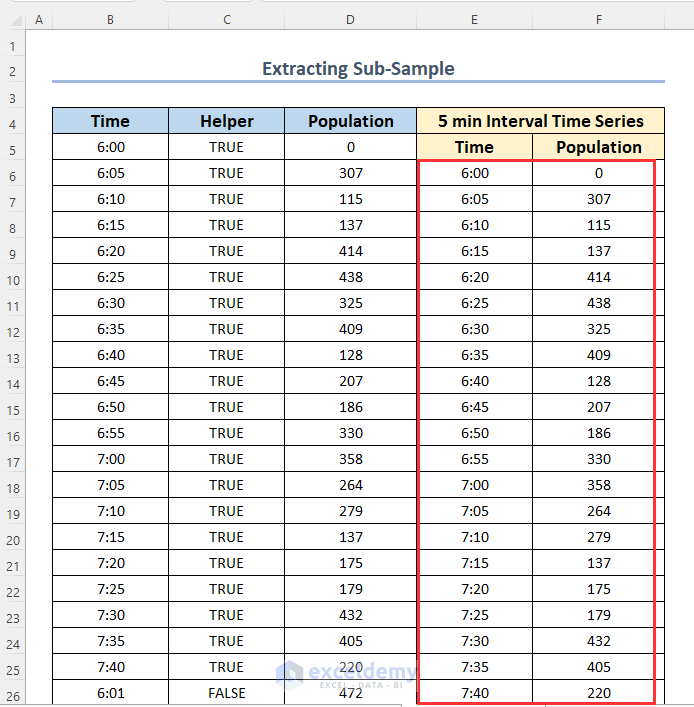
Example 2 – Extracting a Sub-Sample from Larger Data
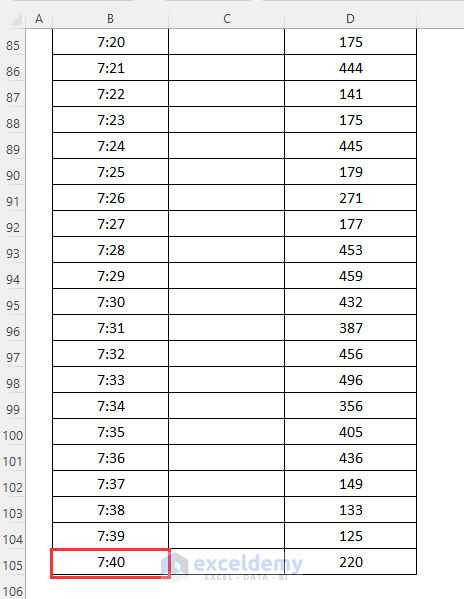
- You have a time series dataset with a starting time of 6:00 AM and a 1-minute time period increment.
- You want to extract a sub-sample with a time span of 5 minutes.
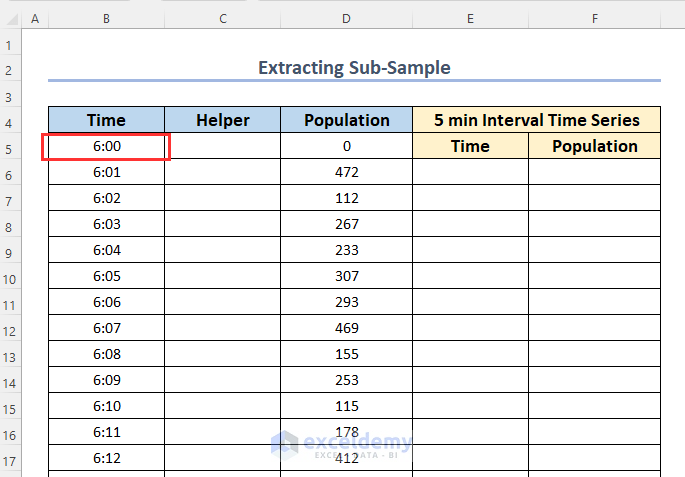
- Add a Helper column.
Steps:
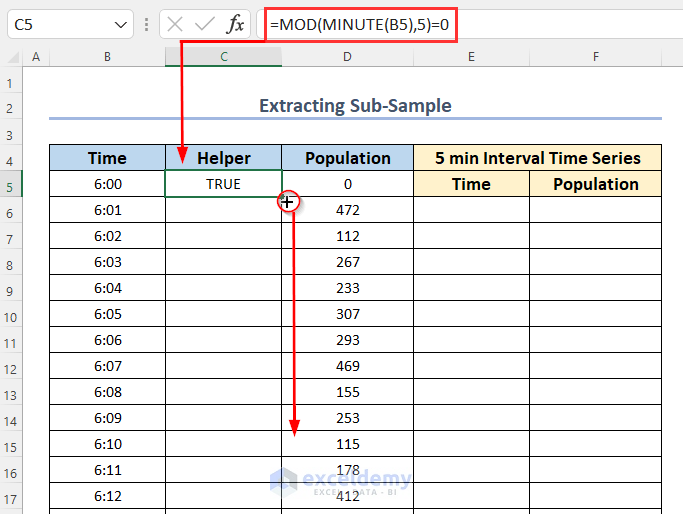
- Enter the following formula in cell C5:
=MOD(MINUTE(B5),5)=0Formula Breakdown
- MINUTE(B5) → becomes
- MINUTE(6:00) → The MINUTE function returns the minute value
- Output → 0
- MINUTE(6:00) → The MINUTE function returns the minute value
- MOD(MINUTE(B5),5) → becomes
- MOD(0,5) → The MOD function gives the remainder value after dividing 0 by 5
- Output → 0
- MOD(0,5) → The MOD function gives the remainder value after dividing 0 by 5
- MOD(MINUTE(B5),5)=0 → becomes
- 0=0 → returns TRUE when the remainder value is 0 otherwise FALSE
- Output → TRUE
- 0=0 → returns TRUE when the remainder value is 0 otherwise FALSE
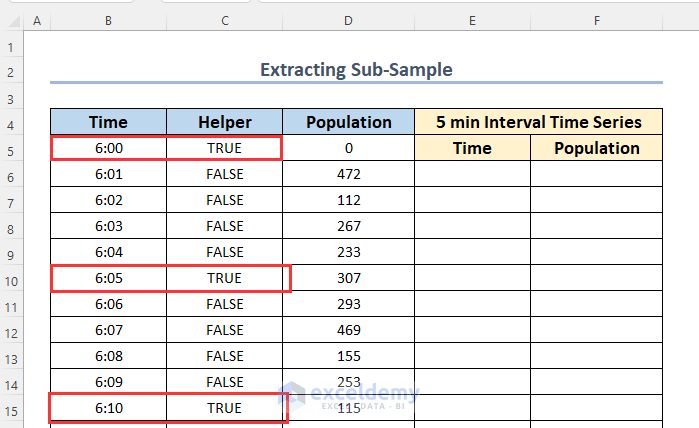
- Press ENTER and drag down the Fill Handle tool.
This formula returns TRUE for time periods every 5 minutes.
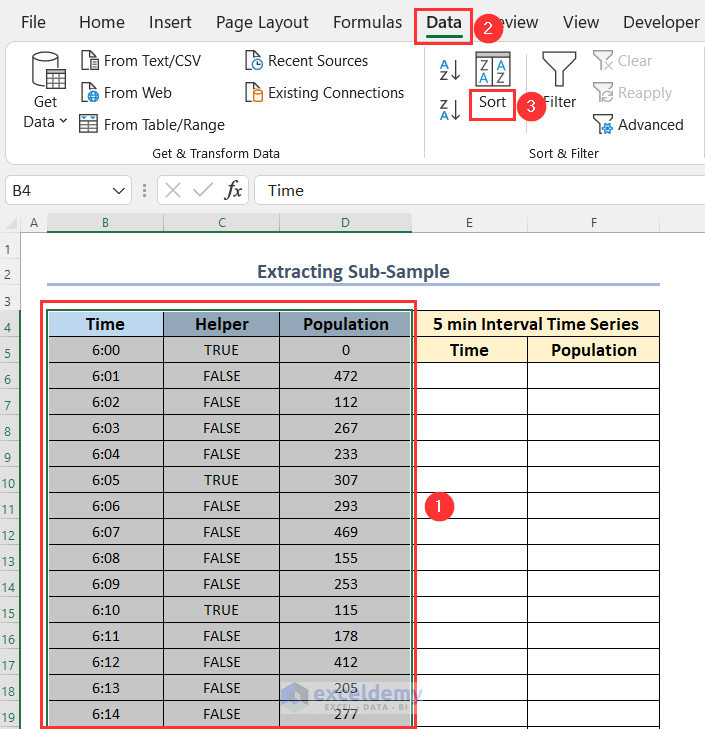
- Sort the data based on the Helper column:
- To gather the time periods having a TRUE value.
- Select the dataset and then go to the Data tab, click on Sort & Filter group, and select Sort.
- To gather the time periods having a TRUE value.
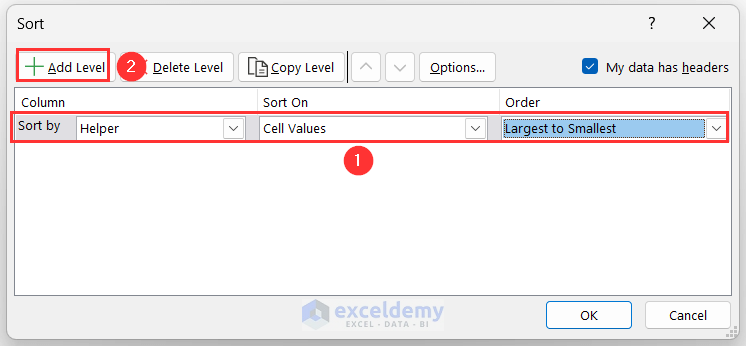
- The Sort dialog box will appear.
- Select the following options.
- Sort by → Helper
- Sort On → Cell Values
- Order → Largest to Smallest
- Click on Add Level option to add additional criteria for sorting.
- Select the following options.
-
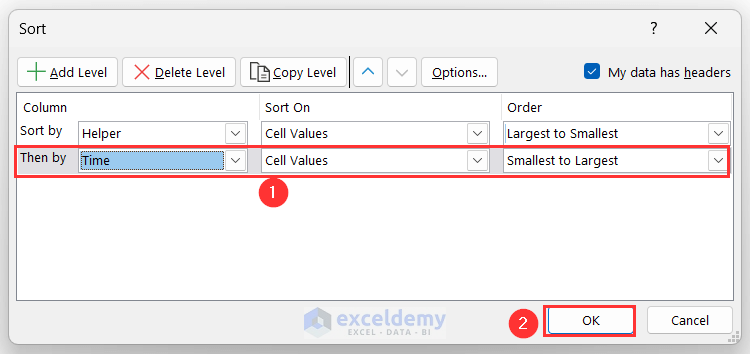
- Choose the following options.
- Then by → Time
- Sort On → Cell Values
- Order → Smallest to Largest
- Press OK.
- Choose the following options.
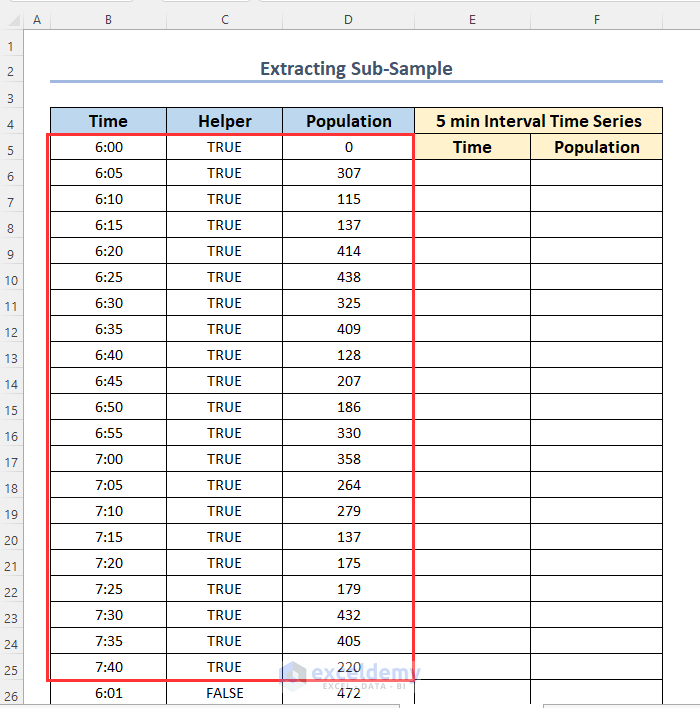
You have gathered all of the time periods with a gap of 5 minutes between each other.
- Select the values corresponding to TRUE in the Helper column (press CTRL while selecting non-adjacent columns) and copy them.
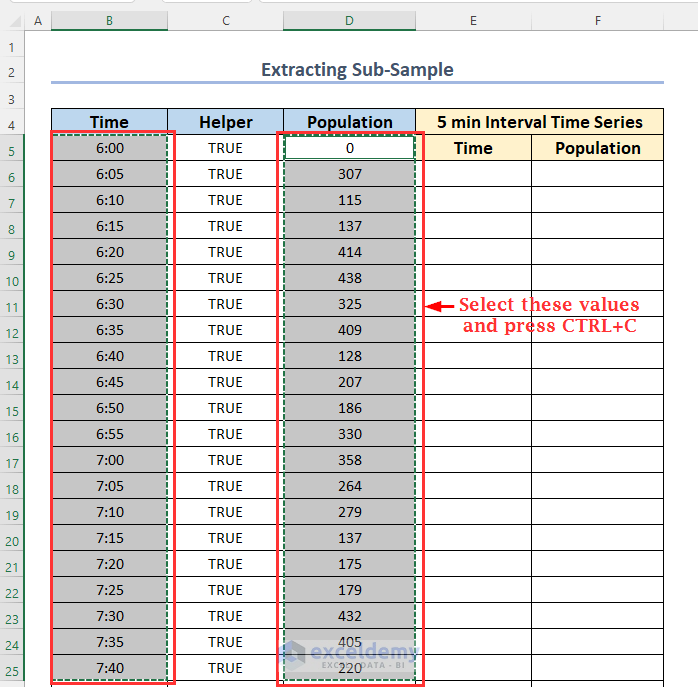
- You can now resample this sub-sample.
Read More: How to Perform Bootstrapping in Excel
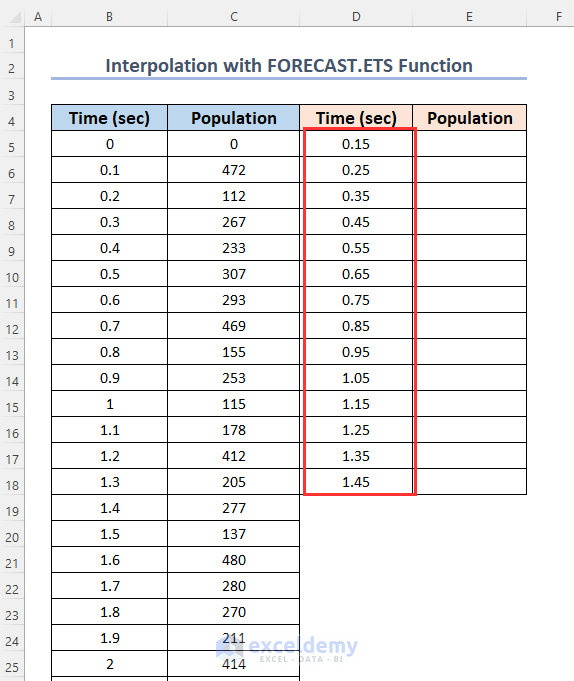
Example 3 – Resampling Time Series after Interpolation
In this scenario, we have a time series dataset with population values recorded at intervals from 0 seconds to 10 seconds, with a step of 0.1 seconds between each time period. Our goal is to resample this data and fill in missing values using interpolation. We’ll achieve this by leveraging the FORECAST.ETS function.
Steps:
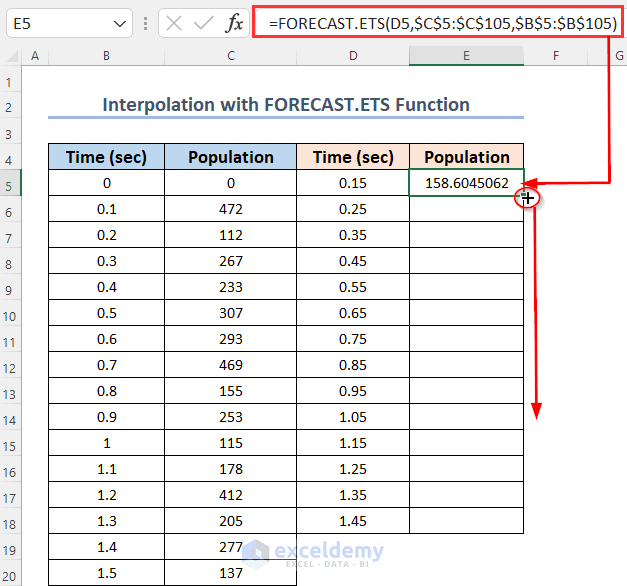
- For each desired time value (e.g., D5), enter the following formula in cell E5:
=FORECAST.ETS(D5,$C$5:$C$105,$B$5:$B$105)-
- Here:
- D5 represents the specific time value for which we want to calculate the population.
- $C$5:$C$105 is the range of known population values.
- $B$5:$B$105 corresponds to the time series sample.
- Here:
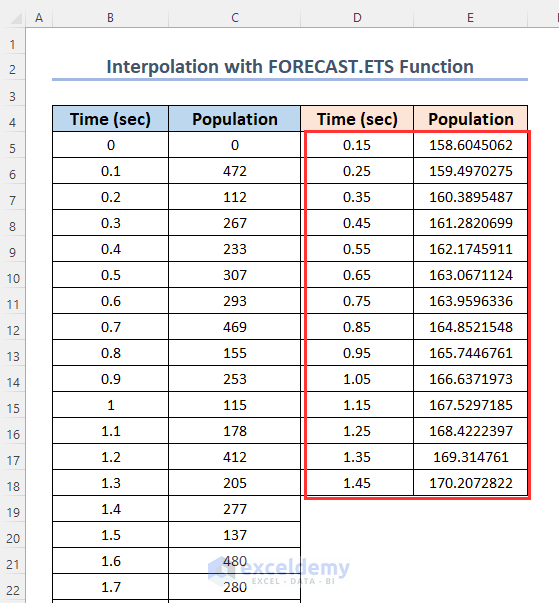
- Press ENTER and drag down the Fill Handle tool.
This completes the interpolation process, resulting in a new resampled time series dataset.
Read More: How to Calculate Bootstrapping Spot Rates in Excel
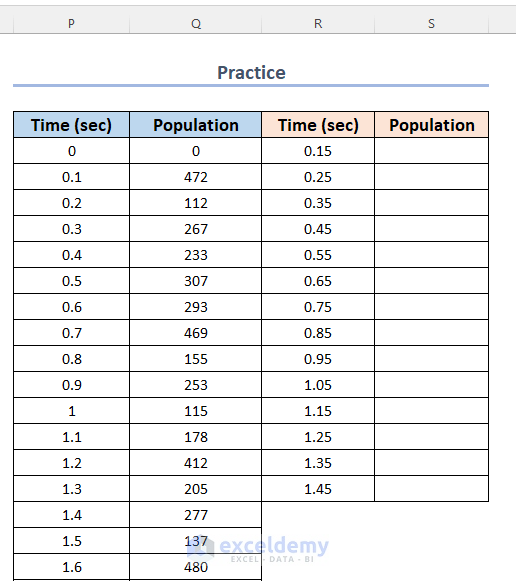
Practice Section
To practice, we have created a Practice section on the right side of each sheet.
Download Practice Workbook
You can download the practice workbook from here:
Related Articles
- Comparison Among MAX vs MAXA vs LARGE and MIN vs MINA vs SMALL Functions in Excel
- How to Calculate Margin of Error in Excel
- How to Find Mean, Median, and Mode on Excel
<< Go Back to Excel for Statistics | Learn Excel
Get FREE Advanced Excel Exercises with Solutions!
