What Is the FORECAST Function in Excel?
- Description
The FORECAST function is a Statistical function in Excel. It calculates or predicts a future value based on existing value. The existing values are known as x-values and y-values and the future value is predicted by using linear regression. For instance, you can predict future numeric values of sales, earnings and expenses, inventory, consumer trends, measurements, etc.
- Purpose
To predict or calculate a future value with a linear trend
- Syntax
=FORECAST(x, known_ys, known_xs)
- Arguments Description
| Value | Required/Optional | Description |
|---|---|---|
| x | Required | The value for which the future value to predict or calculate |
| known_ys | Required | The dependent array or range of data (y values) |
| known_xs | Required | The independent array or range of data (x values) |
- Return Value
A predicted or calculated value
FORECAST Functions in Excel: 5 Examples
Example 1 – FORECAST.LINEAR Function in Excel
FORECAST.LINEAR is formerly known as the FORECAST function in Excel. Microsoft replaced the FORECAST function with the FORECAST.LINEAR in 2016.
- Purpose
This function predicts the future value based on the existing set of values.
- Equation
y = a + bx
a = constant value, intercept, which follows,

And b = coefficient, the slope of the line, which follows,
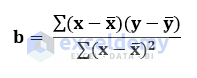
Here,
![]()
means the Average value (arithmetic mean) of the sample value.
- Return Value
A calculated future value
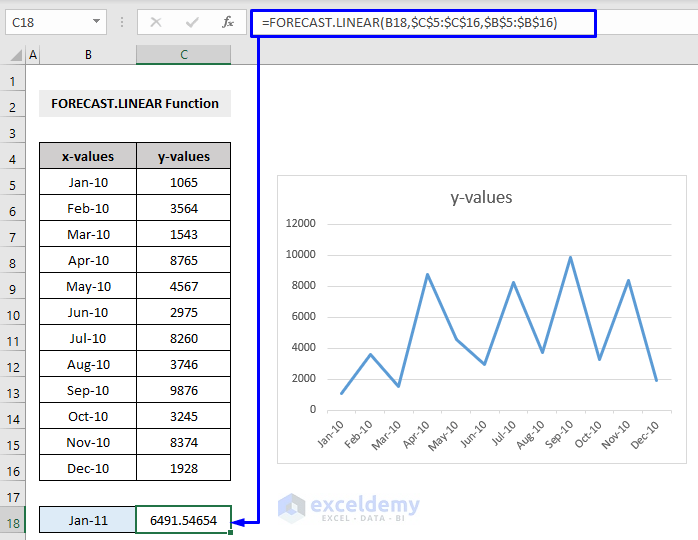
Based on the above discussion, the FORECAST.LINEAR formula for our given dataset will be,
=FORECAST.LINEAR(B18,$C$5:$C$16,$B$5:$B$16)Where,
B18 = The value for which the future value to predict or calculate
$C$5:$C$16 = The dependent array or range of data (y values)
$B$5:$B$16 = The independent array or range of data (x values)
Example 2 – FORECAST.ETS in Excel
The FORECAST.ETS function is used to calculate or predict future value based on existing values by using the AAA version of the Exponential Smoothing (ETS) algorithm.
AAA = Additive Error, Additive Trend, and Additive Seasonality.
ETS = Exponential Triple Smoothing algorithm.
This algorithm loosens up the insignificant deviations in data trends by detecting seasonality patterns and confidence intervals.
- Syntax
=FORECAST.ETS (target_date, values, timeline, [seasonality], [data_completion], [aggregation])
- Argument Description
| Value | Required/Optional | Description |
|---|---|---|
| target_date | Required | The timeline for the prediction should be calculated |
| values | Required | Existing or historical value(y-values), dependent array, or range of data from which a prediction will be calculated. |
| timeline | Required | Numeric independent array or range of values (x-values) |
| [seasonality] | Optional |
Seasonality calculation.
|
| [data_completion] | Optional |
Missing data calculation.
|
| [aggregation] | Optional | Indicates which method to use. Default value is 0 = Average |
- Return Value
A calculation of the predicted value.
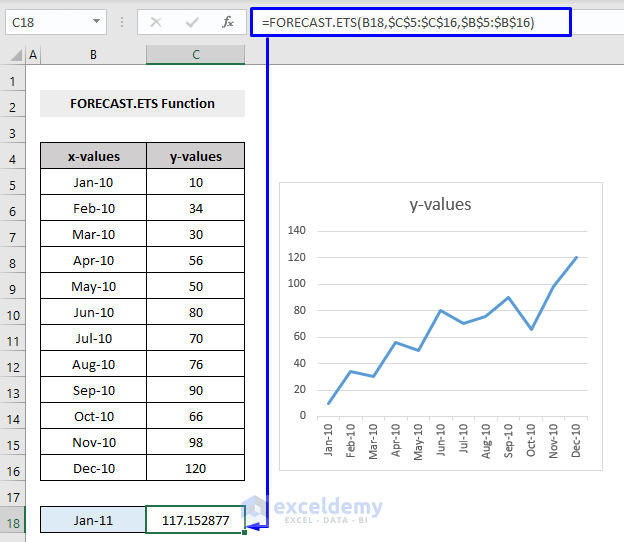
The FORECAST.ETS formula for our given dataset shown above will be,
=FORECAST.LINEAR(B18,$C$5:$C$16,$B$5:$B$16)B18 = The value for which the future value to predict or calculate
$C$5:$C$16 = The dependent array or range of data (y values)
$B$5:$B$16 = The independent array or range of data (x values)
Read More: TREND vs FORECAST Function in Excel
Example 3 – The FORECAST.ETS.CONFINT
The FORECAST.ETS.CONFINT function returns a confidence interval (CI) for a forecast value at a specified timeline. A confidence level of 90% means the predicted values are expected to fall within this radius from the result of the FORECAST.ETS function produced.
- Syntax
=FORECAST.ETS.CONFINT (target_date, values, timeline, [confidence_level], [seasonality], [data_completion], [aggregation])
- Argument Description
| Value | Required/Optional | Description |
|---|---|---|
| target_date | Required | The timeline for the prediction should be calculated |
| values | Required | Existing or historical value(y-values), dependent array, or range of data from which a prediction will be calculated. |
| timeline | Required | Numeric independent array or range of values (x-values) |
| [confidence_level] | Optional | The confidence level for the calculated confidence interval. A numeric value between 0 and 1 (exclusive). Default 0.95 or 95% |
| [seasonality] | Optional | Seasonality calculation.
|
| [data_completion] | Optional | Missing data calculation.
|
| [aggregation] | Optional | Indicates which method to use. Default value is 0 = Average |
- Return Value
Confidence Interval (CI) value
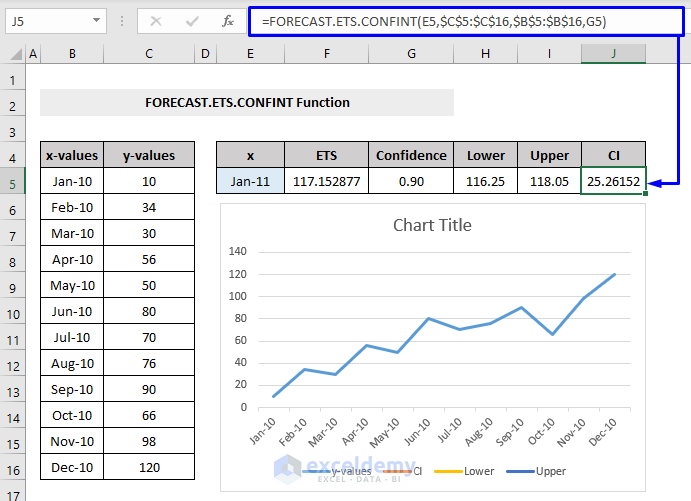
The FORECAST.ETS.CONFINT formula for our given dataset will be:
=FORECAST.ETS.CONFINT(E5,$C$5:$C$16,$B$5:$B$16,G5)E5 = The value for which the future value to predict or calculate
$C$5:$C$16 = The dependent array or range of data (y values)
$B$5:$B$16 = The independent array or range of data (x values)
G5 = Confidence level
Example 4 – FORECAST.ETS.SEASONALITY
The FORECAST.ETS.SEASONALITY function is used to return the length of a repetitive pattern in a specified timeline.
- Syntax
=FORECAST.ETS.SEASONALITY (values, timeline, [data_completion], [aggregation])
- Argument Description
| Value | Required/Optional | Description |
|---|---|---|
| values | Required | Existing or historical value(y-values), dependent array, or range of data from which a prediction will be calculated. |
| timeline | Required | Numeric independent array or range of values (x-values) |
| [data_completion] | Optional | Missing data calculation.
|
| [aggregation] | Optional | Indicates which method to use. Default value is 0 = Average |
- Return Value
Season length in a specified timeline
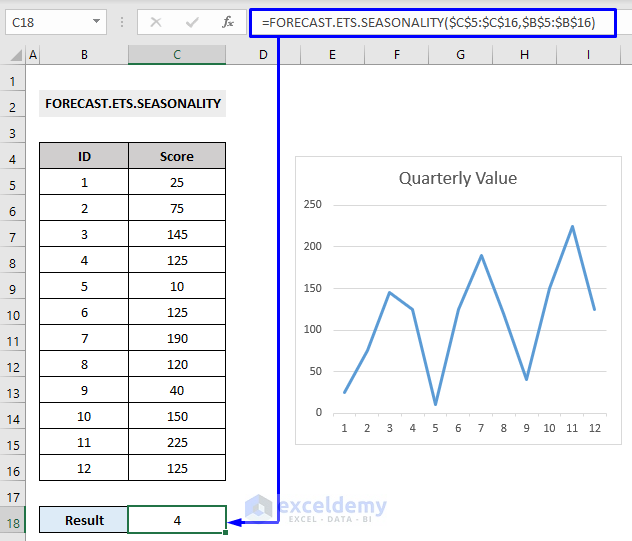
The FORECAST.ETS.SEASONALITY formula for our given dataset shown above will be,
=FORECAST.ETS.SEASONALITY($C$5:$C$16,$B$5:$B$16)$C$5:$C$16 = The dependent array or range of data (Score column as y values)
$B$5:$B$16 = The independent array or range of data (ID column as x values)
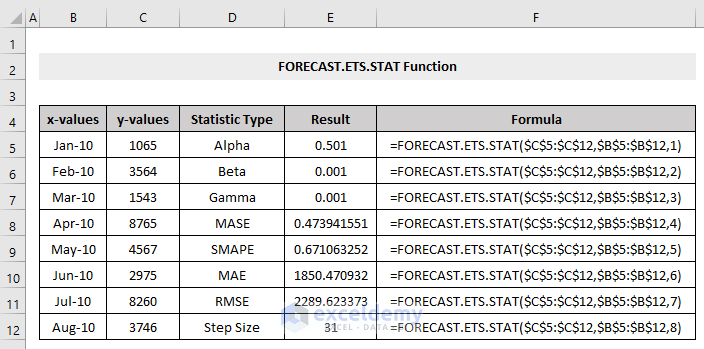
Example 5 – FORECAST.ETS.STAT in Excel
The FORECAST.ETS.STAT function returns a statistical value relating to the time series forecasting with the FORECAST.ETS function.
Syntax
=FORECAST.ETS.STAT (values, timeline, statistic_type, [seasonality], [data_completion], [aggregation])
- Argument Description
| Value | Required/Optional | Description |
|---|---|---|
| values | Required | Existing or historical value(y-values), dependent array, or range of data from which a prediction will be calculated. |
| timeline | Required | Numeric independent array or range of values (x-values) |
| statistic_type | Required | The type of statistical value to return.
|
| [seasonality] | Optional | Seasonality calculation.
|
| [data_completion] | Optional | Missing data calculation.
|
| [aggregation] | Optional | Indicates which method to use. Default value is 0 = Average |
- Return Value
A statistical result
The formula for the FORECAST.ETS.STAT function with different statistic types is shown in the picture below,
=FORECAST.ETS.SEASONALITY($C$5:$C$16,$B$5:$B$16,1)$C$5:$C$16 = The dependent array or range of data (Score column as y values)
$B$5:$B$16 = The independent array or range of data (ID column as x values)
1 = Alpha statistic type (this numeric argument can be anything from 1 to 8 based on the requirement)
Download the Workbook
Excel FORECAST Function: Knowledge Hub
- How to Use FORECAST Function with Multiple Variables in Excel
- How to Use VBA Forecast Function in Excel
<< Go Back to Excel Functions | Learn Excel
Get FREE Advanced Excel Exercises with Solutions!
