Today, we are going to discuss the TREND Function vs the FORECAST Function in Excel. We often need to predict the current and future patterns of a dataset. The TREND function and the FORECAST function allow users to anticipate the outcome of a future time period based on the present dataset and their patterns. Here, we will show the differences in the sections below with proper examples.
Introduction to TREND Function
- Objective
In summary, the TREND Function uses the Least Square Regression method to predict a linear trend along a straight line. However, we can apply exponential, polynomial, or logarithmic trendlines in charts.
- Syntax
=TREND(known_y's,[known_x's],[new_x's],[const])
- Arguments
| ARGUMENT | REQUIRED/OPTIONAL | EXPLANATION |
| known_y’s | Required | It refers to the known y values in the equation y=mx+c |
| known_x’s | Optional | These are the known x values that maybe known to the user. |
| new_x’s | Optional | These are the new x values which corresponding y values will be evaluated in the TREND function. |
| const | Optional | This is the constant value b from the y=mx+b equation. |
- Return Parameter
As a return value, the TREND function returns the values that match the current trend from a dataset or predicts the future value of a parameter based on the current trend.
Introduction to FORECAST Function
- Summary
As a whole, the FORECAST Function predicts the future value of a parameter on the basis of the existing values of that parameter.
- Syntax
FORECAST(x, known_y's, known_x's)
- Arguments
| ARGUMENT | REQUIRED/OPTIONAL | EXPLANATION |
| x | Required | This is the x value for which we will predict a y value. |
| known_y’s | Required | These are the y values based on which we will anticipate the pattern of the changing y values and predict the new y value. |
| known_x’s | Required | These are the independent values against which the known y values have changed. |
- Return Parameter
So, this function will return the future value of a particular x parameter by judging the relationship of the existing x and y values.
Differences Between Excel TREND and FORECAST Functions
In this section, we will show the basic differences between the TREND and the FORECAST function in a tabular form. Moreover, we will expand these comparisons with examples in the later sections.
| TREND Function | FORECAST Function |
| Firstly, the TREND function predicts the current trend as well as the future trend from a set of data. | On the other hand, the FORECAST function only evaluates the future value of a parameter based on the current dataset. |
| Secondly, this function can predict the future value of a multiple y values from multiple x values. | With contrary to that, it can predict the future value of a single y value from a single x value. |
| Finally, we can use this function as an Array Formula. | In opposition to that, the FORECAST function is only used as a regular formula. |
TREND vs FORECAST Function in Excel: 3 Suitable Examples
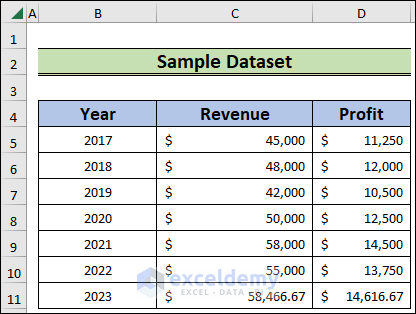
In this article, we will use 3 handy examples to analyze the TREND function vs the FORECAST function in Excel. Here, we have the revenue and profit data of a company sorted by year. Firstly, we will use the dataset to predict the current and future trends and values using the TREND and FORECAST functions. Along with that, we will compare the two functions.
1. TREND Function with Single X Value
In this instance, we will use the TREND function based on a single x value. We will predict both the present and future values of the dataset.
1.1 Predicting Present Trend
Here, we will use the present trend of the dataset. We will use a single x value to outline the trend.
Steps:
- To begin with, click on the D5 cell and enter,
=TREND(C5:C10,B5:B10)- Then, press Enter.
- As a result, we will have the present trend of the Revenue.

Thus, we will get the present trend values by using a single x parameter.
1.2 Predicting Future Trend
In this case, we will predict the future trend of a certain parameter based on a single x value.
Steps:
- At the beginning, choose the D11 cell and type,
=TREND(C5:C10,B5:B10,B11:B13)- After that, press Enter.
- Consequently, we will get the future trend of the Revenue.

So, this is how we will have the future trend values by inserting only one x parameter.
2. TREND Function with Multiple X Values
In this example, we will apply multiple x parameters to predict the present and future trends of a dataset.
2.1 Predicting Present Trend
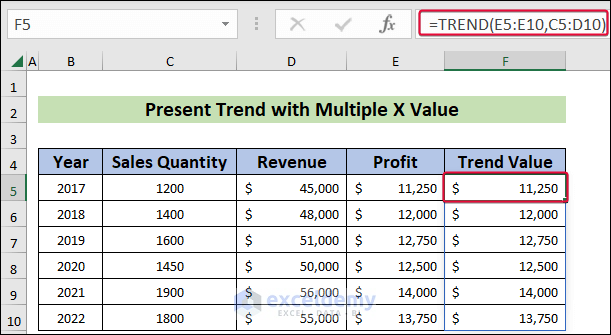
In this instance, we will take two x parameters namely: Sale Quantity and Revenue to predict the current trend of the Profit parameter.
Steps:
- Firstly, select the F5 cell and write the following,
=TREND(E5:E10,C5:D10)- Then, hit Enter.
- Consequently, we will get trend values for profit for multiple x parameters.
In this process, we will get the present trend of the dataset by using multiple x values.
Read More: How to Use FORECAST Function with Multiple Variables in Excel
2.2 Predicting Future Trend
In this illustration, we will anticipate the future trend of a Profit using two x parameters, Sales Quantity and Revenue. Here, we will predict the trend for the upcoming three years.
Steps:
- At the beginning, click on the F11 cell and enter the following,
=TREND(E5:E10,C5:D10,C11:D13)- Then, hit Enter.
- As a result, we will get the trend value of profit for the years 2023, 2024, and 2025.

Hence, we will get the future trends of the dataset by using multiple x parameters.
3. Using FORECAST Function to Predict Future Revenue
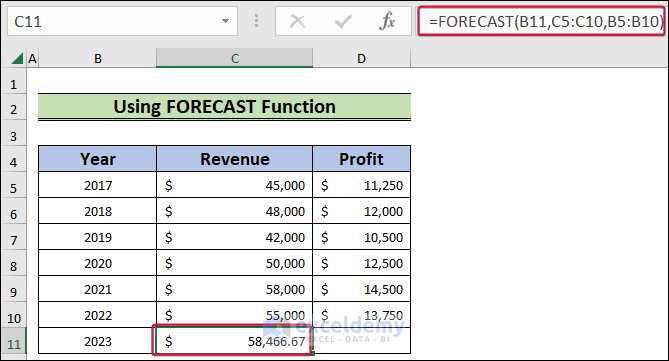
In this final example, we will explore the FORECAST function. We will forecast the revenue and profit for the year 2023 by applying the function.
Steps:
- At first, choose the C11 cell and type,
=FORECAST(B11,C5:C10,B5:B10)- Thereafter, press Enter.
- As a result, we will have the revenue prediction for the year 2023.
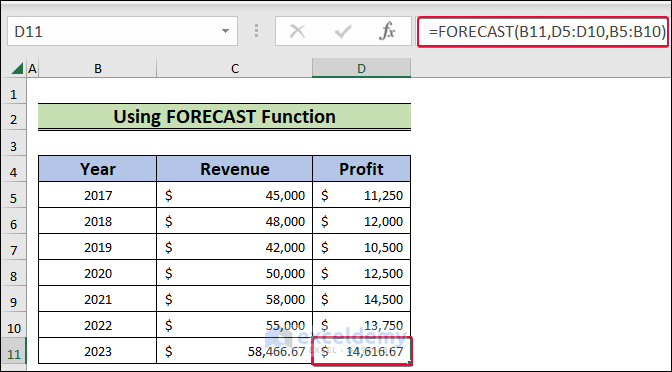
- After that, click on the D11 cell and insert the following,
=FORECAST(B11,D5:D10,B5:B10)- Then, press the Enter button.
- Consequently, we will have the forecast of the profit value for 2023.
Thus, we will have the future value of our dataset by using the FORECAST function in Excel.
Download Practice Workbook
Download the Excel workbook that we’ve used to prepare this article.
Conclusion
In this article, we talked about the TREND function vs the FORECAST function in Excel. This comparison will help users to understand the usage of the function properly and apply them accordingly. If you have any questions regarding this essay, feel free to let us know in the comments.
Related Articles
<< Go Back to Excel FORECAST Function | Excel Functions | Learn Excel
Get FREE Advanced Excel Exercises with Solutions!
