Method 1 – Utilizing AVERAGE Function to Find Mean in Excel
- Choose the C19 cell.
- Write down the following formula by selecting the range from C5 to C17 to calculate the mean.
=AVERAGE(C5:C17)- Click ENTER.
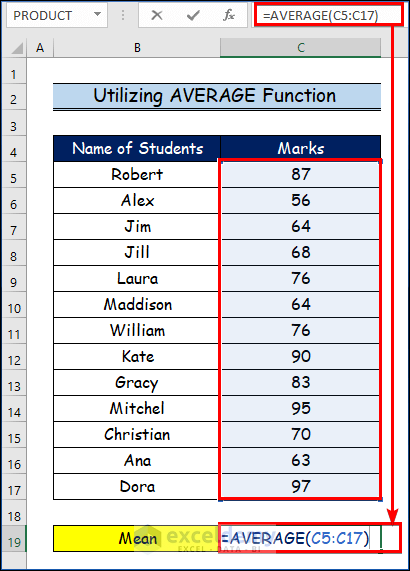
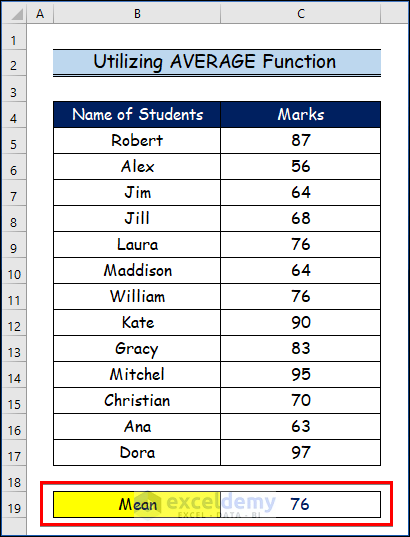
- The following result is for the mean value in the below image.
Method 2 – Using MEDIAN Function to Calculate Median in Excel
- Pick the C19 cell first.
- Use the range C5 to C17 to determine the median, and note down the formula below.
=MEDIAN(C5:C17)- Press ENTER.
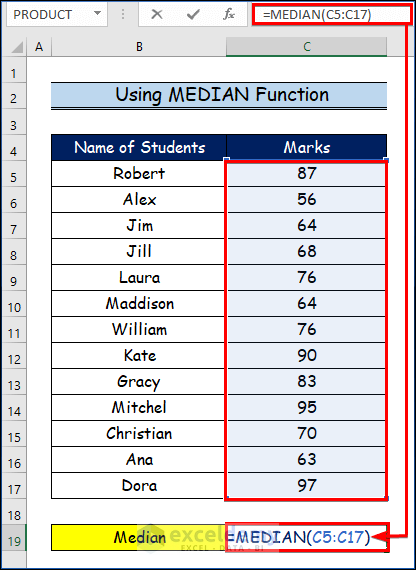
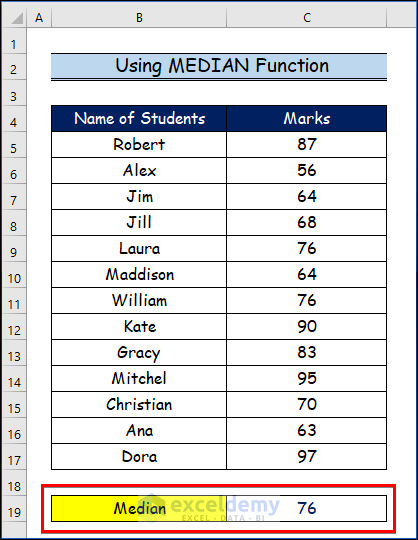
- Observe the final outcome of the median value here.
Method 3 – Applying MODE Function to Find Mode in Excel
3.1 Inserting MODE.SNGL Function
The MODE.SNGL function returns a single value, and this value is the most frequent value in the dataset.
- Select cell C19 first.
- Calculate the mode using the range C5 to C17 and write down the formula below.
=MODE.SNGL(C5:C17)- Click on the CTRL+ ENTER from the keyboard shortcut.
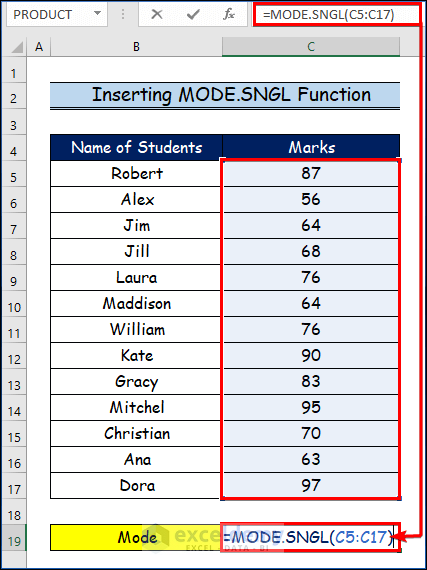
- The below image displays the value of mode in the C19 cell here.

3.2 Using MODE.MULT Function
- Select some cells to use the MODE.MULT function.
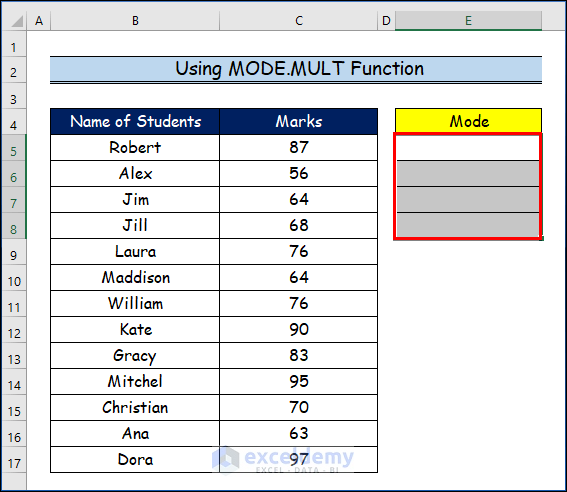
- Choose the C19 cell.
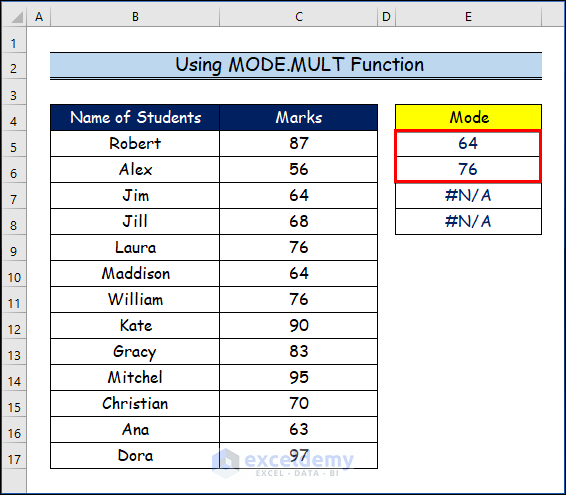
- Write down the following formula by choosing the range from C5 to C17 to evaluate the multiple modes of this range.
=MODE.MULT(C5:C17)- Press the CTRL+SHIFT+ENTER from the keyboard.

- There are two modes for this range from C5 to C17 cell.
Download Practice Workbook
You may download the following Excel workbook for a better understanding and to practice yourself.
Related Articles
- How to Perform Bootstrapping in Excel
- How to Resample Time Series in Excel
- How to Calculate Bootstrapping Spot Rates in Excel
- Comparison Among MAX vs MAXA vs LARGE and MIN vs MINA vs SMALL Functions in Excel
<< Go Back to Excel for Statistics | Learn Excel
Get FREE Advanced Excel Exercises with Solutions!

