Excel for Statistics

Statistical Significance in Excel

Statistical Significance in Excel: Knowledge Hub How to Calculate Significant Difference Between Two Means in Excel Significant Difference ...

How to Find Critical Value in Excel? (T,Z,F & Chi-Square Critical Values)

In this Excel tutorial, we will learn about critical value in Excel. First, we will discuss what is critical value and the different types of ...

Tally in Excel (All You Need to Know)

In this article, we will discuss and demonstrate how to work with tallies in Excel. Creating tallies in Excel helps organize, analyze, and present ...

How to Perform Bootstrapping in Excel (with Easy Steps)

Introduction to Bootstrapping Bootstrapping is a method of constructing a confidence interval for a statistic with the following features: The ...

Scaling Formula in Excel: 6 Practical Examples

Method 1 - Scale Using Multiplication Symbol Steps: Add a new cell named Scaling Factor. Insert a number on cell E5 as the scaling factor. ...

How to Calculate Bootstrapping Spot Rates in Excel (2 Examples)

  Example 1 - Bootstrapping Spot Rates for Annual Bond The below dataset, Yield to Maturity of Annual Treasury Bond, includes the Par Value, ...

How to Resample Time Series in Excel (3 Examples)

Dataset Overview Here, we have the following time series and the gap between time is 0.1, starting from 0 to 10. With respect to these time periods, ...

How to Calculate Sigma in Excel (3 Effective Methods)

We have the Student Name in column B, ID in column C, and Mark in column D. We'll calculate the sigma value for marks. Method 1 - ...

How to Do Descriptive Statistics in Excel (2 Suitable Methods)

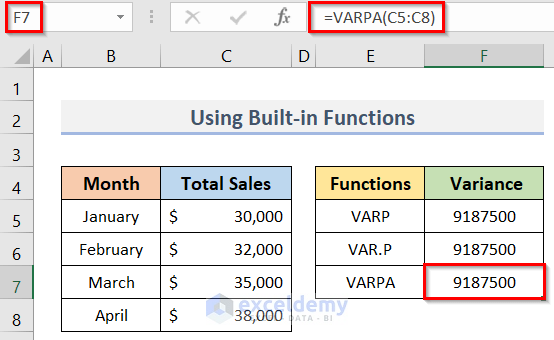
Sometimes you may need to do Descriptive Statistics in Excel. In addition, you can find out lots of statistical terms like Summation, Median, Mean, ...

How to Extrapolate Data in Excel (5 Handy Ways)

What Is Data Extrapolation? Extrapolation refers to predicting values that sit outside of the provided data range, given the assumption that the ...

How to Create a Survey in Excel (2 Easy Methods)

We will use Microsoft 365 as the first method, and Microsoft OneDrive as the second method to create a survey. Watch Video – Create a Survey ...

How to Calculate Margin of Error in Excel (7 Effective Ways)

We will be using two datasets for illustration. Method 1 - Calculate Margin of Error with Standard Deviation Steps: Select a cell for average. ...

How to Do Correlation in Excel (3 Easy Methods)

Correlation is a type of measure, which mainly uses to show the variation between two data. It also describes the strength and direction of two ...

How to Calculate Variance in Excel (3 Handy Approaches)

In statistics, Variance gives the measurement of how the numbers of data are distributed around the mean/expected value, and measures the ...

Comparison Among MAX vs MAXA vs LARGE and MIN vs MINA vs SMALL Functions in Excel

Introduction of MAX, MAXA, LARGE, MIN, MINA, and SMALL Functions 1. MAX Function The MAX function in Excel is used to return the maximum value from ...

Close the CTA

Advanced Excel Exercises with Solutions PDF


ExcelDemy
Logo