The confidence interval is a very important statistical parameter. It gives a proper insight into how precise a data survey is. This allows users to validate their data properly. Excel provides two easy ways to calculate the confidence interval. In this article, we will show how to calculate 99 confidence interval in Excel.
What Is Confidence Interval?
Confidence interval in statistics refers to a range between which the value of a surveyed parameter will fall. 99% confidence interval means 99 out of 100 values will fall within that confidence interval and only 1% will fall over or below that range. For example, if we survey a population for their height and the average height being 1.7 meters with 99% confidence level and the confidence interval being 1.68 to 1.72, then in 99 out of 100 surveys the average value will fall between 1.68 and 1.72.
How to Calculate 99 Confidence Interval in Excel: 2 Easy Ways
In this article, we will show 2 handy ways to calculate 99 confidence interval in Excel. Firstly, we will use the CONFIDENCE function to calculate the interval. Then, we will apply Data Analysis option to do so.
1. Using CONFIDENCE Function
The CONFIDENCE function is a statistical function. This takes in the significance level (alpha), standard deviation, and sample size as the argument to return the confidence interval for a mean of a sample dataset.
Steps:
- To begin with, select the F5 cell and type the following,
=1-F4- Then, hit Enter.
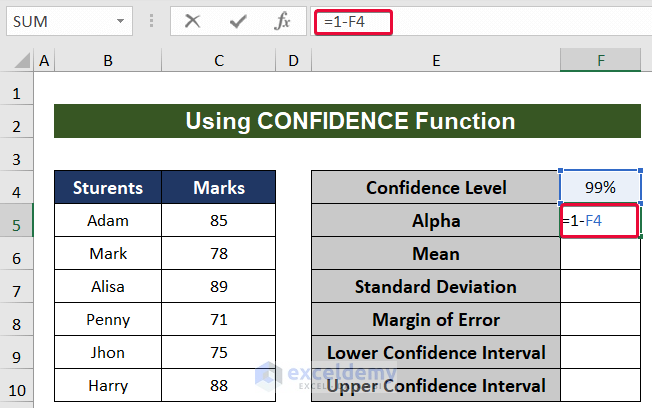
- As a result, we will get the value of alpha.
- After that, select the F6 cell and write down,
=AVERAGE(C5:C10)- Hit Enter.
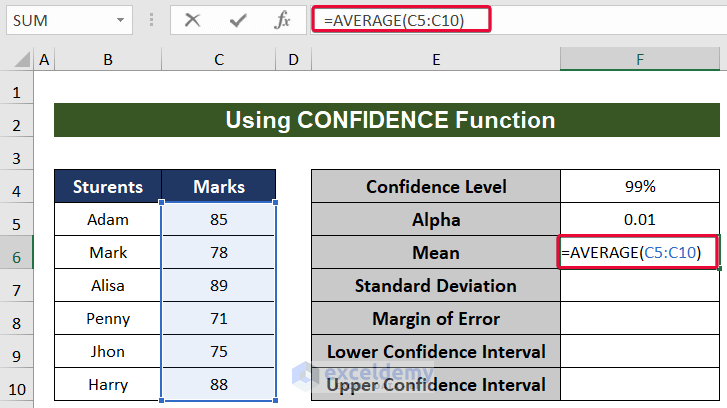
- Consequently, we will get the mean of the data.
- Then, choose the F7 cell and enter the formula below,
=STDEV(C5:C10)- Press Enter.
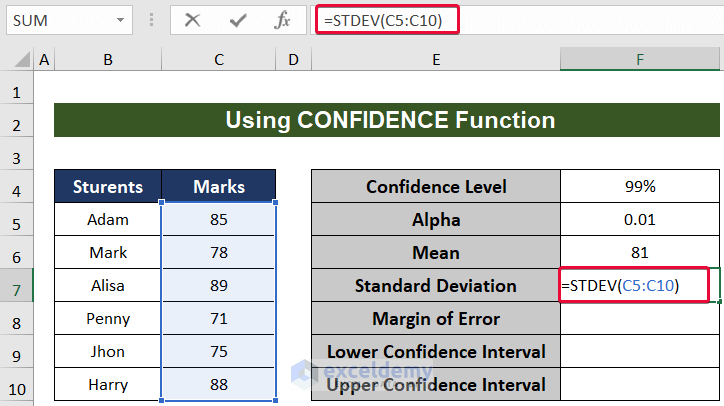
- Consequently, we will get the standard deviation of the dataset.
- Afterward, select the F8 cell and type,
=CONFIDENCE.T(F5,F7,6)- Then, hit the Enter button.
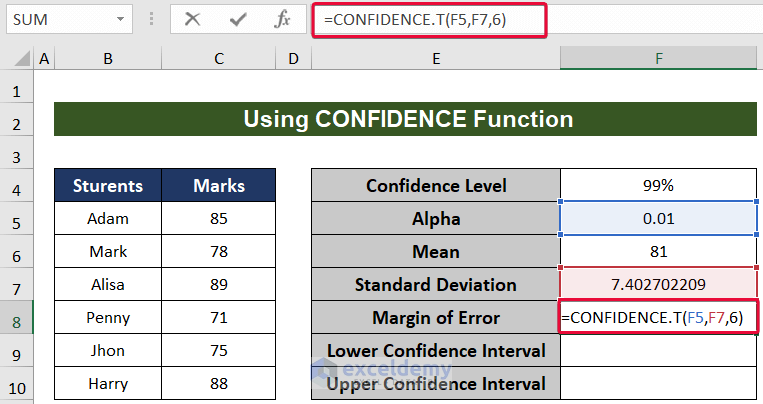
We used the CONFIDENCE.T function instead of the CONFIDENCE.NORM function because our data sample is very small and less likely to result in a normal distribution.
- As a result, we will have a margin of error for this data.
- Then, select the F9 cell and write the following formula below,
=F6-F8- Press Enter.
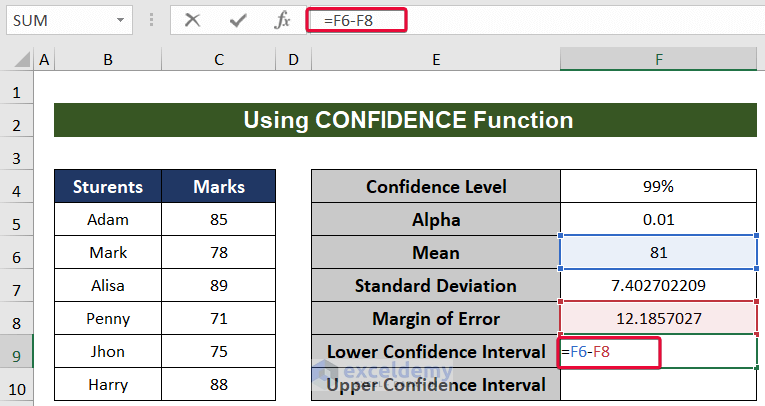
- Consequently, we will have a lower confidence level interval.
- Finally, select the F10 cell and type the following formula,
=F6+F8- Hit Enter.

- Finally, we will have the upper and lower confidence interval for our dataset.

2. Applying Data Analysis Option
The Data Analysis option is a tool that is a part of the Analysis Toolpak of Excel. Here, we will make use of this tool to calculate the confidence interval for our dataset.
Steps:
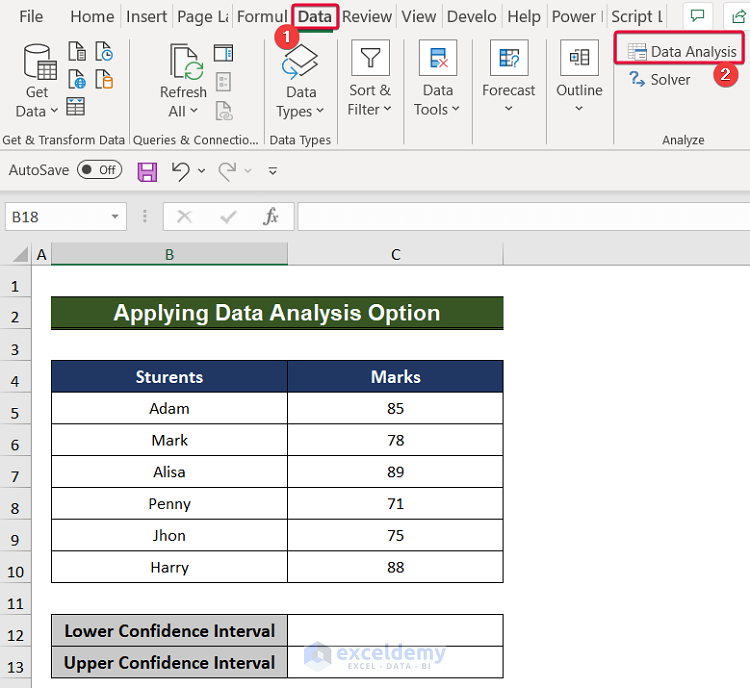
- Firstly, go to the Data tab.
- Then, select the Data Analysis option from the Analyze group.
- Consequently, a prompt will be opened.
- From the prompt, first, select the Descriptive Statistics option.
- Then, click on OK.

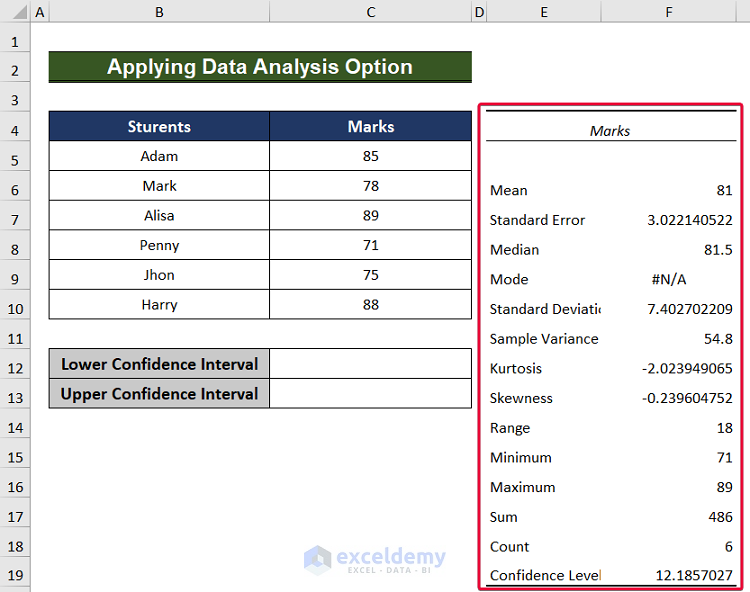
- In the Descriptive Statistics prompt, first, select the input range of data from which you want to get the confidence interval.
- Here, we will choose the range C4:C10.
- Secondly, mark the “Labels in first row” box.
- Thirdly, select the output range.
- In this case, it will be E4:F19.
- Then, mark the “Summary statistics” box.
- After that, set the Confidence Level for Mean.
- We will set it to 99%.
- Finally, click OK.

- Consequently, we will have a statistical summary of our data.
- After that, choose the C12 cell and write the following formula,
=F6-F19- Hit Enter.

- As a result, we will get a lower confidence interval for the data.
- Then, select the C13 cell and enter,
=F6+F19- Press the Enter button.
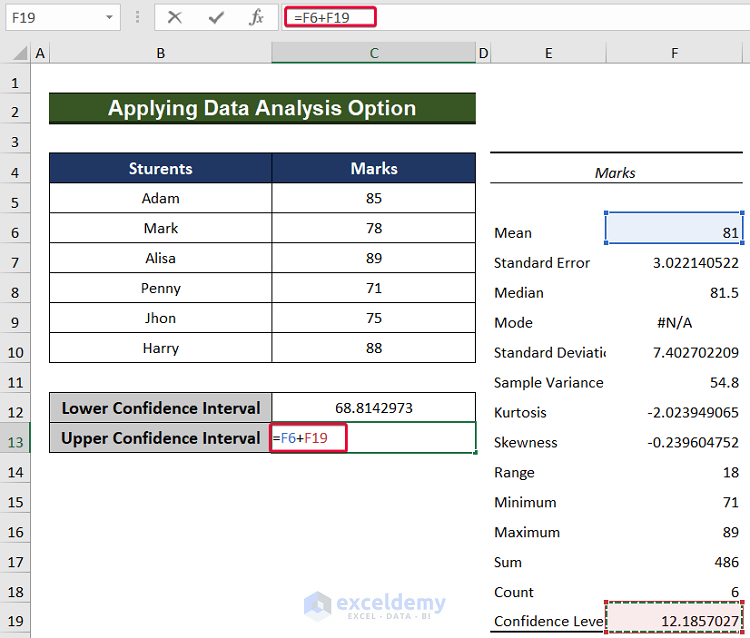
- Consequently, we will have the upper and lower confidence interval for our dataset.

Download Practice Workbook
You can download the practice workbook here.
Conclusion
In this article, we have discussed 2 methods to calculate 99 confidence interval in Excel. These methods will allow users to interpret their data more accurately.
Related Articles
- How to Make a Confidence Interval Graph in Excel
- Find Confidence Interval in Excel for Two Samples
- Linear Regression Confidence Interval in Excel
- How to Calculate 95 Percent Confidence Interval in Excel
- Calculate Forecast Confidence Interval in Excel
- How to Calculate Confidence Interval for Slope in Excel
- How to Find Upper and Lower Limits of Confidence Interval in Excel
- How to Calculate Confidence Interval in Excel
- How to Calculate 90 Percent Confidence Interval in Excel
<< Go Back to Confidence Interval Excel | Excel for Statistics | Learn Excel

