Confidence Interval Excel
Nov 11, 2025
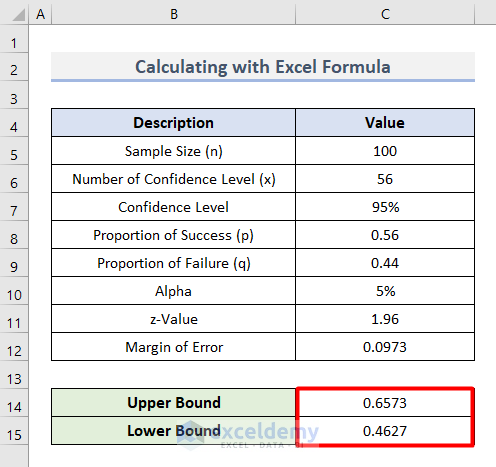
We can perform many extensive statistical calculations with Excel easily. The confidence interval is one of the most important calculations in ...
Nov 11, 2025
The confidence interval is a very important statistical parameter. It gives a proper insight into how precise a data survey is. This allows users to ...
Nov 11, 2025
The Confidence Interval is an important indicator of the limitations of estimates in a set of data. It is important to measure if enough simulations ...
Nov 11, 2025
When you want to gather any formation based on a large population, things get difficult sometimes to capture this huge number of people. In that ...
Aug 3, 2024
Consider the problem below:
3 out of 100 New Yorkers have red hair. Construct a 90% confidence interval for the proportion of red haired people in ...
Nov 11, 2025
The article will show you how to calculate Confidence Interval without standard deviation in Excel. Basically, it’s easy to determine the Confidence ...
Jul 7, 2024
Steps
Select the entire dataset (B4:C13). Then go to Insert >> Insert Scatter (X, Y) or Bubble Chart >> Scatter as shown below.
...
Nov 11, 2025
While dealing with the sales of a company, sometimes we need to forecast the sales of that company to predict the profit or loss. In this case, ...
Nov 11, 2025
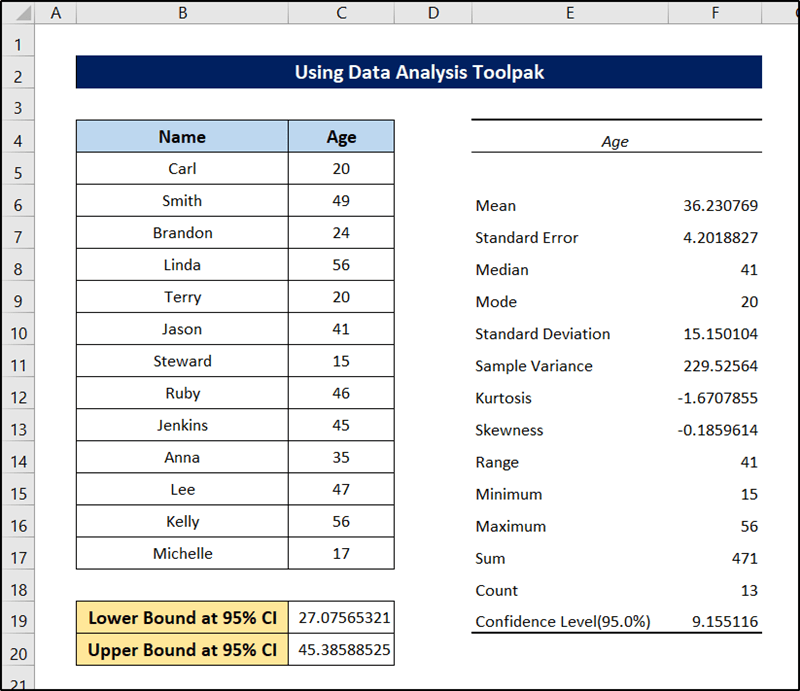
Excel is a powerful tool for analyzing data and handling large datasets. It is sometimes necessary to perform statistical calculations in order to ...
Nov 11, 2025
Are you a business analyst or a data science enthusiast? Do you work with a large amount of data? Then, you’ve come across a statistical term ...
Nov 11, 2025
When you want to do research with a large number of people, it is impossible to take all people individually at a time. That’s why we can take a ...
Nov 11, 2025
Confidence interval or CI is the measurement of the range of estimates for a particular parameter. This is an important concept in data analysis. As ...
Aug 4, 2024
This article illustrates how to calculate the Confidence Interval for a difference in Means in Excel, both by using Excel's statistical functions and ...
Nov 11, 2025
If you want to calculate P-Value from Confidence Interval in Excel, you have come to the right place. Here, we will walk you through 3 easy and ...
Jul 7, 2024
Method 1 - Make Both Sided Confidence Interval Graph Using Margin Value
Steps:
Choose the Category and Value columns.
Go to the Insert tab. ...