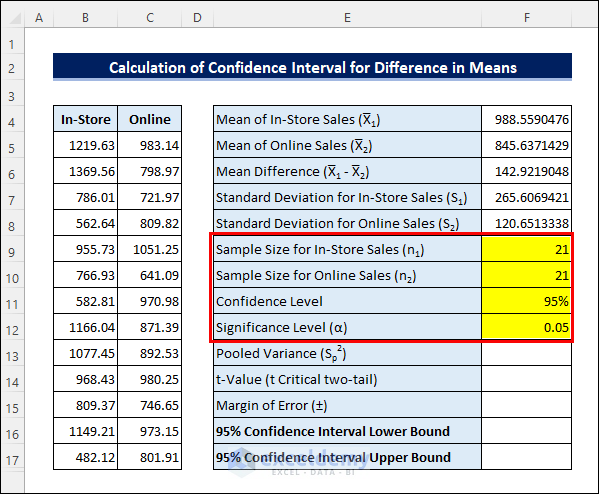
This article illustrates how to calculate the Confidence Interval for a difference in Means in Excel, both by using Excel’s statistical functions and by means of the Data Analysis tool. The following picture shows a sample result obtained from such operations.
What Is a Confidence Interval?
Confidence Interval (CI) is a statistical term referring to a range of values that include a population with an assumed confidence level. It is often used to analyze the statistical significance of a certain estimation, and depends on the sample size, sample variance, and confidence level. Statisticians normally use a 95% confidence level to calculate the confidence interval. This measure is often misunderstood or misinterpreted as saying that 95% of the sample values lie within the confidence interval, although this may not be the case.
Calculating the Confidence Interval in Excel for a Difference in Means: 2 Methods
Suppose we have a bookstore with an online extension and are wondering if the average daily sales through the website of the store are different from the in-store sales. For this purpose, have collected the sales data for 3 weeks both from the in-store and online sales.
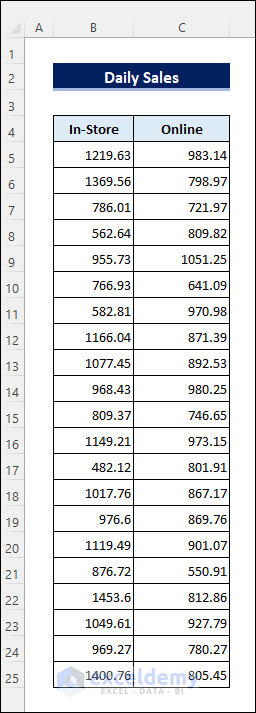
Let’s calculate the confidence interval based on this dataset to draw a conclusion.
Method 1 – Using Formulas to Calculate the Confidence Interval for a Difference in Means
Steps:
First we’ll calculate the Mean of In-Store sales. Then we’ll calculate the Mean of Online sales in a similar way. Finally, we’ll subtract one Mean from the other to derive the Mean Difference.
- Enter the following formula in cell F4 to calculate the Mean of In-Store sales:
=AVERAGE(B5:B25)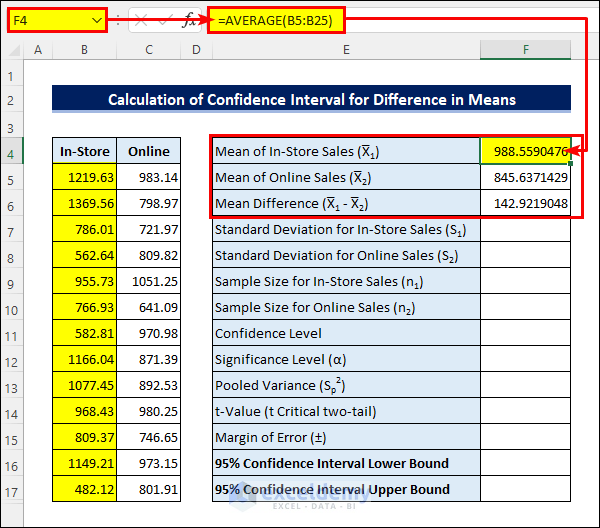
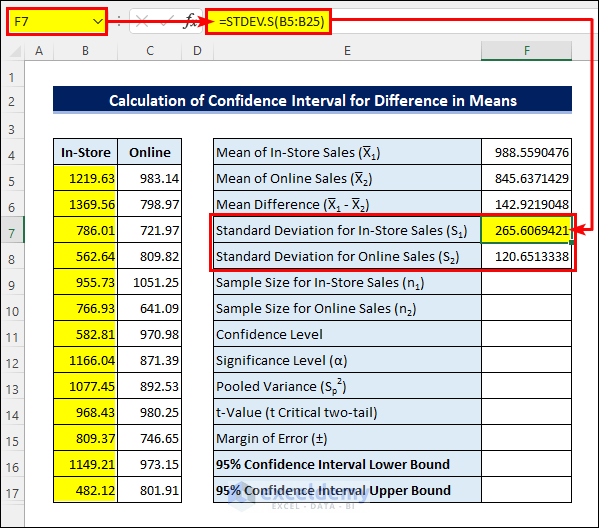
- Enter the following formula in cell F7 to get the Standard Deviation for In-Store sales:
=STDEV.S(B5:B25)- Calculate the Standard Deviation for Online sales in the same way.
- Enter the Sample Sizes and Significance Level.
- Apply the following formula in cell F13 to calculate the Pooled Variance:
=((F9-1)*F7^2+(F10-1)*F8^2)/(F9+F10-2)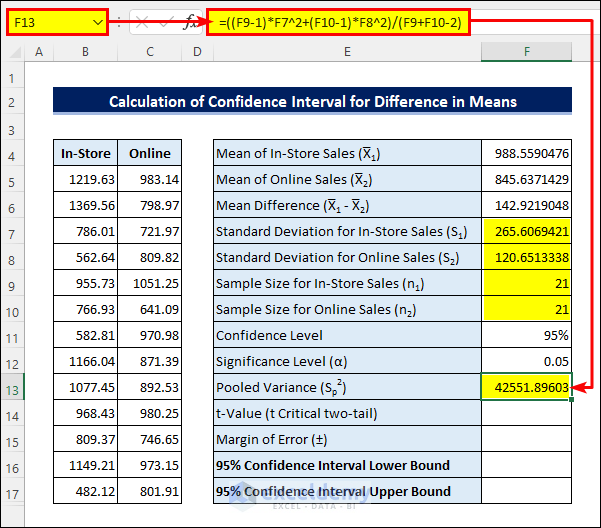
- Enter the following formula in cell F14 to calculate the t-Value:
=T.INV.2T(F12,F9+F10-2)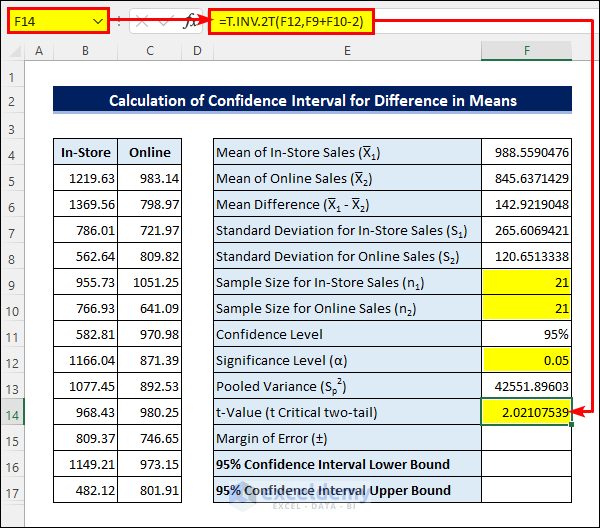
- Apply the following formula in cell F15 to get the Margin of Error:
=F14*SQRT(F13/F9+F13/F10)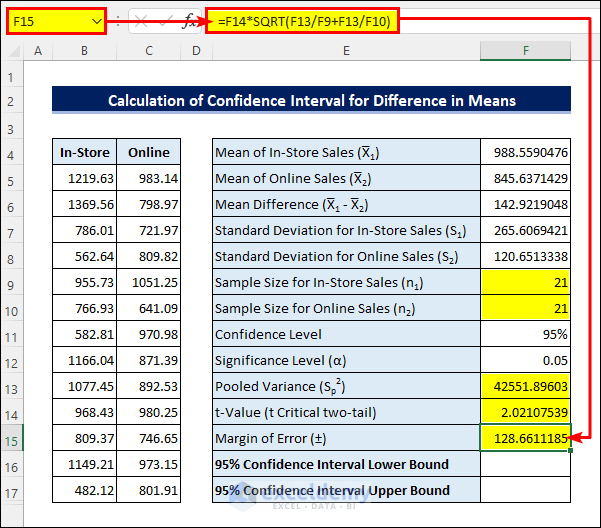
- Finally, subtract the Margin of Error from the Mean Difference to get the Confidence Interval Lower Bound, then add them to get the Upper Bound.
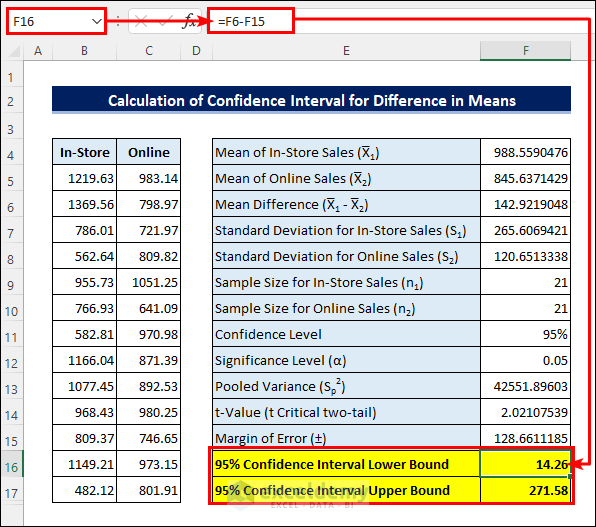
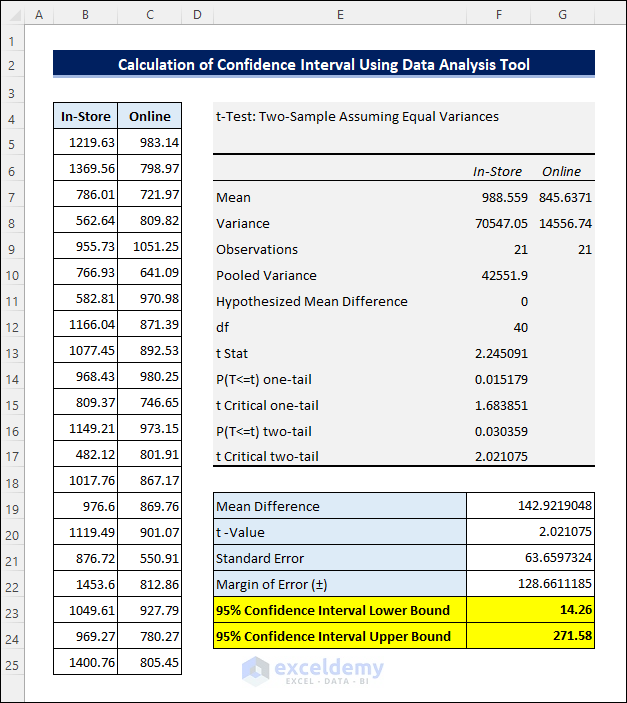
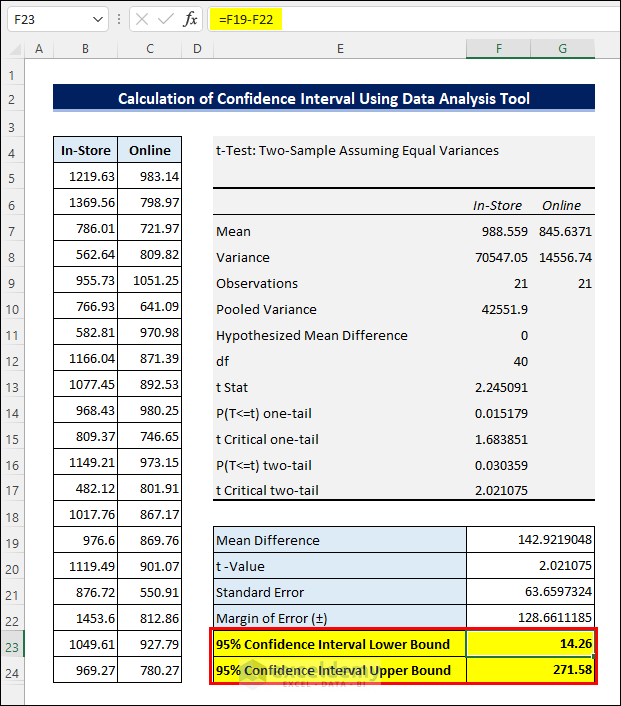
The results suggest that there is a possibility that the Mean for daily In-Store sales will be $14.26 to $271.58 higher than for Online sales.
Method 2 – Using the Data Analysis Tool to Calculate the Confidence Interval for a Difference in Means
Steps:
- If necessary, enable the Analysis Toolpak add-in from File >> Options >> Add-ins >> Go.
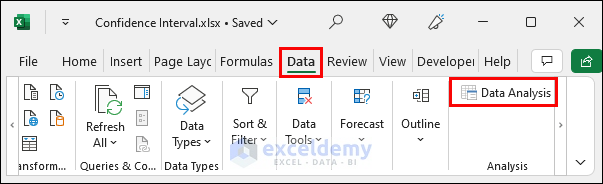
- Select Data >> Data Analysis.
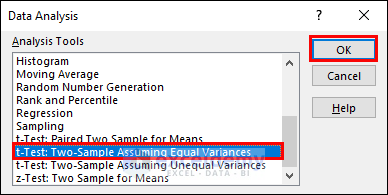
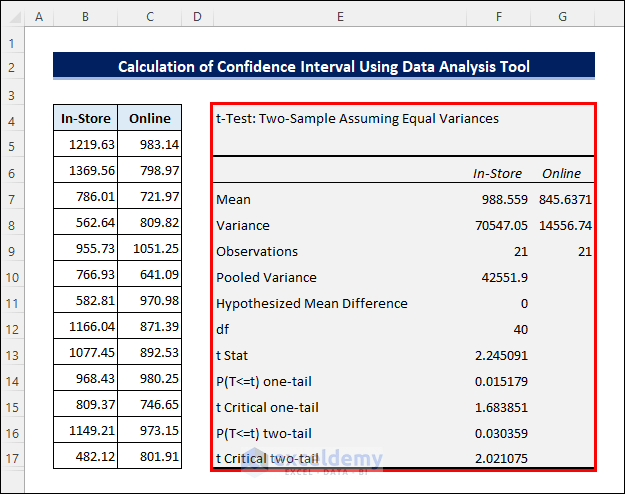
- Choose t-Test: Two-Sample Assuming Equal Variances and click OK.
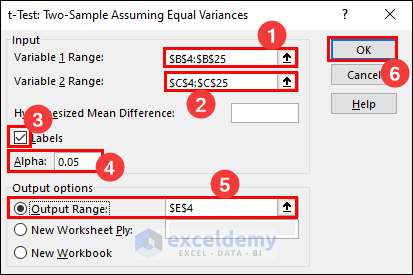
- Select the sample ranges as the Variable 1 Range and Variable 2 Range respectively.
- Check the Labels checkbox and keep the Alpha value as 0.05.
- Enter the output range.
- Click OK.
The following result is returned:
- Calculate the Mean Difference by subtracting the two Means using the t-Value from the analysis.
- Apply the following formula in cell F21 to calculate the Standard Error:
=SQRT(F8/F9+G8/G9)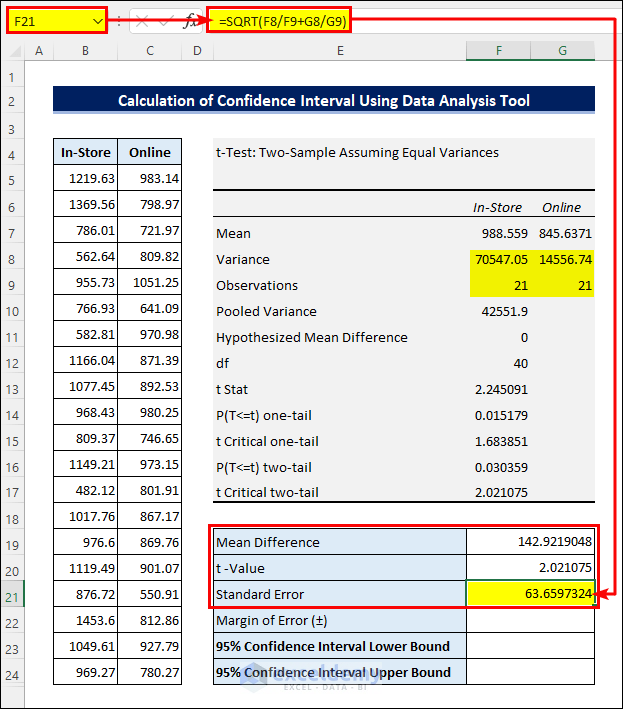
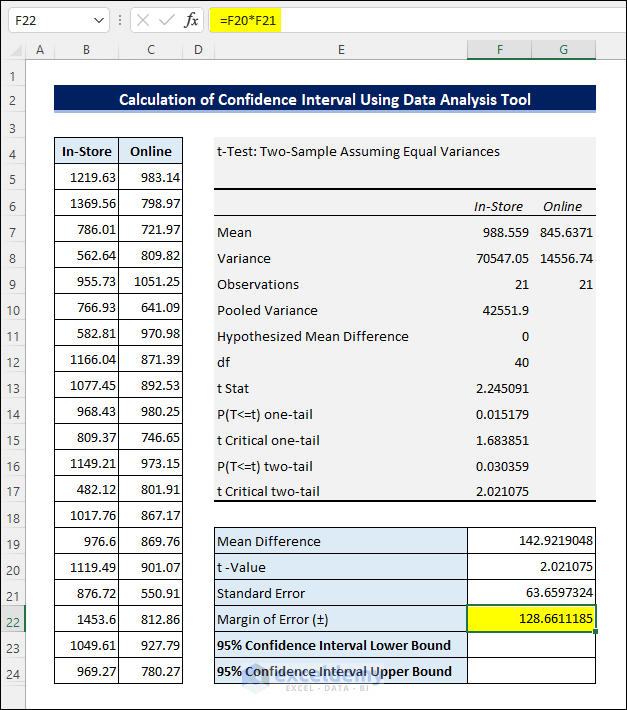
- Multiply the t-Value with the Standard Error to get the Margin of Error.
- Finally, calculate the Confidence Interval by adding and subtracting the Margin of Error to and from the Mean Difference as above.
Things to Remember
- Enable the Data Analysis tool from File >> Options >> Add-ins >> Go if it is not enabled already.
- Use a different Confidence Level or assume unequal Sample Variances if required.
Download Practice Workbook
Related Articles
- How to Calculate P-Value from Confidence Interval in Excel
- How to Calculate Population Proportion in Excel
- How to Calculate Confidence Interval Proportion in Excel
- How to Calculate Confidence Interval for Population Mean in Excel
<< Go Back to Confidence Interval Excel | Excel for Statistics | Learn Excel
Get FREE Advanced Excel Exercises with Solutions!
