Excel is a powerful tool for analyzing data and handling large datasets. It is sometimes necessary to perform statistical calculations in order to interpret a large dataset. If you are looking for special tricks to calculate 95 percent confidence interval in Excel, you’ve come to the right place. There are numerous ways to calculate a 95 percent confidence interval in Excel. This article will discuss the details of these methods. Let’s follow the complete guide to learn all of this.
What Is Confidence Interval?
Confidence intervals determine the probability of a mean value lying within a range of values. In a sample, it measures the degree of certainty and uncertainty. Confidence levels can be classified as upper or lower. A narrow interval indicates a more accurate prediction.
The confidence interval may calculate using the standard error. The lower the error the better prediction may take place. If we take a larger sample, it will provide far more accurate results. For example, we would like to make an app for a large population. You can’t take feedback from all of them. In that case, we need to take some people and their opinions. These opinions can be used to make the app better. The confidence interval can deal with the situation and gives us a range through which we can identify which people of which age are satisfied with the app. We can deliver the app to those certain people who can give their feedback after using it. Finally, we can assume the overall scenario of the population.
Unlike hypothesis testing, the confidence interval is not time-consuming. And it is far easier to interpret. To calculate the confidence interval, we can use the following formula.

Here, CI = Confidence Interval for Infinite Population
Zc = Z Value for Confidence Level
S = Sample Standard Deviation
n = Number of Elements in a Sample
What Does 95 Percent Confidence Interval Mean?
The 95 confidence interval shows values that are within 95% of the mean value of your dataset. Say, you have a mean value of 60 for your dataset. For a 95 percent confidence interval, you calculated the confidence value of your dataset using the significance level of 0.05. Then, the confidence interval result at 90 confidence interval for this whole scenario will be 57.5-62.5.
What Is the Z Value for 90%,95%, and 98% Confidence Intervals?
The NORMSINV function in Excel calculates left-aligned values for z values. To calculate Z scores for 90 %, 95%, and 98%, you have to follow the following process.
- At first, calculate the mid-value 1 by writing the following formula.
=(100-B5)/(100*2)
- Next, press Enter.

- Then, calculate the mid-value 2 by writing the following formula.
=1-C5
- Next, press Enter.
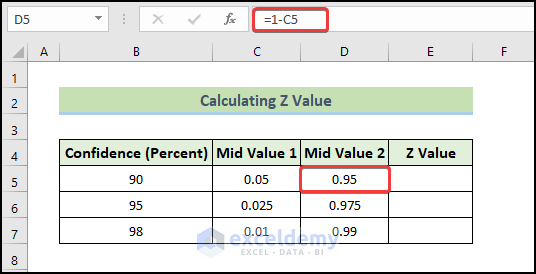
- Then, calculate the z value by writing the following formula.
=NORMSINV(D5)
- Next, press Enter.
- Therefore, you will get the Z value for different percentage confidence.

How to Calculate 95 Percent Confidence Interval in Excel: 4 Suitable Methods
The following section will use four effective and tricky methods to calculate the 95 percent confidence interval in Excel. This section provides extensive details on these methods. You should learn and apply these to improve your thinking capability and Excel knowledge. We use the Microsoft Office 365 version here, but you can utilize any other version according to your preference.
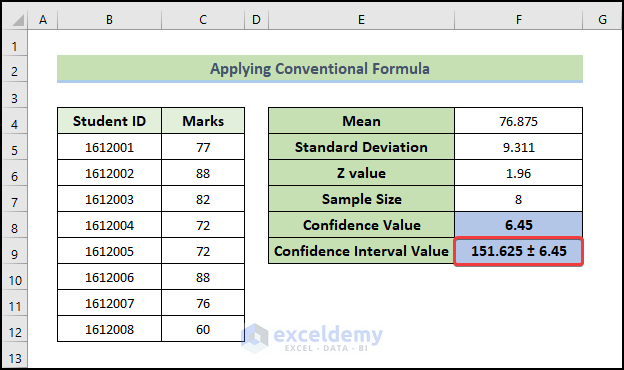
1. Applying Conventional Formula
Here, we will demonstrate how to calculate a 95 percent confidence interval based on using the conventional formula. By using this method, we are able to calculate the confidence interval based on the basic formula. We need to calculate the standard deviation, z value, and a number of elements in a sample to accomplish this. We will use the AVERAGE function to calculate the mean value of the sample. Then, we use the STDEV.S function to determine the standard deviation.
The following dataset contains the student ID and their exam score.
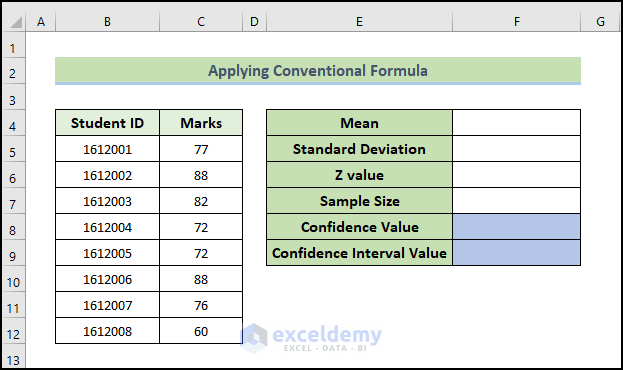
Follow these steps to see how we can calculate the 95 percent confidence interval in Excel.
📌 Steps:
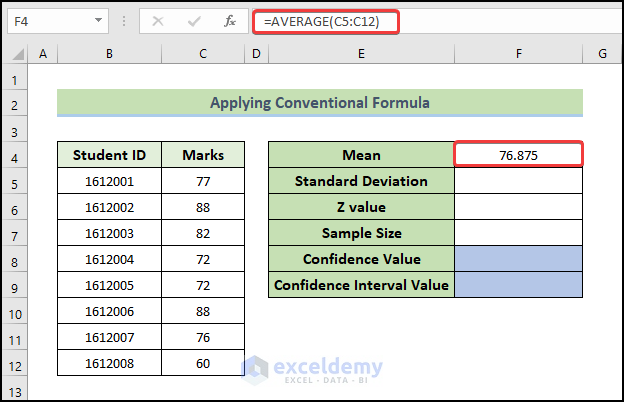
- First of all, select the cell you want to put the value in (cell F4).
- Then write down the following formula in it.
=AVERAGE(C5:C12)
- Next, press Enter.
- Consequently, you will get the mean value in cell F4.
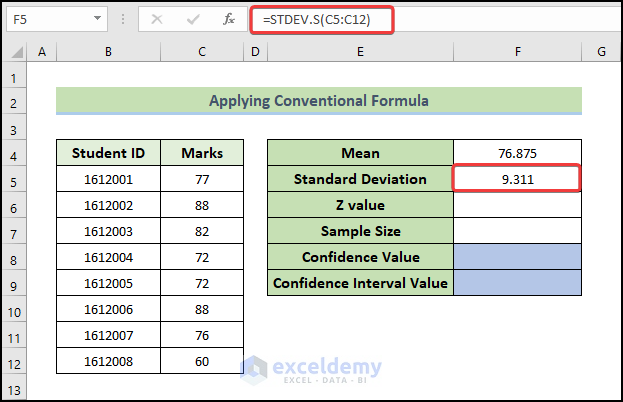
- Afterward, select cell F5.
- Then write down the following formula in it.
=STDEV.S(C5:C12)
- Next, press Enter.
- Therefore, you will get the standard deviation value in cell F5.
- Next, you need to find out the z value for the confidence level. For a 95% confidence level, the z value is 1.96. If you have another confidence level, then, you need to find it using the z value chart.
- Then, write down the total sample size. Here, we take a total of eight sample sizes.
- Next, we will evaluate the confidence value using the conventional formula.
- To do this, select cell F8.
- Then, write down the following formula.
=F6*(F5/SQRT(F7))
- Next, press Enter.
- As a consequence, you will get the confidence value in cell F8.

- As a final step, we need to add or subtract the confidence value from the mean value in order to get the confidence interval value. For the lower confidence value, subtract the confidence value from the mean value and add the confidence value with the mean value to calculate the upper confidence interval.
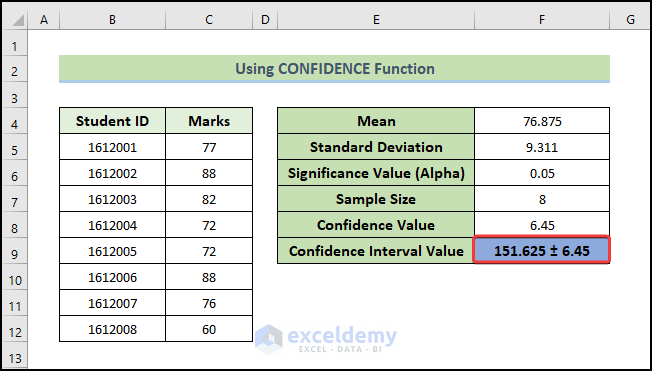
2. Using CONFIDENCE Function
Using the CONFIDENCE function, we can perform the following method. In this method, we will calculate the mean, standard deviation, and alpha to get the desired confidence value. We will use the AVERAGE function to calculate the mean value of the sample. Then, we use the STDEV.S function to determine the standard deviation.
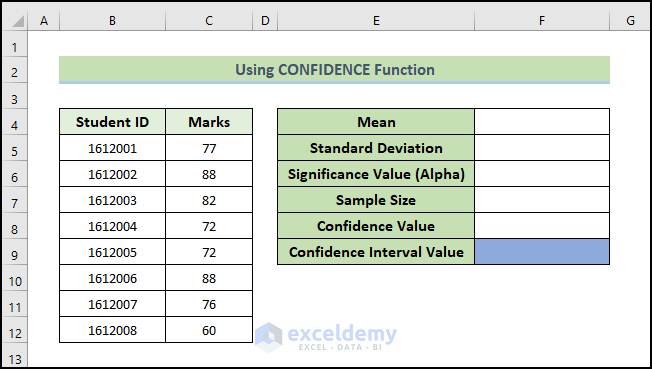
You need to follow these steps to see how we can calculate the 95 percent confidence interval in Excel.
📌 Steps:
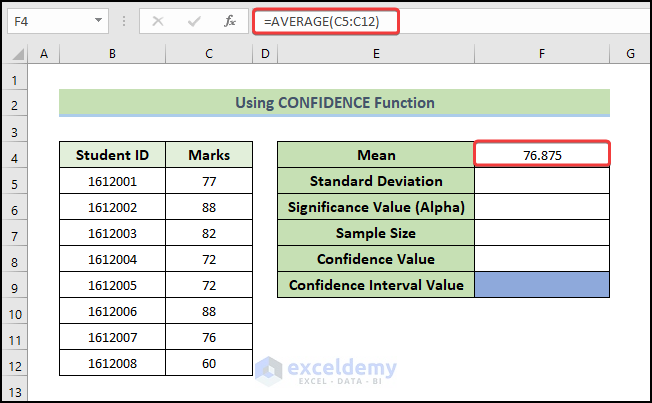
- First of all, select the cell you want to put the value in (cell F4).
- Then write down the following formula in it.
=AVERAGE(C5:C12)
- Next, press Enter.
- Consequently, you will get the mean value in cell F4.
- Afterward, select cell F5.
- Then write down the following formula in it.
=STDEV.S(C5:C12)
- Next, press Enter.
- Therefore, you will get the standard deviation value in cell F5.

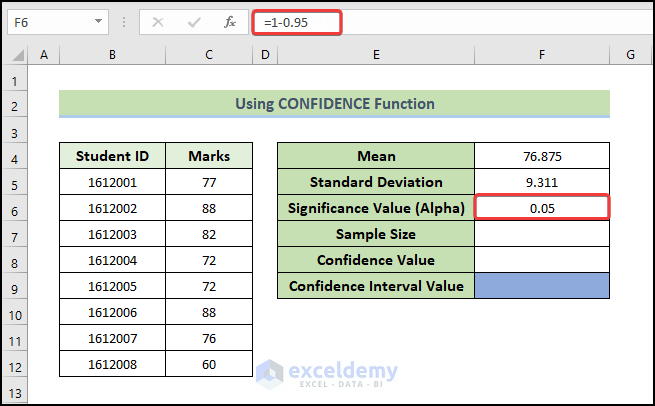
- After that, you need to calculate alpha by utilizing the 95% confidence level. To get alpha, we need to subtract a 95% confidence level from 1.
- Next, select cell F6 and write down the following formula.
=1-0.95
- Next, press Enter.
- Therefore, you will get the significance value (alpha) in cell F6.
- Then, write down the total sample size. Here, we take a total of eight sample sizes.
- Next, we will evaluate the confidence value using the conventional formula.
- To do this, select cell F8, and write down the following formula.
=CONFIDENCE(F6,F5,F7)
- Next, press Enter.
- As a consequence, you will get the confidence value in cell F8.

- As a final step, we need to add or subtract the confidence value from the mean value in order to get the confidence interval value. For the lower confidence value, subtract the confidence value from the mean value and add the confidence value with the mean value to calculate the upper confidence interval.
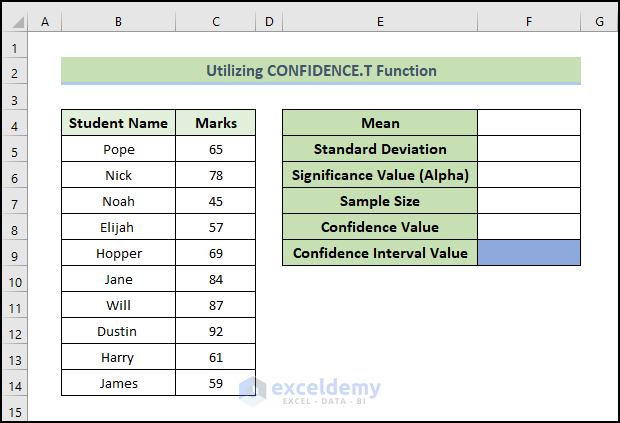
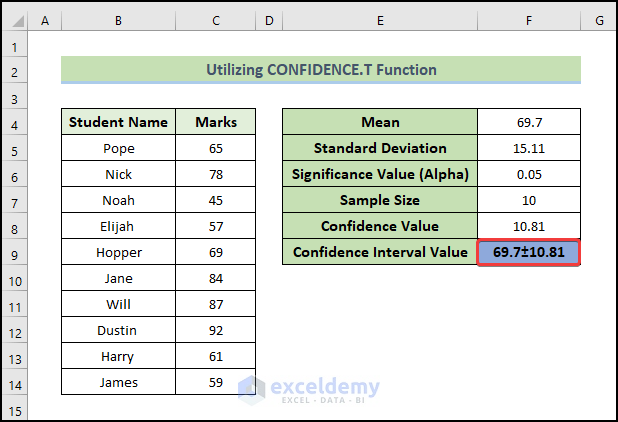
3. Utilizing CONFIDENCE.T Function
In the third method, we will use the CONFIDENCE.T function to illustrate how we calculate the 95 percent confidence interval in Excel. In this method, we will calculate the mean, standard deviation, and alpha to get the desired confidence value. We will use the AVERAGE function to calculate the mean value of the sample. Then, we use the STDEV.S function to determine the standard deviation.
You need to follow these steps to see how we can calculate the 95 percent confidence interval in Excel.
📌 Steps:
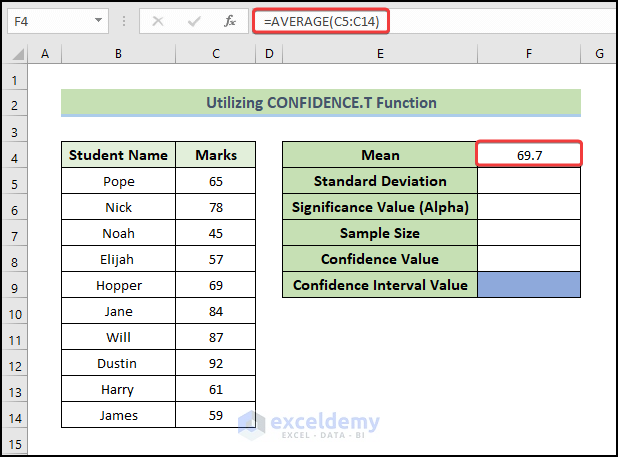
- First of all, select the cell you want to put the value in (cell F4).
- Then write down the following formula in it.
=AVERAGE(C5:C14)
- Next, press Enter.
- Consequently, you will get the mean value in cell F4.
- Afterward, select cell F5.
- Then write down the following formula in it.
=STDEV.S(C5:C14)
- Next, press Enter.
- Therefore, you will get the standard deviation value in cell F5.

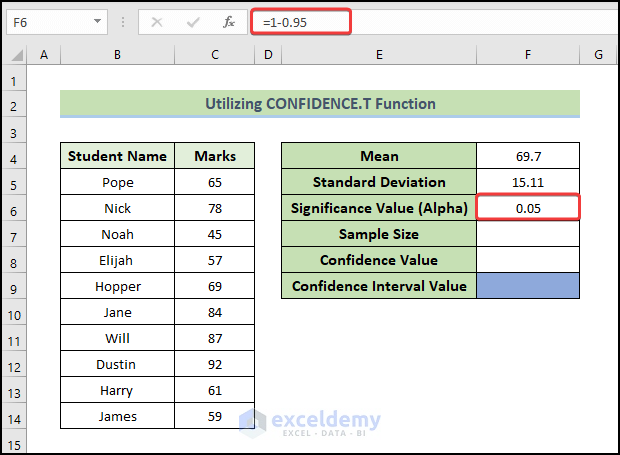
- After that, you need to calculate alpha by utilizing the 95% confidence level. To get alpha, we need to subtract a 95% confidence level from 1.
- Next, select cell F6 and write down the following formula.
=1-0.95
- Next, press Enter.
- Therefore, you will get the significance value (alpha) in cell F6.
- Then, write down the total sample size. Here, we take a total of ten sample sizes.
- Next, we will evaluate the confidence value using the conventional formula.
- To do this, select cell F8, and write down the following formula.
=CONFIDENCE.T(F6,F5,F7)
- Next, press Enter.
- As a consequence, you will get the confidence value in cell F8.

- To get the confidence interval value, we need to add or subtract the confidence value from the mean value. For the lower confidence value, subtract the confidence value from the mean value and add the confidence value with the mean value to calculate the upper confidence interval.
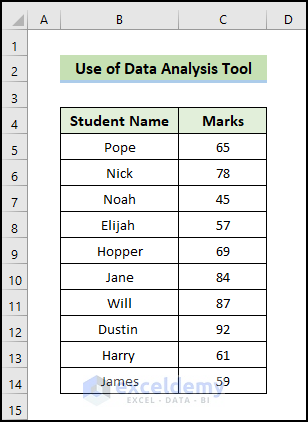
4. Use of Data Analysis Tool
In this last method, we will use the data analysis toolpak. At first, we need to enable the data analysis tool from Excel Add-ins before following the method. After that, we will be capable of using this tool.
You need to follow these steps to see how we can calculate the 95 percent confidence interval in Excel.
📌 Steps:
- First of all, to apply the data analysis procedure, go to the Data tab on the ribbon.
- Then, select Data Analysis from Analyze group.

- Then, the Data Analysis dialog box will appear.
- From there, select Descriptive Statistics.
- Next, click on OK.

- It will take us to the Descriptive Statistics dialog box.
- Then, select the Input Range from your dataset.
- Set the Output options as New Worksheet Ply.
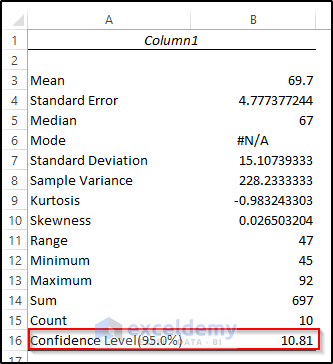
- Then, check on Summary statistics and Confidence Level for Mean.
- Finally, click on OK.

- As a consequence, we will get the following summary where the data analysis tool calculates the confidence value. See the screenshot.
Read More: How to Find Confidence Interval in Excel for Two Samples
💬 Things to Remember
✎ When finding the standard deviation, you may encounter two similar functions named STDEV.P and STDEVPA.Use the STDEV.P function here as it ignores the non-numerical data.
The standard_dev argument has to be greater than zero to avoid the #NUM! error.
✎ In Excel 2010, you will find the CONFIDENCE function as CONFIDENCE.NORM function.
✎ The value of the alpha argument inside the CONFIDENCE function can not be less than or equal to 0. Else, it would show #NUM! error.
✎ The CONFIDENCE function only takes numeric values. Otherwise, it will show an error.
✎ The size argument must be greater than one to avoid the #NUM! Error. If the size argument is not an integer, it would be truncated. The CONFIDENCE function will show #VALUE! Error, if any argument is non-numeric.
✎ In the recent Excel version, the T function takes the place of the CONFIDENCE function.
✎ The confidence interval is equal to the plus or minus value of the mean value and confidence value in Excel.
Download Practice Workbook
Download this practice workbook to exercise while you are reading this article. It contains all the datasets in different spreadsheets for a clear understanding. Try it yourself while you go through the step-by-step process.
Conclusion
That’s the end of today’s session. I strongly believe that from now, you may be able to calculate 95 percent confidence interval in Excel. If you have any queries or recommendations, please share them in the comments section below.
Keep learning new methods and keep growing!
Related Articles
- Calculate Forecast Confidence Interval in Excel
- Make a Confidence Interval Graph in Excel
- How to Calculate Confidence Interval for Slope in Excel
- Linear Regression Confidence Interval in Excel
- How to Calculate 99 Confidence Interval in Excel
- How to Find Upper and Lower Limits of Confidence Interval in Excel
<< Go Back to Confidence Interval Excel | Excel for Statistics | Learn Excel
Get FREE Advanced Excel Exercises with Solutions!
