Are you a business analyst or a data science enthusiast? Do you work with a large amount of data? Then, you’ve come across a statistical term Confidence Interval obviously somewhere in your job. Here, we will take you through 3 easy and convenient methods with detailed steps on how to find the confidence interval in Excel for two samples.
Confidence Interval: Basics
First, we need to clarify what a confidence interval is before moving on. The probability of a mean value occurring within a spectrum of values is determined by the confidence interval. We determine the level of certainty and uncertainty of a sample using it. The forecast seems to be more precise if the interval is minimal.
Let’s discuss it in more detail now. It is impractical to conduct research with a large number of participants by taking each one individually at a time. Because of this, we can assume that a small sample size accurately represents the overall population. The determination of the confidence interval can then be taken into consideration. It might assist the developer in comprehending user needs when creating an app.
Generic Formula to Calculate Confidence Interval
We can use the standard error to compute the confidence interval. A better prediction may occur when the error level is relatively lower. A larger dataset will yield results that are far more precise. For example, in this case, let’s say we are building an app for a big audience. It’s not possible to take assessments from all of the end users. In this certain situation, we must consider a few individuals and their perspectives. These suggestions can help to improve the app. The confidence interval takes into account the circumstance and provides a limit that enables us to identify which users of which ages are contented with the application. Designers can distribute the program to selected users so they can provide reviews after experiencing it. Conclusively, we can rely on the population’s general situation.
The confidence interval has the key benefit of not taking as much time as hypothesis testing. It is also much simpler to interpret. We can use the formula below to determine the confidence interval:
CI = Zc * (S / √ n )
Here, CI = Confidence Interval
Zc = Z Value for Confidence Level
S = Standard Deviation
n = Number of Elements in a Sample
How to Find Confidence Interval in Excel for Two Samples: 3 Creative Methods
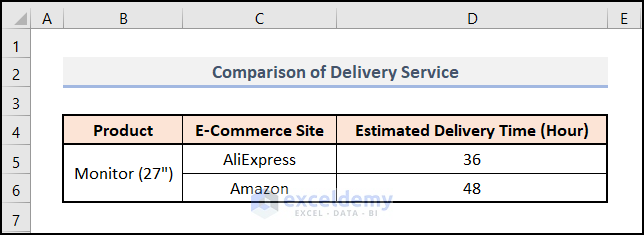
To find the confidence interval in Excel for two samples, we have found 3 different and effective methods through which you can have complete knowledge. In this article, we’ll utilize several Excel functions and also will use the Data Analysis tool. All of these methods are very effective and user-friendly. To have a better understanding, we’re using the Comparison of Delivery Service of a certain product. Here, the dataset contains the Product name, two E-Commerce Sites from where the product has been ordered and the Estimated Delivery Time (in hours) in columns B, C, and D respectively.
Now, we’ll calculate the confidence interval for these two samples in Excel. So, without further delay, let’s go through the approaches one by one.
Here, we have used Microsoft Excel 365 version, you may use any other version according to your convenience.
1. Finding Confidence Interval Using Generic Formula
The foundation of our first approach is the generic formula. With this approach, we hope to obtain the desired result by applying the fundamental formula of the confidence interval. To do this, we need to calculate the standard deviation, z value, and the number of elements in a sample. So, follow the steps carefully.
📌 Steps:
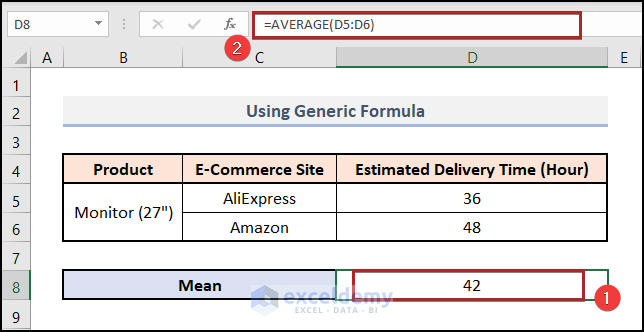
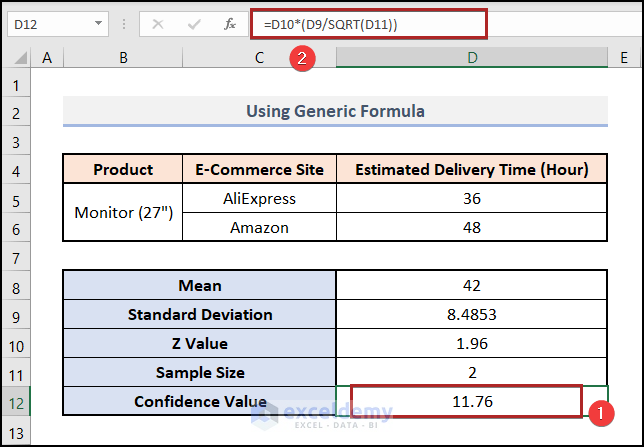
- At the very beginning, we’ll calculate the mean value of the sample.
- To do this, select cell D8 and insert the following formula into the Formula Bar.
=AVERAGE(D5:D6)
Here, D5:D6 cells represent the cell reference of Estimated Delivery Time for the two E-Commerce Sites. And the AVERAGE function returns the average value of a given argument.
- Then, press ENTER.
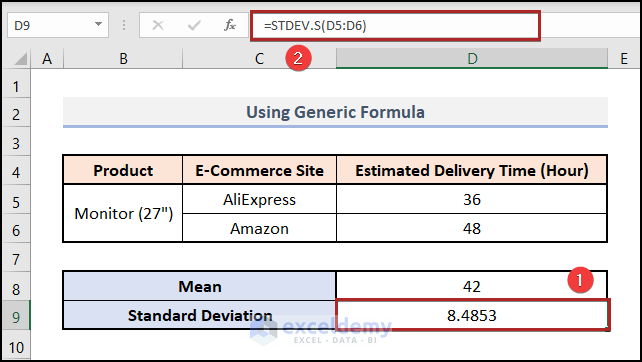
- Then, we must determine the standard deviation inserting the STDEV.S function.
- In order to do this, select cell D9 first.
- After that, enter the following formula.
=STDEV.S(D5:D6)
- Lastly, hit ENTER.
- Next, we need to compute the z value for the given level of confidence. Typically, we utilize the confidence level of 95%. The z value for a 95% confidence level is 1.96. When you have a different level of confidence, you must use the z-value chart to locate it.
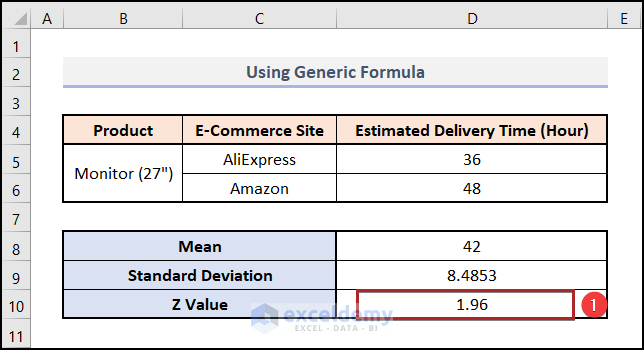
- In this case, the sample size is 2 because it has only two elements.
- In cell D13, write down the formula stated below.
=D10*(D9/SQRT(D11))
It’s just the Excel version of the generic formula we stated above.
- Consequently, tap the ENTER key.
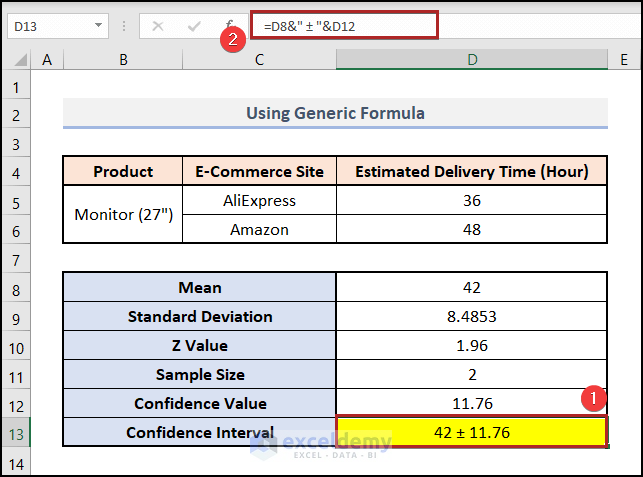
- Then, we must either add or subtract the confidence value from the mean value in order to obtain the confidence interval. Calculate the lower confidence value by subtracting the confidence value from the mean value and add the confidence value to get the upper confidence interval.
Read More: How to Calculate Confidence Interval in Excel
2. Using CONFIDENCE Function
In this approach, we’ll use the CONFIDENCE function as the foundation of our strategy. This function takes alpha, standard_dev, and size as arguments. As a result, it returns us the confidence value of the sample. In this case, it uses the normal distribution. In this method, we will use the mean, standard deviation, and alpha to find the desired confidence value. To understand the method properly, follow the steps carefully.
📌 Steps:
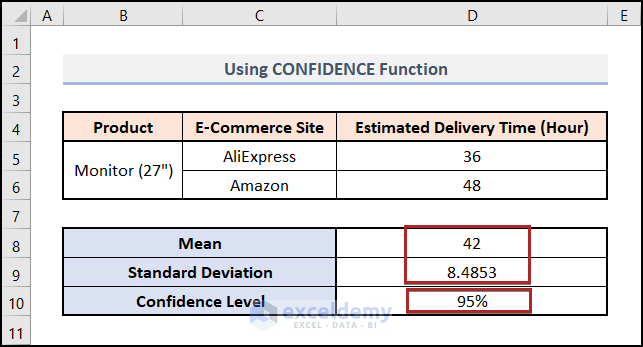
- At first, calculate the Mean value and Standard Deviation just like we did in Method 1.
- Secondly, write down the confidence level of 95% in cell D10.
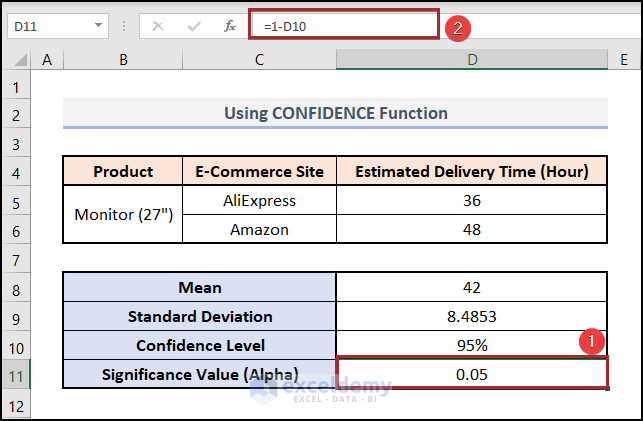
- Thirdly, select cell D11 and paste the following formula.
=1-D10
Here, D10 serves as the cell reference of the confidence level of 95%. Basically, we get the value of Alpha by subtracting the confidence level from 1.
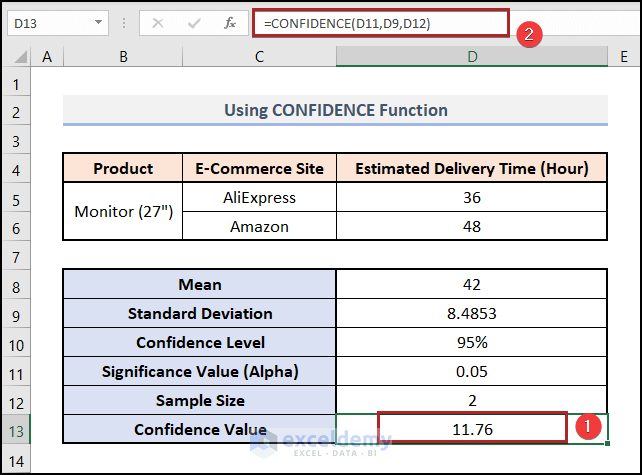
- At this moment, we’re working on getting the Confidence Value.
- For this purpose, go to cell D13 and put in the following formula.
=CONFIDENCE(D11,D9,D12)
- Subsequently, press ENTER.
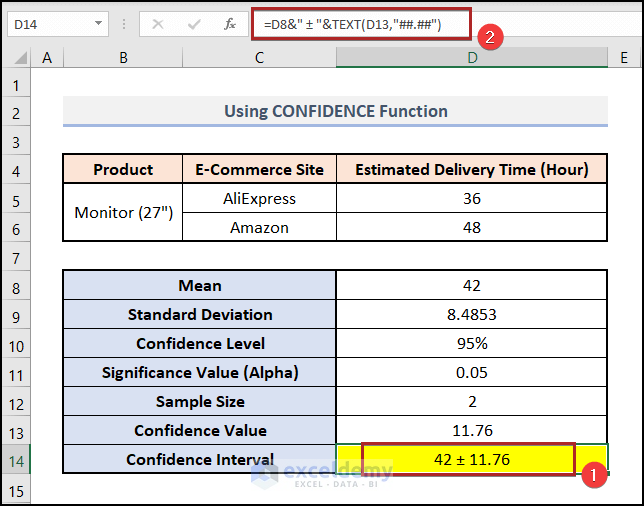
- Then, get the Confidence Interval just like Method 1.
Read More: How to Calculate 90 Percent Confidence Interval in Excel
3. Utilizing Data Analysis ToolPak
In our last method, we’ll use the Data Analysis tool. To show this method, we need to enable the Analysis ToolPak from Excel Add-ins. After that, we will be capable of using this tool. This tool will help us to get the much-needed result utilizing this dataset. So, follow the steps carefully.
📌 Steps:
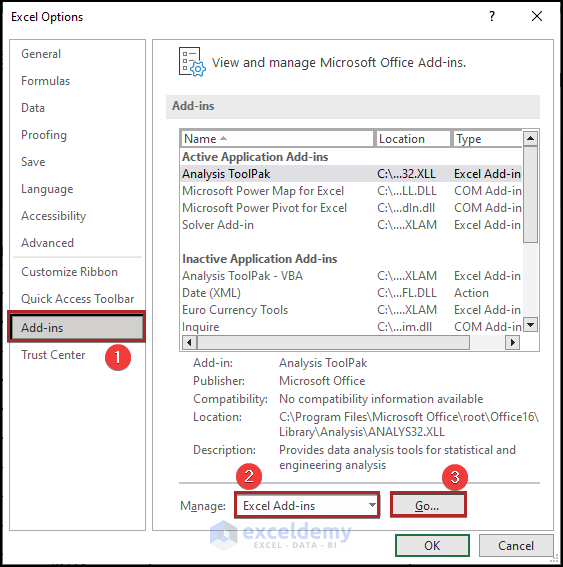
- First of all, proceed to the File tab.

- Then, select Options from the menu.

- Immediately, the Excel Options window pops up.
- Here, go to the Add-ins tab.
- Then, we can find the Manage drop-down list.
- From there, select Excel Add-ins.
- After that, click on Go.
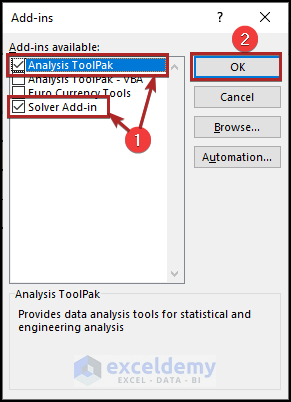
- Instantly, the Add-ins dialog box opens.
- Subsequently, check the boxes of Analysis ToolPak and Solver Add-in.
- Later, click OK.
- Next, return the worksheet Data Analysis.
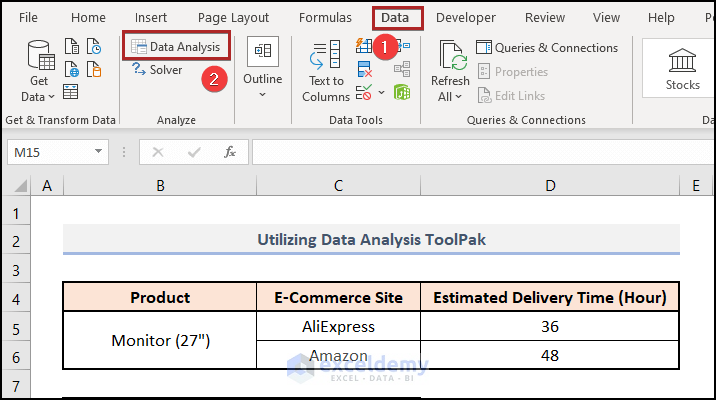
- Then, jump to the Data tab.
- Following this, select the Data Analysis tool in the Analyze group.
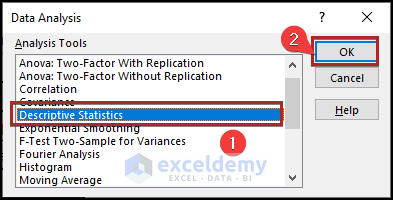
- Suddenly, it opens the Data Analysis dialog box.
- Here, select Descriptive Statistics.
- As always, click OK.
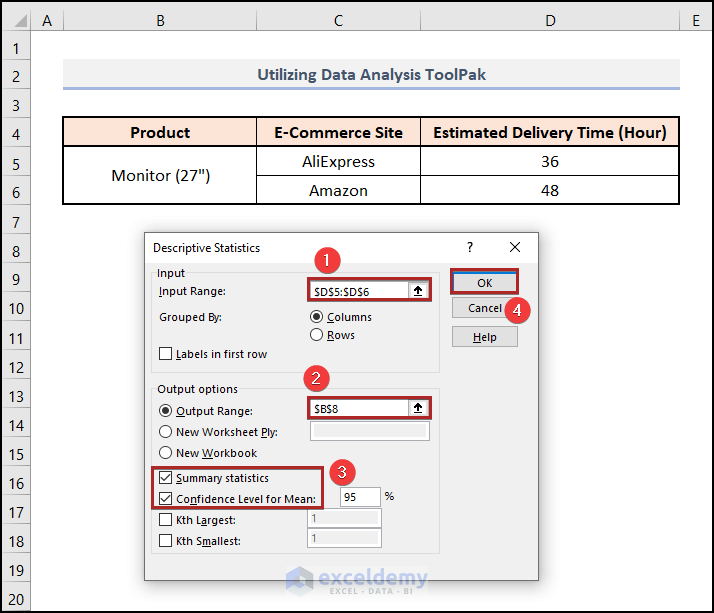
- Presently, the Descriptive Statistics Wizard is appearing on display.
- Now, put the cell reference D5:D6 in the Input Range box under the Input options.
- Therefore, give cell reference cell B8 in the Output Range box under the Output options.
- After that, tick the boxes of Summary statistics and Confidence Level for Mean.
- Lastly, click OK.
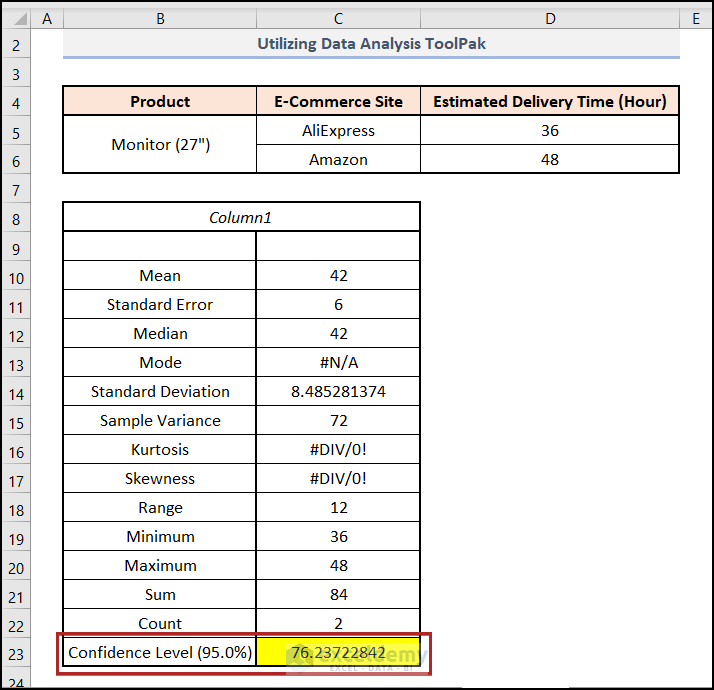
- As a result, we will get the following summary, where the Data Analysis tool calculates the confidence value. Just see the screenshot below.
How to Find the Upper and Lower Limits of a Confidence Interval in Excel
In this section, we’ll find the upper and lower limits of the confidence interval using the dataset above. It’s simple & easy, just follow along.
📌 Steps:
- Initially, calculate the Confidence Value and Confidence Interval just like Method 2.
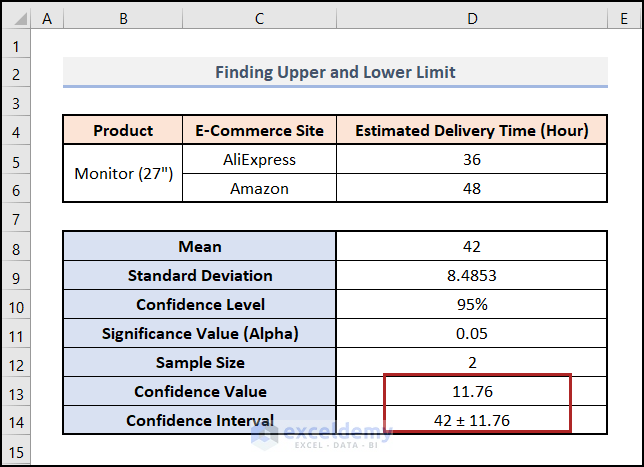
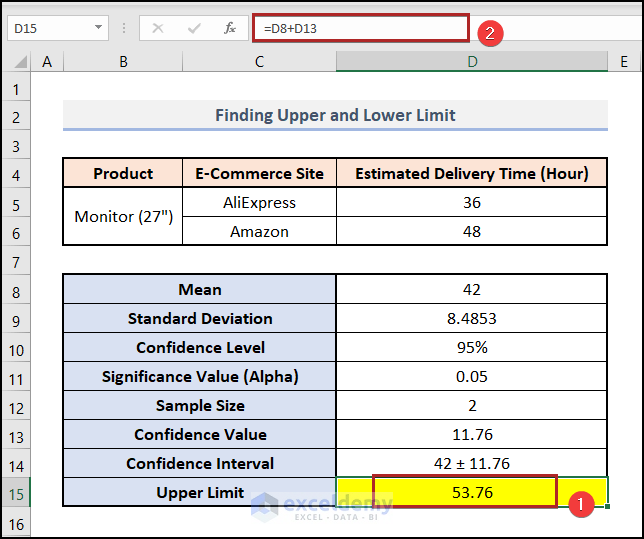
- To determine the Upper Limit, add the confidence value with the mean value.
- For this purpose, select cell D15 and enter the following formula into that cell.
=D8+D13
- Thus, press ENTER.
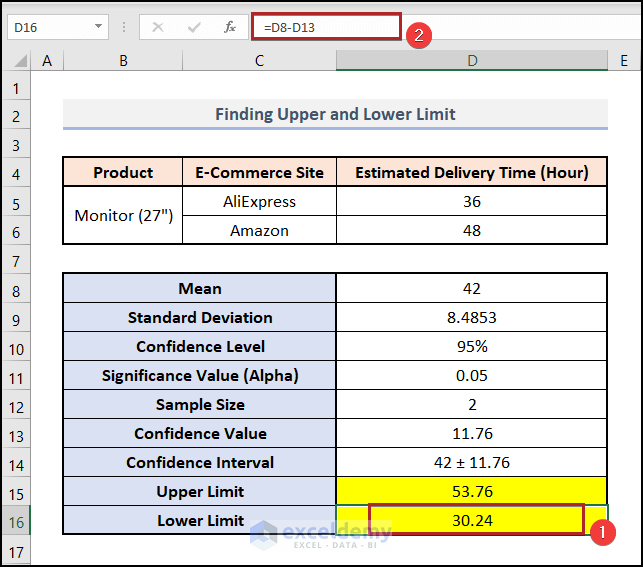
- Simply, subtract the confidence value from the mean value to calculate the Lower Limit. The formula to use in Excel is the following.
=D8-D13
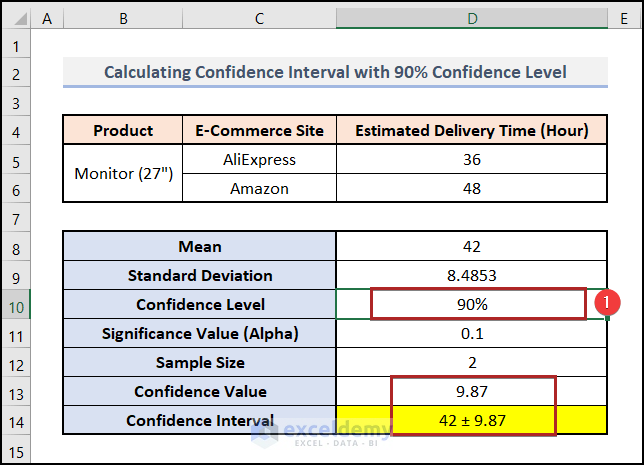
How to Calculate 90% or 95% Confidence Interval in Excel
In our previous 3 methods, we found the confidence interval for confidence level of 95%. Here in this section, we’ll do the same task for the 90% confidence level. So, let’s see the process below.
📌 Steps:
- Just go to Method 2 and change the Confidence Level to 90%.
- Other calculations will be done automatically, and Excel will give the desired result in a blink of an eye.
Also, you can follow the Calculating 90% Confidence Interval in Excel article to explore the same task extensively.
Practice Section
To practice by yourself, we have provided a Practice section like below in each sheet on the right side. Please do it by yourself.
You may download the following Excel workbook for better understanding and practice yourself.
Conclusion
This article provides easy and brief solutions to find the confidence interval in Excel for two samples. Don’t forget to download the Practice file. Thank you for reading this article, we hope this was helpful. Please let us know in the comment section if you have any queries or suggestions.
Related Articles
- How to Make a Confidence Interval Graph in Excel
- How to Calculate 99 Confidence Interval in Excel
- Linear Regression Confidence Interval in Excel
- Calculate Forecast Confidence Interval in Excel
- How to Calculate Confidence Interval for Slope in Excel
<< Go Back to Confidence Interval Excel | Excel for Statistics | Learn Excel
Get FREE Advanced Excel Exercises with Solutions!
