Excel is extremely powerful for analyzing data and handling large datasets. Sometimes, statistical calculations are necessary for interpreting a large dataset. Excel is one of the best tools to calculate mean, standard deviation, confidence interval, etc. In this article, I will show you step-by-step guidelines to calculate a 90 percent confidence interval in Excel.
CONFIDENCE Function in Excel: Syntax
The CONFIDENCE function is an Excel function that will help you to find specific data points centering around the mean of a dataset. To use this function, you will need the standard deviation of the dataset, the significance level, and the sample size of your dataset.

Arguments:
This function has mainly 3 arguments. Such as:
alpha: This is the significance level to which you want to calculate the confidence interval.
standard_dev: This is the standard deviation of your dataset.
size: This is the sample size of your dataset.
What Does 90% Confidence Interval Mean?
To put it in one word, a 90 confidence interval will show you the values around 90% center of the mean value of your dataset.
Say, you have a mean value of 60 for your dataset. Now, you calculated the confidence value of your dataset as 5 using the significance level as 0.1 for a 90 percent confidence interval. Then, the confidence interval result at 90 confidence interval for this whole scenario will be 55-65.
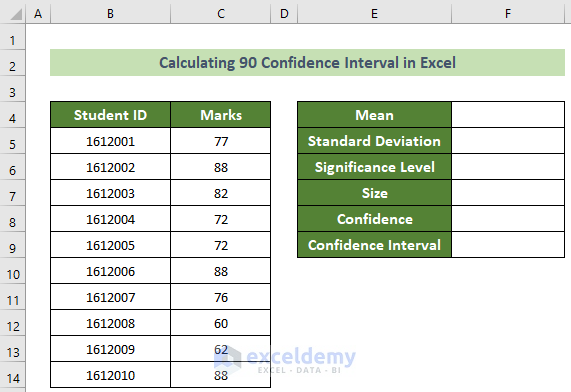
Say, you have a dataset containing 10 students’ Ids and their respective marks. Now, you want to calculate the 90 percent confidence interval of this dataset. You can follow the step-by-step guidelines easily to accomplish your desired result.
We have used the Office 365 version of Microsoft Excel here. But, no worries! You can easily apply these steps in any version of Microsoft Excel according to your availability. If you face any problems regarding versions, please feel free to comment below.
📌 Step 1: Calculating Mean Value
First and foremost, you need to calculate the mean value of your dataset by using the AVERAGE function.
- To do this, select the F4 cell first.
- Now, insert the following formula in the formula bar.
=AVERAGE(C5:C14)- Subsequently, hit the Enter button.

Thus, you will find the mean mark of the students’ marks.
📌 Step 2: Calculation of Standard Deviation
Next, you will need to know the standard deviation of the dataset by using the STDEV.P function.
- In order to do this, click on the F5 cell.
- Afterward, insert the following formula and press the Enter button.
=STDEV.P(C5:C14)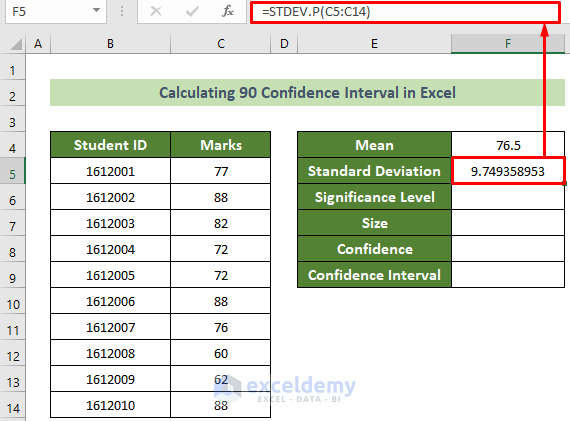
Consequently, you will get the standard deviation of your dataset.
📌 Step 3: Using Excel CONFIDENCE Function to Calculate Confidence Value
At this time, you will need to calculate the confidence value of the dataset according to the desired significance level.
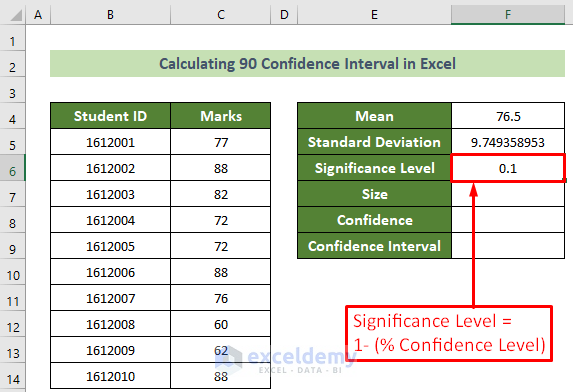
- In doing this, at the very beginning, click on the F6 cell and put the significance level value.
- The significance level is calculated as 1- (% of the confidence level). As you need a 90 percent confidence interval, write 0.1 in the F6 cell and press the Enter button.
- Now, click on the F7 cell and put 10 as the cell value.

- Afterward, click on the F8 cell and insert the following formula.
=CONFIDENCE(F6,F5,F7)- Subsequently, hit the Enter button.
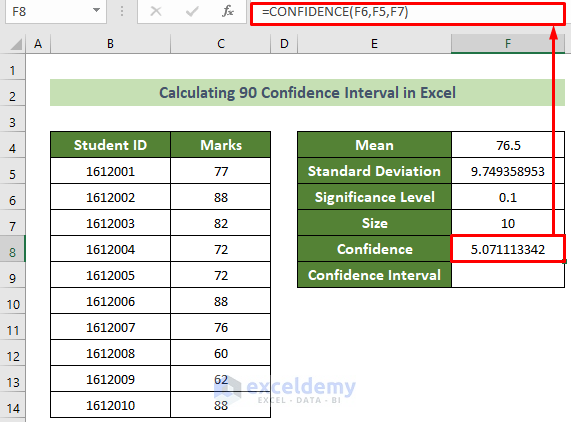
Thus, you have found the confidence function value for the 90 percent confidence interval.
📌 Step 4: Finding 90 Percent Confidence Interval in Excel
Finally, you need to calculate the 90 percent confidence interval by concatenating two cells and using the TEXT function.
- To do this, click on the F9 cell.
- Subsequently, insert the following formula and press the Enter button.
=F4&" ± "&TEXT(F8,"##,##.##")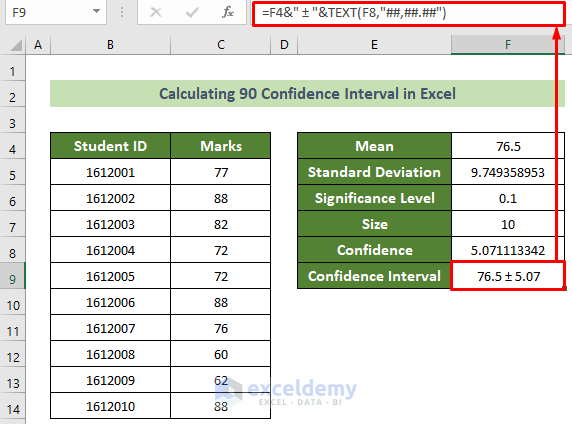
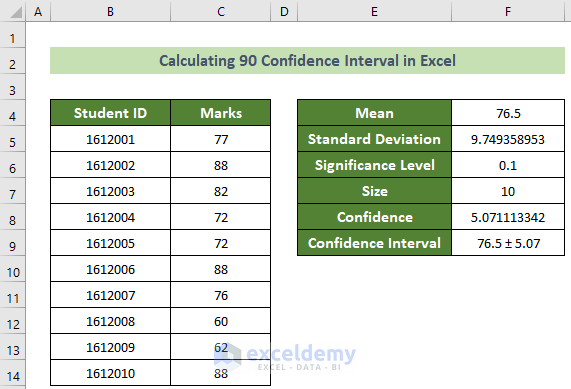
Thus, the 90 percent confidence interval in Excel is calculated successfully. And, for example, the whole result sheet would look like this now.
Read More: How to Calculate 99 Confidence Interval in Excel
💬 Things to Remember
- When finding the standard deviation, you may encounter two similar functions named STDEV.P and STDEVPA.Use the STDEV.P function here as it ignores the non-numerical data.
- In Excel 2010, you will find the CONFIDENCE function as CONFIDENCE.NORM function.
- The value of the alpha argument inside the CONFIDENCE function can not be less than or equal to 0. Else, it would show #NUM! error.
- The standard_dev argument has to be greater than zero to avoid the #NUM! error.
- The size argument must be greater than one to avoid the #NUM! error.
- If the size argument is not an integer, it would be truncated.
- The CONFIDENCE function will show #VALUE! Error, if any argument is non-numeric.
Download Practice Workbook
You can download our practice workbook from here for free!
Conclusion
In a nutshell, in this article, I have shown you step-by-step guidelines to calculate 90 percent confidence interval in Excel. I suggest you read the full article carefully and practice accordingly. I hope you find this article helpful and informative.
Moreover, you are very welcome to comment here if you have any further questions or recommendations.
Thank you!
Related Articles
- How to Make a Confidence Interval Graph in Excel
- How to Find Confidence Interval in Excel for Two Samples
- Linear Regression Confidence Interval in Excel
- Calculate Forecast Confidence Interval in Excel
- How to Calculate Confidence Interval for Slope in Excel
- How to Calculate Confidence Interval in Excel
- How to Calculate 95 Percent Confidence Interval in Excel
- How to Find Upper and Lower Limits of Confidence Interval in Excel
<< Go Back to Confidence Interval Excel | Excel for Statistics | Learn Excel
Get FREE Advanced Excel Exercises with Solutions!
