When you want to do research with a large number of people, it is impossible to take all people individually at a time. That’s why we can take a small number of people and believe that it represents the entire population. In that case, the calculation of the confidence interval can take into account. This article will show how to calculate the confidence interval in Excel in some effective ways. I hope you find this article informative and gain lots of knowledge.
What Is Confidence Interval?
The confidence interval determines the probability of lying a mean value in a range of values. It measures the degree of certainty and uncertainty in a sample. There are upper confidence levels and lower confidence levels. If the interval is narrow, that means the prediction is more accurate.
The confidence interval may calculate using the standard error. The lower the error the better prediction may take place. If we take a larger sample, it will provide far more accurate results. For example, we would like to make an app for a large population. You can’t take feedback from all of them. In that case, we need to take some people and their opinions. These opinions can be used to make the app better. The confidence interval can deal with the situation and gives us a range through which we can identify which people of which age are satisfied with the app. We can deliver the app to those certain people who can give their feedback after using it. Finally, we can assume the overall scenario of the population.
The major advantage of the confidence interval is that it is not time-consuming just like hypothesis testing. And it is far easier to interpret. To calculate the confidence interval, we can use the following formula.

Here, CI = Confidence Interval for Infinite Population
Zc = Z Value for Confidence Level
S = Sample Standard Deviation
n = Number of Elements in a Sample
How to Estimate Confidence Interval Mathematically?
To estimate the confidence interval, you need to find several more items. After that, you can easily calculate the confidence interval. Let’s assume, we have a shoe store. Where you want to buy some shoes wholesale and sell them to the customer. But as we know, shoe size is important. But it is impossible to take the size of the whole population. In that case, we take a sample where we have the sizes of different categories of people. It will give us a final overview of the whole population.
Step 1: Selection of Sample group
First, we need select or choose the sample group for calculation. Let’s say we have a dataset of shoes that includes 7, 7.5 , 8, 8.5, 9, 9.5 ,10, 10.5, 11,11.5, 12, 12.5, 13, 13.5, 14, 14.5, 15.
Step 2: Calculate Mean Value
At first, you need to calculate the mean of the given shoe size. Here, we use the average formula to calculate the mean value from the sample group.

Step 3: Calculate Standard Deviation
To calculate the standard deviation, we need to have the mean value which we calculated in the first place. So, the standard deviation is

Step 4: Choose Confidence level
Most of cases, people use a 95% confidence level. Using this, we will calculate the Significance Value which is known as alpha by subtracting it from 1.
Step 5: Find Z value
For a 95% confidence level, the z value will be 1.96. It may vary with the confidence level. In that case, you have to utilize the Z score chart.
Step 6: Calculate Confidence Interval
As we have a standard deviation, z value, and the number of elements in a sample, now, we can calculate the confidence value.

Step 7: Add or Subtract Confidence Value with Mean Value
Finally, to get the lower and upper confidence interval, we need to utilize the mean and confidence value. For the upper confidence interval, you need to add the mean and the confidence value. Whereas, for the lower confidence interval, you need to subtract the confidence value from the mean.
How to Calculate Confidence Interval in Excel: 4 Suitable Methods
To calculate the confidence interval in Excel, we have found 4 different and effective methods through which you can have complete knowledge. In this article, we utilize several Excel functions and also use the data analysis tool. All of these methods are very effective and user-friendly. To have a better understanding, follow the methods carefully.
1. Applying Conventional Formula
Our first method is based on using the conventional formula. In this method, we would like to use the basic formula of the confidence interval and get the required result. To do this, we need to calculate the standard deviation, z value, and the number of elements in a sample. To show this method, we take people and their weight in pounds. Follow the steps carefully.

Steps
- First, we need to calculate the mean value of the sample using the AVERAGE function.
- To do this, select cell F4.
- Then, write down the following formula.
=AVERAGE(C5:C12)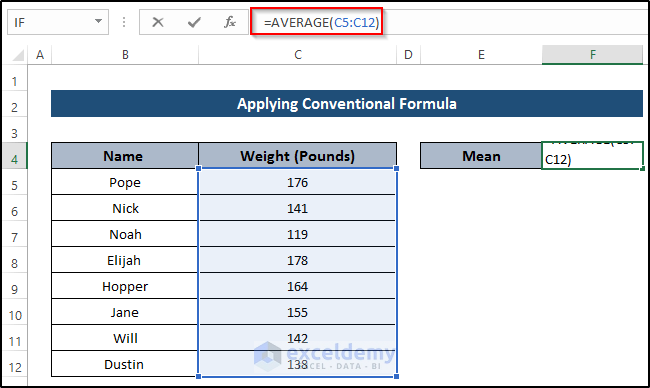
- Press Enter to apply the formula.

- Then, we have to calculate the standard deviation using the STDEV.S function.
- First, select cell F5.
- Then, write down the following formula.
=STDEV.S(C5:C12)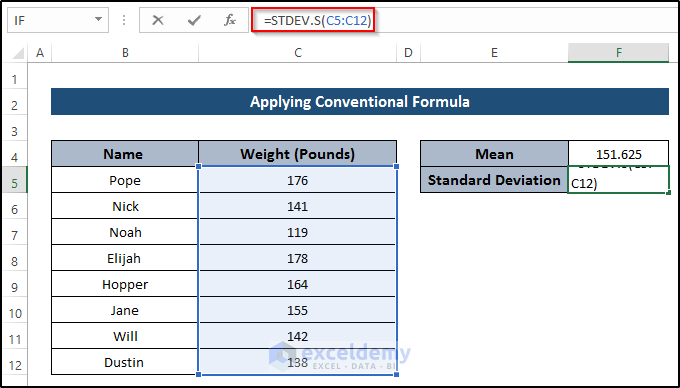
- Press Enter to apply the formula.

- Next, you need to find out the z value for the confidence level. For a 95% confidence level, the z value is 96. If you have another confidence level, then, you need to find it using the z value chart.
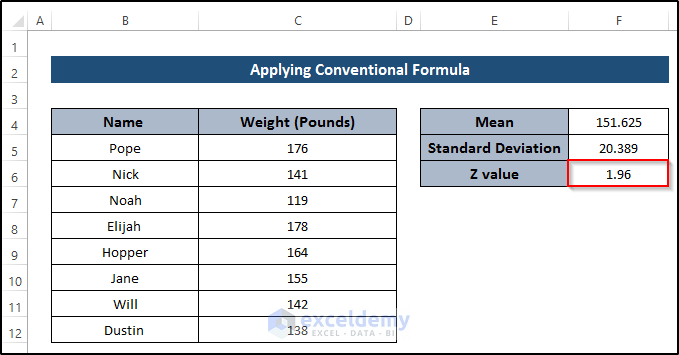
- After that, write down the total sample size. Here, we take a total of eight sample sizes.

- Then, we will turn our focus to calculating the confidence value using the conventional formula.
- To do this, select cell F8.
- Then, write down the following formula.
=F6*(F5/SQRT(F7))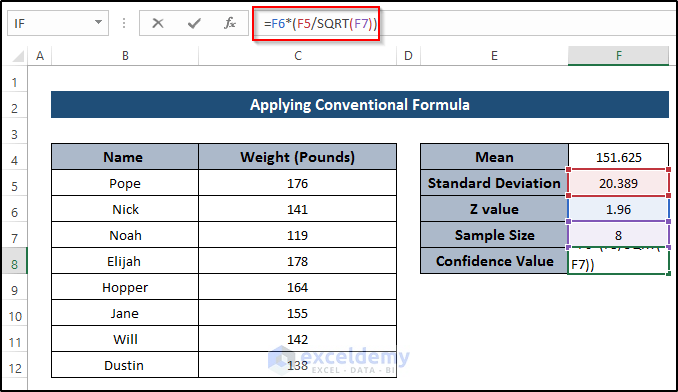
- Press Enter to apply the formula.

- Then, to get the confidence interval value, we have to add or subtract the confidence value from the mean value. To get the upper confidence interval, add the confidence value with the mean value and subtract the confidence value from the mean value to calculate the lower confidence value.

Read More: How to Calculate 95 Percent Confidence Interval in Excel
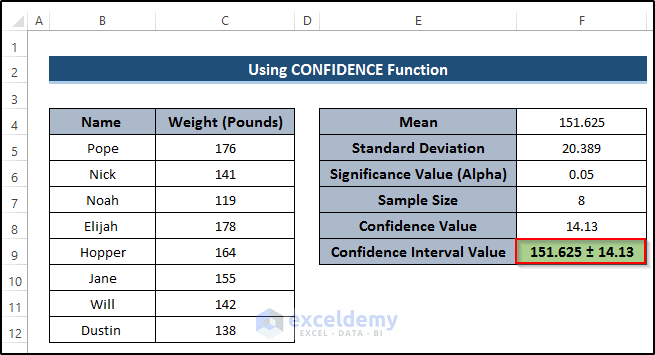
2. Using CONFIDENCE Function
Our next method is based on using the CONFIDENCE function. In this method, we will calculate the mean, standard deviation, and alpha to get the desired confidence value. To understand the method properly, follow the steps
Steps
- First, we need to calculate the mean value of the sample using the AVERAGE function.
- To do this, select cell F4.
- Then, write down the following formula.
=AVERAGE(C5:C12)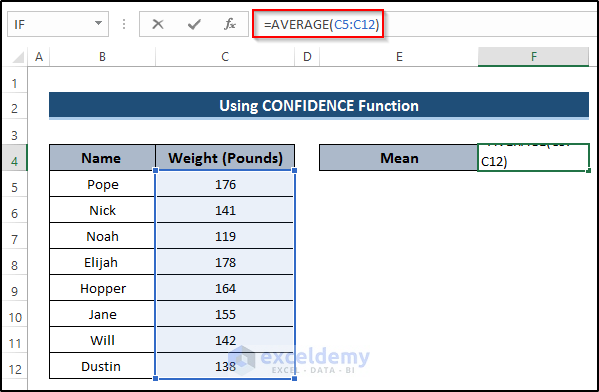
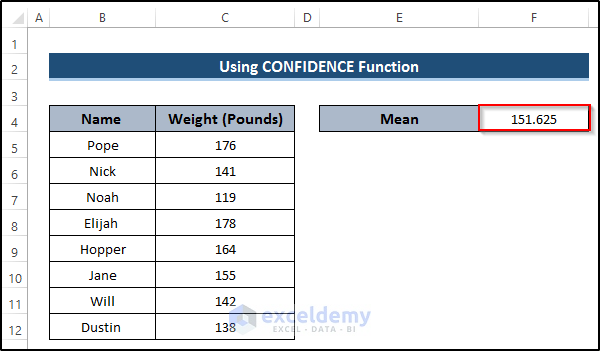
- Press Enter to apply the formula.
- Then, we have to calculate the standard deviation using the STDEV.S function.
- First, select cell F5.
- Then, write down the following formula.
=STDEV.S(C5:C12)
- Press Enter to apply the formula.

- After that, you need to calculate alpha by utilizing the 95% confidence level. To get alpha, we need to subtract a 95% confidence level from 1.
- Select cell F6.
- Then, write down the following formula.
=1-0.95
- Press Enter to apply the formula.

- After that, write down the total sample size. Here, we take a total of eight sample sizes.

- Then, we will turn our focus to calculating the confidence value using the conventional formula.
- To do this, select cell F8.
- Then, write down the following formula.
=CONFIDENCE(F6,F5,F7)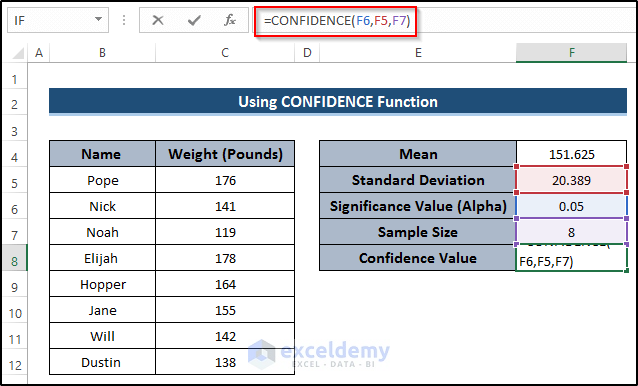
- Press Enter to apply the formula.
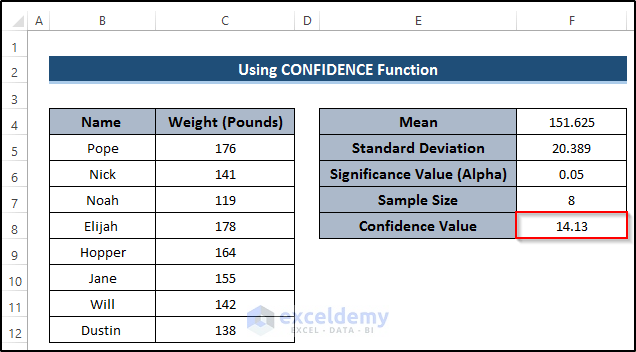
- Then, to get the confidence interval value, we have to add or subtract the confidence value from the mean value. To get the upper confidence interval, add the confidence value with the mean value and subtract the confidence value from the mean value to calculate the lower confidence value.
Read More: How to Calculate 90 Percent Confidence Interval in Excel
3. Utilizing CONFIDENCE.T Function
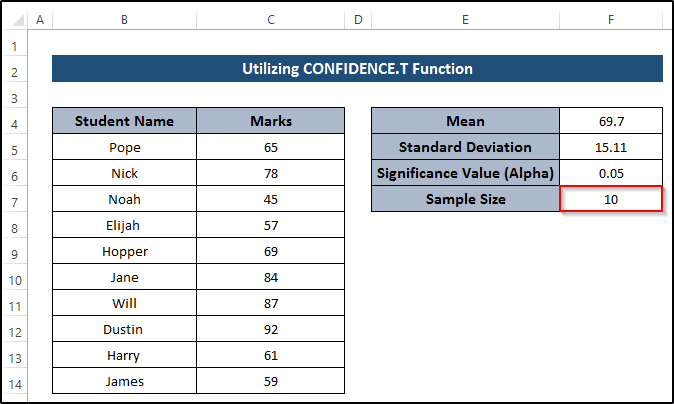
Our third method is based on using the CONFIDENCE.T function. In this method, we will calculate the mean, standard deviation, and alpha to get the desired confidence value using the CONFIDENCE.T function. To show the method, we take a dataset that includes some students and their marks in the exam.

Steps
- First, we need to calculate the mean value of the sample using the AVERAGE function.
- To do this, select cell F4.
- Then, write down the following formula.
=AVERAGE(C5:C14)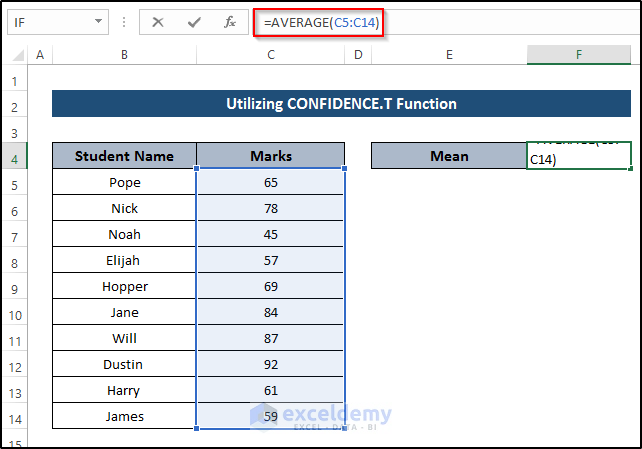
- Press Enter to apply the formula.

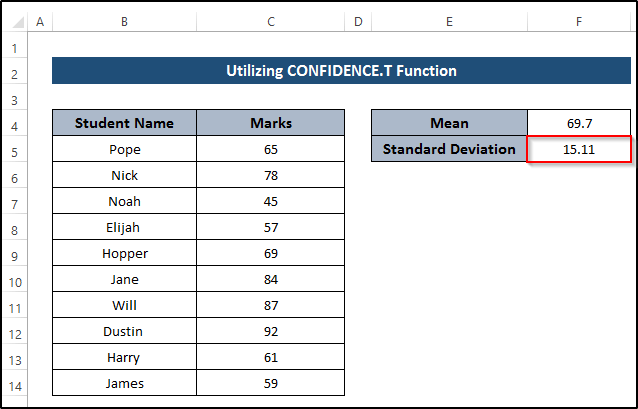
- Then, we have to calculate the standard deviation using the STDEV.S function.
- First, select cell F5.
- Then, write down the following formula.
=STDEV.S(C5:C14)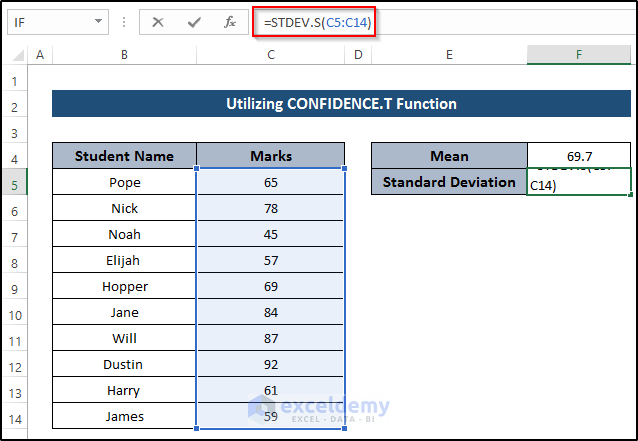
- Press Enter to apply the formula.
- After that, you need to calculate alpha by utilizing the 95% confidence level. To get alpha, we need to subtract a 95% confidence level from 1.
- Select cell F6.
- Then, write down the following formula.
=1-0.95
- Press Enter to apply the formula.

- After that, write down the total sample size. Here, we take a total of ten sample sizes.
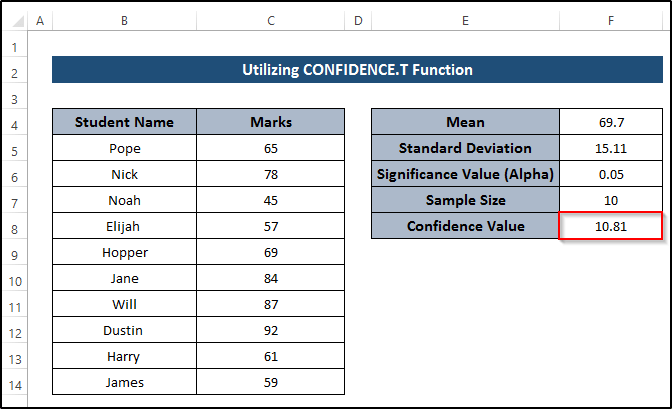
- Then, we will turn our focus to calculating the confidence value using the conventional formula.
- To do this, select cell F8.
- Then, write down the following formula.
=CONFIDENCE.T(F6,F5,F7)
- Press Enter to apply the formula.
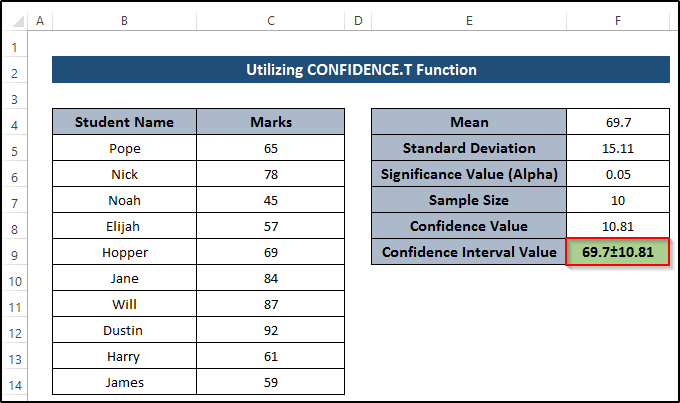
- Then, to get the confidence interval value, we have to add or subtract the confidence value from the mean value. To get the upper confidence interval, add the confidence value with the mean value and subtract the confidence value from the mean value to calculate the lower confidence value.
Read More: How to Find Confidence Interval in Excel for Two Samples
4. Use of Data Analysis Tool
Our last method is based on using the data analysis tool. To show this method, we need to enable the data analysis tool from Excel Add-ins. After that, we will be capable of using this tool. This tool will help us to get the much-needed result utilizing the dataset. Follow the steps carefully.
Steps
- First, we need to enable the data analysis tool using the Excel Add-ins.
- Go to the File tab on the ribbon.
- Then, select the More command.
- After that, select Options from the More command.

- As a result, the Excel Options dialog box will appear.
- Then, select Add-ins.
- After that, select Excel Add-ins from the Manage group.
- Then, click on Go.

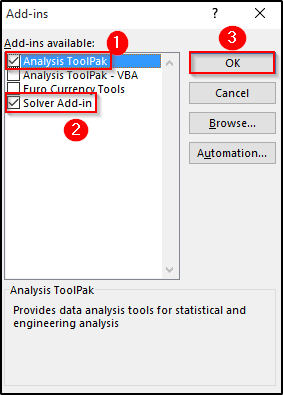
- The Add-ins dialog box will appear.
- Then, select both Analysis Toolpak and Solver Add-ins.
- After that, click on OK.
- As a consequence, you will see the Data Analysis and Solver option under Analyze group.

- To apply the data analysis procedure, go to the Data tab on the ribbon.
- Then, select Data Analysis from Analyze group.

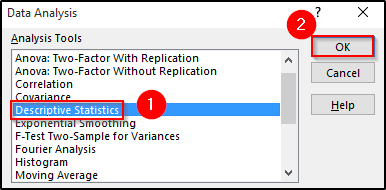
- Then, the Data Analysis dialog box will appear.
- From there, select Descriptive Statistics.
- Then, click on OK.
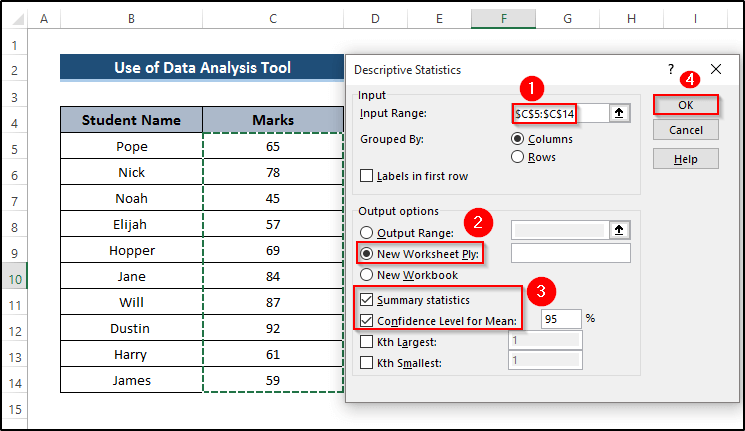
- It will take us to the Descriptive Statistics dialog box.
- Then, select the Input Range from your dataset.
- Set the Output options as New Worksheet Ply.
- Then, check on Summary statistics and Confidence Level for Mean.
- Finally, click on OK.
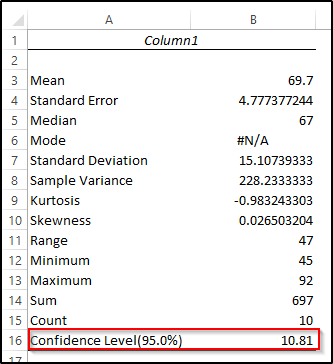
- As a result, we will get the following summary where the data analysis tool calculates the confidence value. See the screenshot.
Read More: How to Make a Confidence Interval Graph in Excel
Things to Remember
- The CONFIDENCE function only takes numeric values. Otherwise, it will show an error.
- In the recent Excel version, the T function takes the place of the CONFIDENCE function.
- The confidence interval is equal to the plus or minus value of the mean value and confidence value in Excel.
Download Practice Workbook
Download the practice workbook below.
Conclusion
We have shown four different methods to calculate the confidence interval in Excel. To calculate the confidence interval, we utilize the conventional method and some Excel functions. All of these methods provide a perfect solution to the problem. If you have any questions, feel free to ask in the comment box.
Related Articles
- How to Find Upper and Lower Limits of Confidence Interval in Excel
- How to Calculate 99 Confidence Interval in Excel
- Linear Regression Confidence Interval in Excel
- Calculate Forecast Confidence Interval in Excel
- How to Calculate Confidence Interval for Slope in Excel
<< Go Back to Confidence Interval Excel | Excel for Statistics | Learn Excel
Get FREE Advanced Excel Exercises with Solutions!
