We can perform many extensive statistical calculations with Excel easily. The confidence interval is one of the most important calculations in statistics. This can be calculated through data and also through the slope of a dataset. In this article, I will show you all the steps to calculate the confidence interval for slope in Excel.
Steps to Calculate Confidence Interval for Slope in Excel
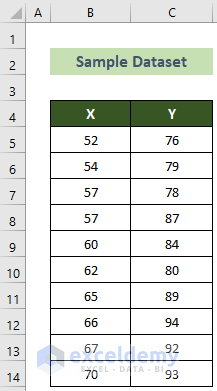
Say, we have a dataset of 10 pairs of x and y values. From these data, we will easily get a slope. And, now we have to calculate the confidence interval for that slope. Follow the step-by-step guidelines below to accomplish your desired result.
📌 Step 1: Calculate Standard Error in Slope
First and foremost, you will need to calculate the standard error in slope to calculate the confidence interval for slope in Excel.
- To do this, click on cell F5 and insert the SLOPE function formula below.
=SLOPE(C5:C14,B5:B14)- Subsequently, press the Enter key.

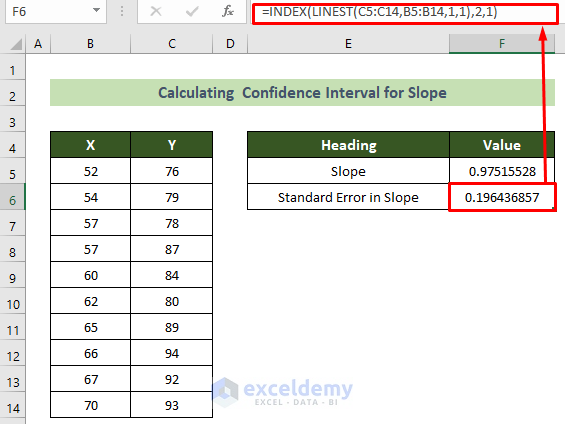
- Now, you will need to calculate the standard error for slope using the INDEX and LINEST functions.
- In order to do this, click on cell F6 and insert the following formula.
=INDEX(LINEST(C5:C14,B5:B14,1,1),2,1)- Subsequently, hit the Enter key.
Read More: How to Calculate Confidence Interval in Excel
📌 Step 2: Calculate the Multiplier T Value
Now, you will need to calculate the multiplier, T value for calculating the confidence interval for the slope.
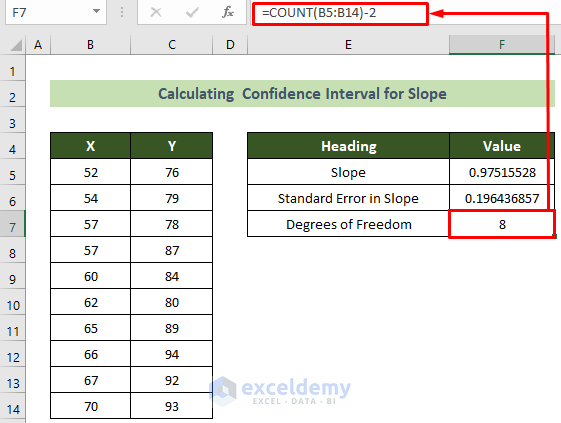
- To do this, first, click on cell F7 and insert the following formula which includes the COUNT function to find the degrees of freedom.
=COUNT(B5:B14)-2- Subsequently, hit the Enter key.
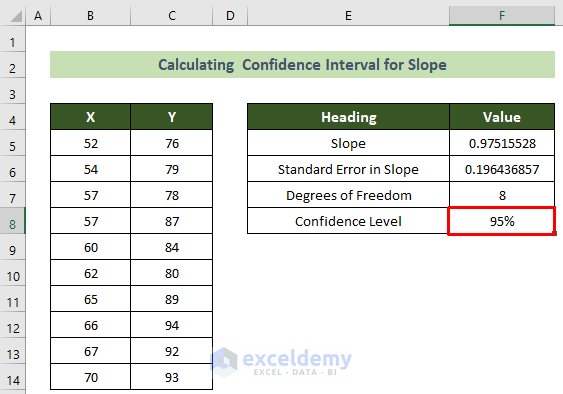
- Afterward, click on cell C8 and insert your desired confidence level.
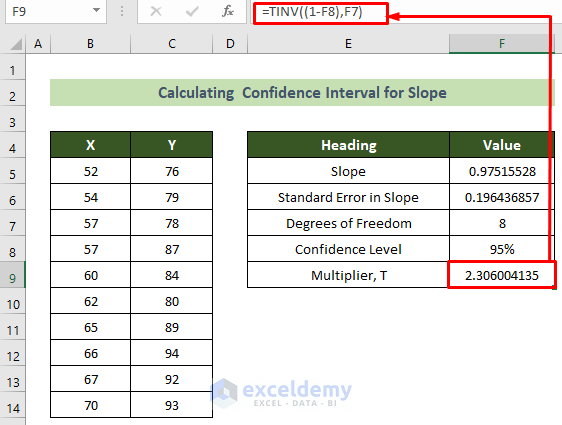
- Now, you have to use the TINV function to calculate the multiplier, T.
- To do this, click on cell F9 and insert the formula below.
=TINV((1-F8),F7)- Subsequently, press the Enter key.
Read More: How to Calculate 90 Percent Confidence Interval in Excel
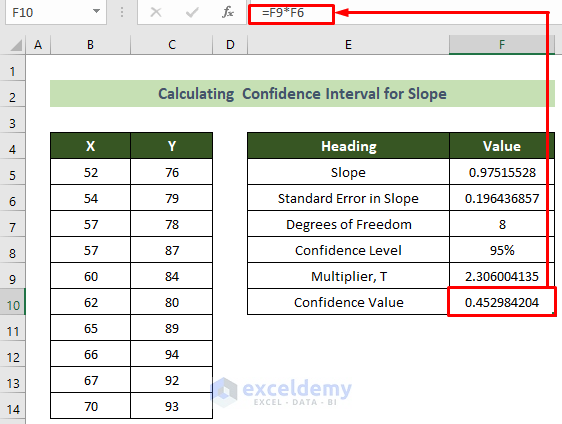
📌 Step 3: Calculate Confidence Interval for Following Slope
Last but not least, you will have to now calculate the confidence interval.
- For doing this, click on cell F10 and insert the formula below.
=F9*F6- Subsequently, press the Enter key.
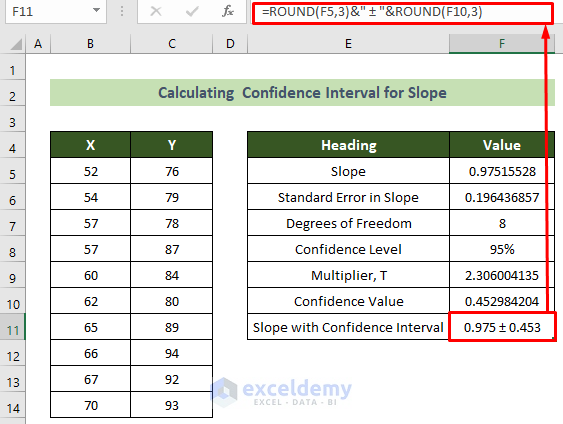
- Now, to get the slope with the confidence interval, click on cell F11 and insert the formula below including the ROUND function.
=ROUND(F5,3)&" ± "&ROUND(F10,3)- Subsequently, press the Enter key.
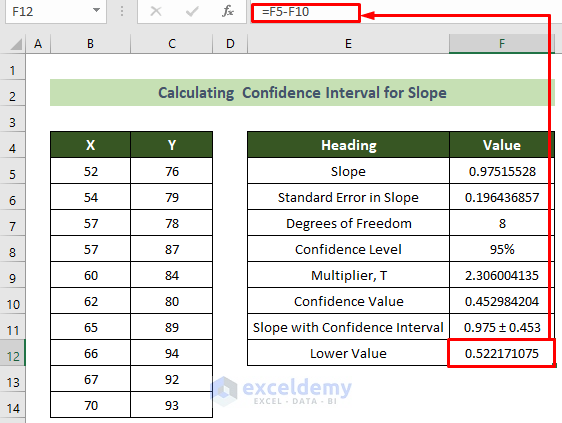
- Afterward, to get the lower slope value with the confidence interval, click on cell F12 and insert the formula below.
=F5-F10- Subsequently, hit the Enter key.
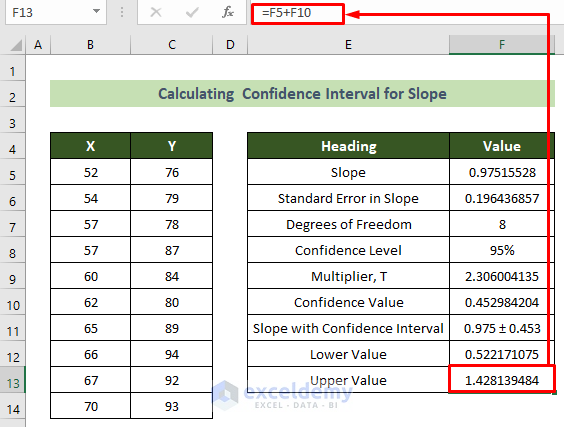
- Similarly, to get the upper slope value, click on cell F13 and insert the formula below.
=F5+F10- Subsequently, press the Enter key.
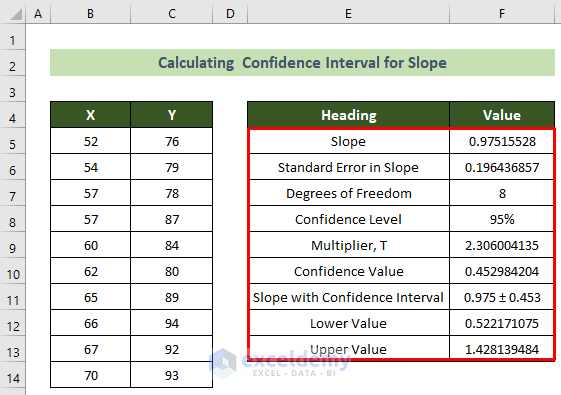
Thus, your whole calculation is done now. And, the final outcome would look like this.
Read More: How to Calculate 95 Percent Confidence Interval in Excel
How to Find Confidence Interval for Two Samples in Excel
Sometimes, it might happen that you have two sample values for something. And, now you will have to find the confidence interval from these values.
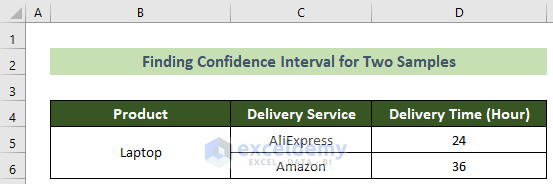
Say, you are given data on delivery time for two delivery service companies. Now, you need to calculate the confidence interval for these values. You can use the CONFIDENCE function to accomplish this. Follow the steps below to achieve this result.
📌 Steps:
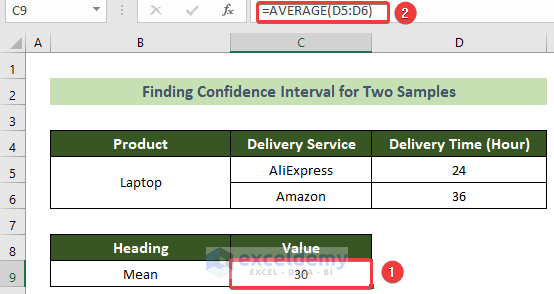
- First and foremost, click on cell C9 and insert the following formula including the AVERAGE function to get the mean.
=AVERAGE(D5:D6)- Following, hit the Enter key.
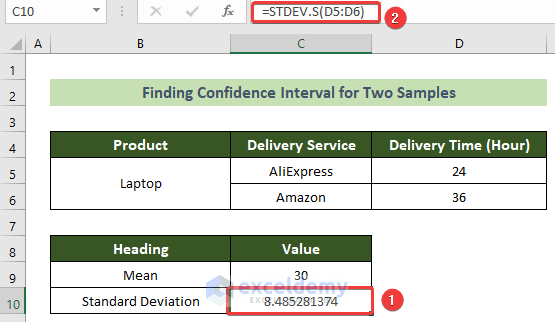
- Now, to get the standard deviation, you have to use the STDEV.S function.
- To accomplish this, click on cell C10 and insert the following formula.
=STDEV.S(D5:D6)- Subsequently, hit the Enter key.
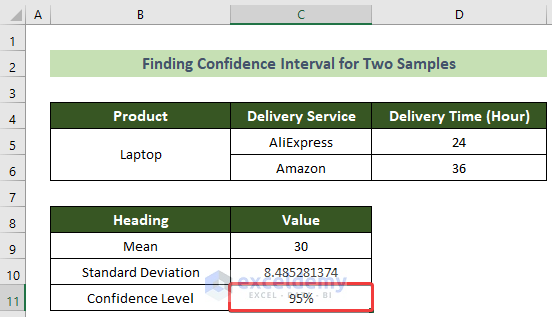
- Afterward, click on cell C11 and insert your desired confidence level.
- Afterward, click on cell C12 and insert the formula to find the significance level (Alpha).
=1-C11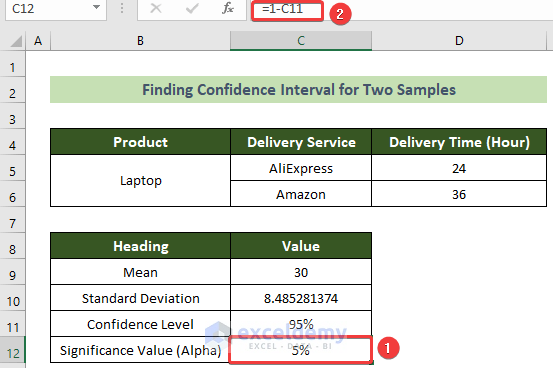
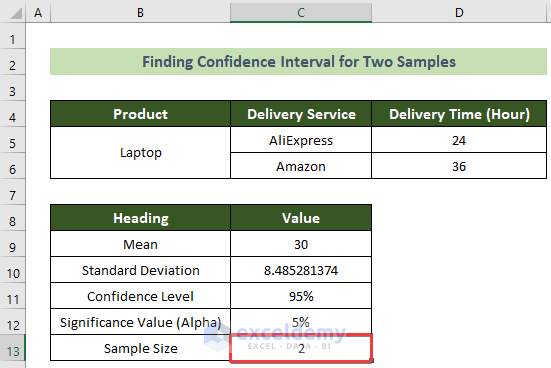
- At this time, click on cell C13 and insert the sample size.
- Now, click on cell C14 and insert the following formula with CONFIDENCE.NORM function and press the Enter key.
=CONFIDENCE.NORM(C12,C10,C13)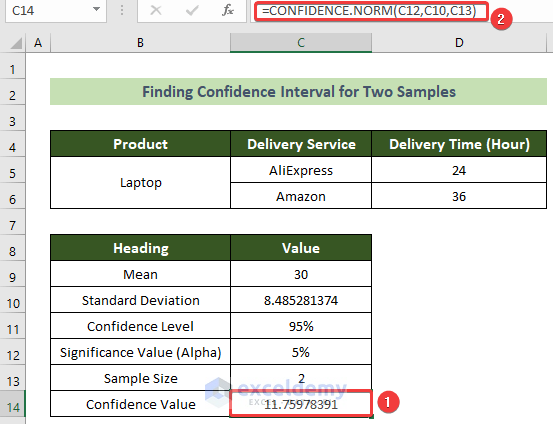
- Now, click on cell C15 and insert the following formula with the TEXT function to get your final outcome of mean with confidence interval.
=C9&" ± "&TEXT(C14,"##.##")- Subsequently, hit the Enter key.
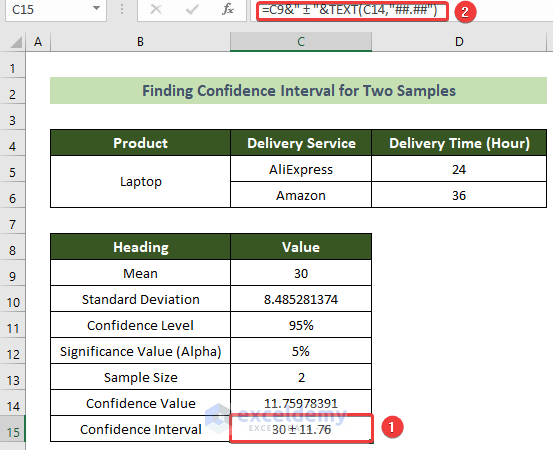
As a result, you will get the whole output you desired. And, the outcome should look like this.

Read More: How to Calculate 99 Confidence Interval in Excel
Download Practice Workbook
You can download our practice workbook from here for free!
Conclusion
So, in this article, I have shown you all the steps to calculate the confidence interval for slope in Excel. You can also download our free workbook to practice. I hope you find this article helpful and informative. If you have any further queries or recommendations, please feel free to comment here.
Have a nice day! Thank you!
Related Articles
- How to Find Confidence Interval in Excel for Two Samples
- Linear Regression Confidence Interval in Excel
- Calculate Forecast Confidence Interval in Excel
- How to Make a Confidence Interval Graph in Excel
- How to Find Upper and Lower Limits of Confidence Interval in Excel
<< Go Back to Confidence Interval Excel | Excel for Statistics | Learn Excel
Get FREE Advanced Excel Exercises with Solutions!
