The Excel SLOPE Function
- Description
The SLOPE function returns the slope of the linear regression line with known y and x data points. The rate of change and the regression line are calculated by dividing the vertical distance by the horizontal distance between any two locations on the line.
- Generic Syntax
SLOPE(known_y’s, known_x’s)
- Argument Description
| ARGUMENT | REQUIREMENT | EXPLANATION |
|---|---|---|
| known_y’s | Required | An array or cell range of numeric dependent data points. |
| known_x’s | Required | The set of independent data points. |
- Returns
returns a numeric value.
Remarks:
This is the SLOPE equation: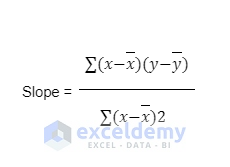
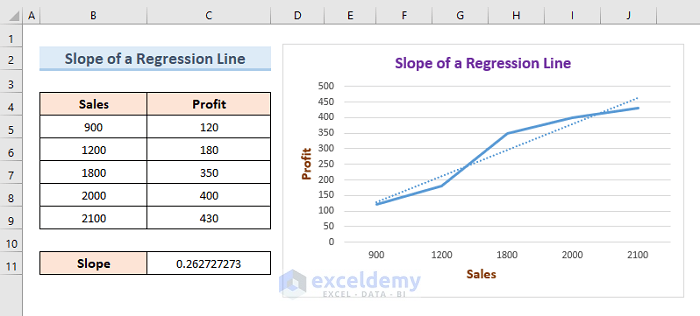
Example 1 – Calculate the Slope of a Regression Line Using Excel SLOPE Function
Calculate the slope in C11:
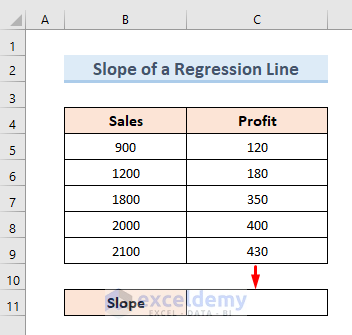
- Select C11.
- Use the following formula.
- Press Enter.
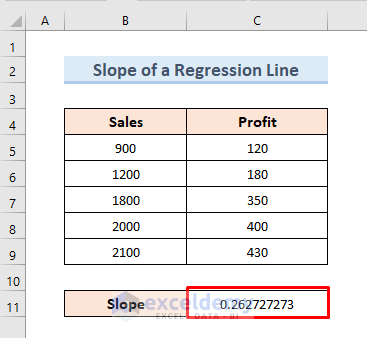
=SLOPE(C5:C9,B5:B9)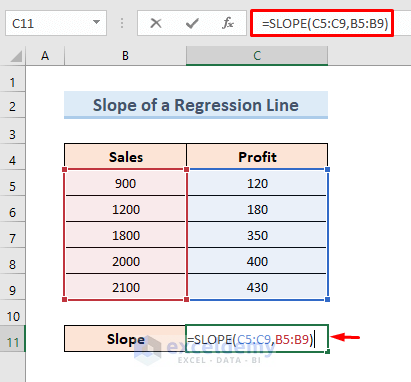
This is the output.
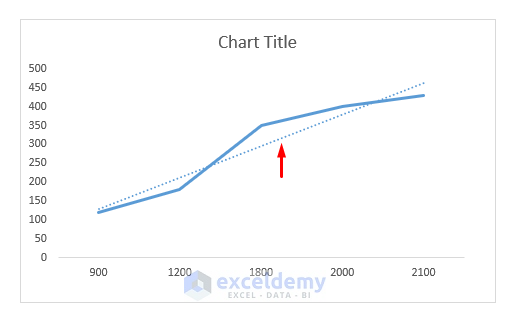
To create a 2D line chart:
- Select C5:C9.
- Go to the Insert tab.
- Select the first option in 2-D line.
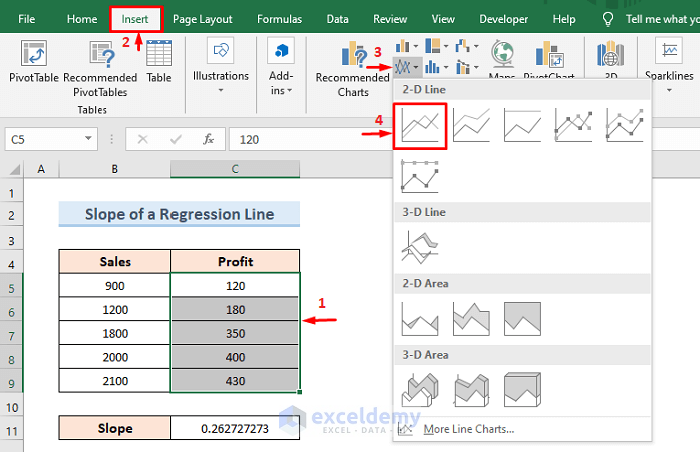
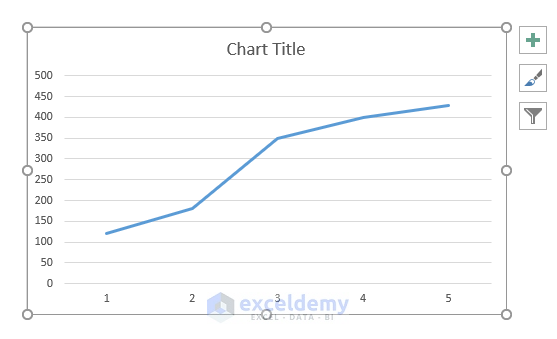
The graph is displayed.
 To see the profit values in the Y-axis and the sales values in the X-axis:
- Right-click the graph and choose “Select Data”.
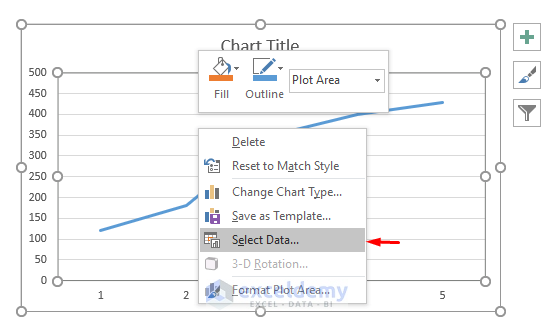
- Select Edit in Horizontal Axis Labels.
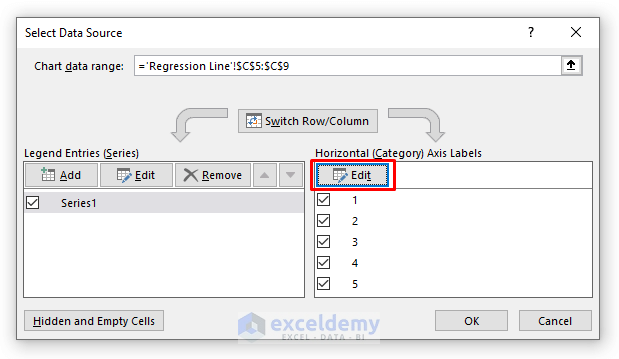
- In Axis label range, enter B5:B9.
- Click OK.
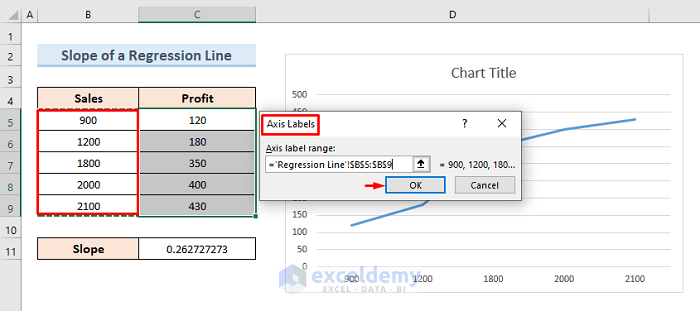
The sales value are displayed in the X-axis.
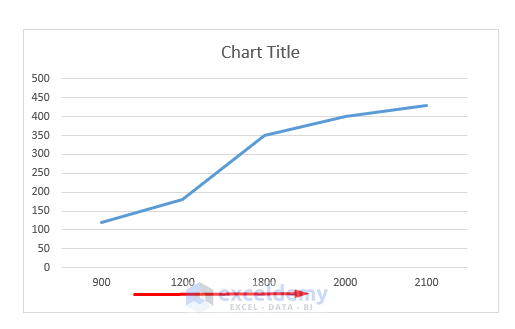
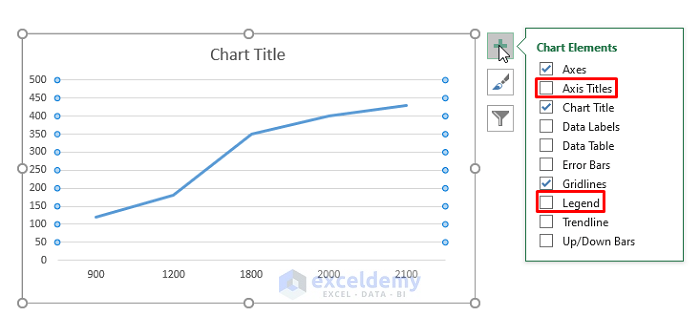
- Enter Axis Titles and Legend names in Chart Elements.
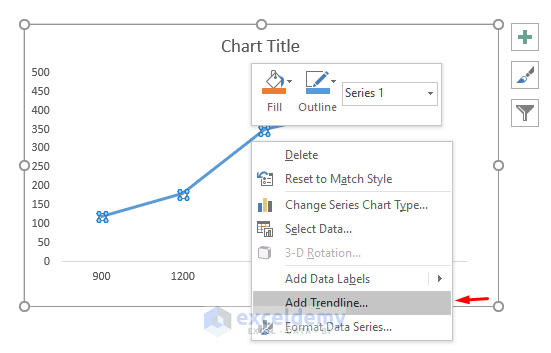
 To insert a trendline:
- Right-click the line of the graph.
- Select Add Trendline.
This is the output.
This is the final output.
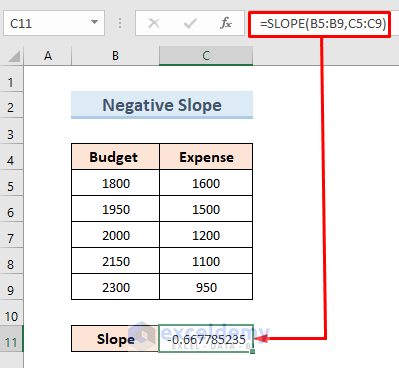
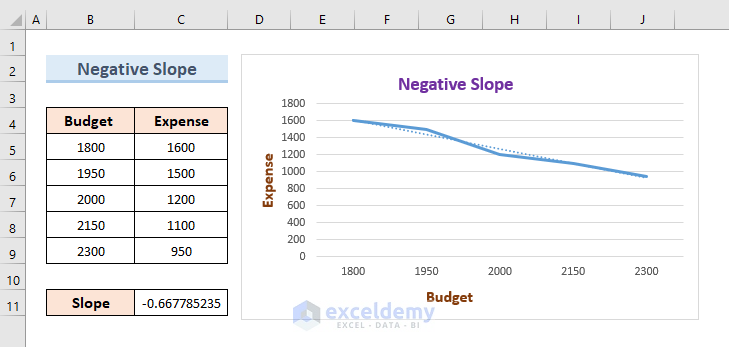
Example 2 – Use the Excel SLOPE Function to Calculate a Negative Slope
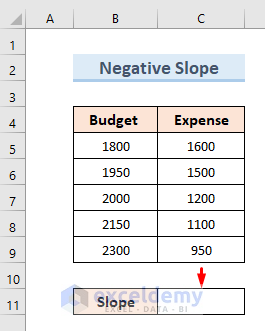
- Select C11.
- Use the following formula.
- Press Enter.
=SLOPE(B5:B9,C5:C9)You will see a negative value in C11.
- Follow the steps described in the previous example to insert a graph:
Read More: How to Find the Slope of a Line in Excel
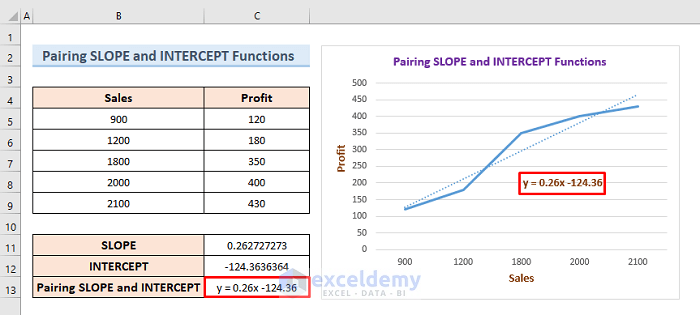
Example 3 – Combining the SLOPE and the INTERCEPT Functions
- Select C12.
- Use the following formula.
- Press Enter.
=INTERCEPT(C5:C9,B5:B9)The intercept value is displayed in C12.
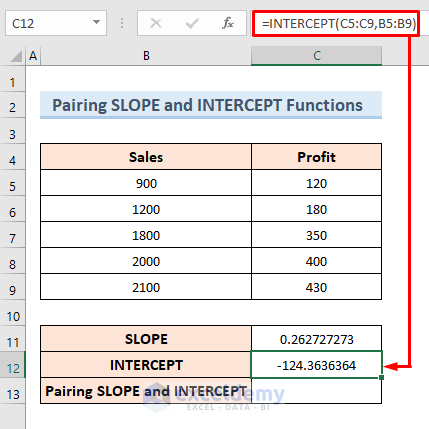
- Use a new equation with the slope value and the intercept part:
Slope = m
Intercept = C
The INTERCEPT function returns the y-axis intersection point using the x-axis and the y-axis values.
Read More: How to Calculate Slope and Intercept in Excel
Example 4 – Using the Excel SLOPE Function as a VBA Function
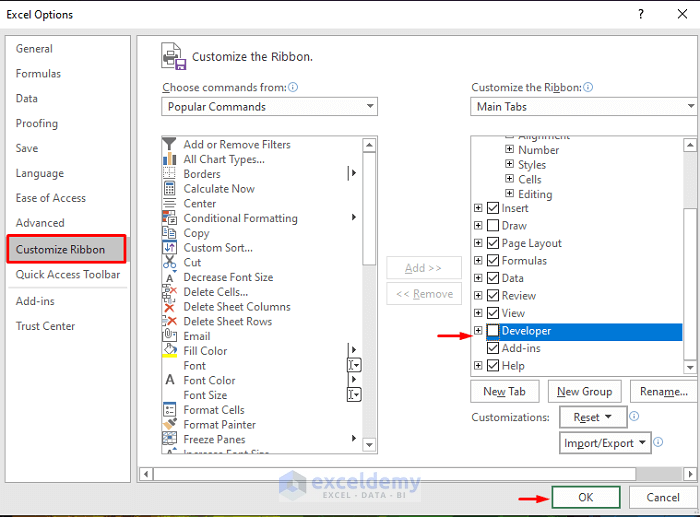
Enable the Developer tab to create macro-enabled content.
- Go to File.
- Select Options.

- Select Customize Ribbon.
- Choose Developer and click OK.
The Developer tab iis displayed on the ribbon.
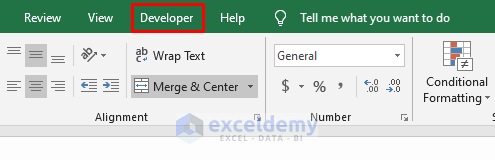
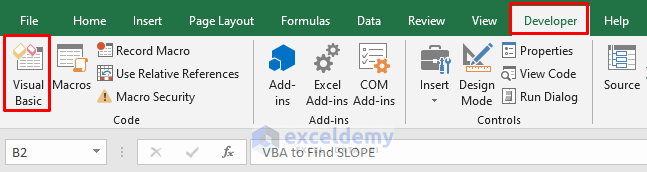
- Go to the Developer tab.
- Select Visual Basic.
- Select Insert.
- Choose Module.
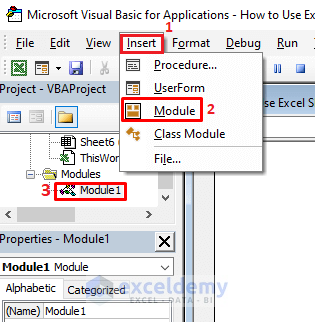
- Select Module-1.
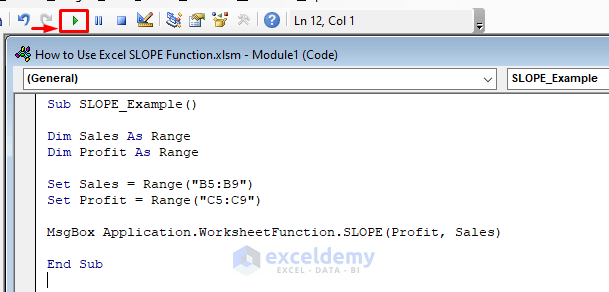
- Enter the following code in the blank window.
Sub SLOPE_Example()
Dim Sales As Range
Dim Profit As Range
Set Sales = Range("B5:B9")
Set Profit = Range("C5:C9")
MsgBox Application.WorksheetFunction.SLOPE(Profit, Sales)
End Sub- Click run or press F5 to run the code.
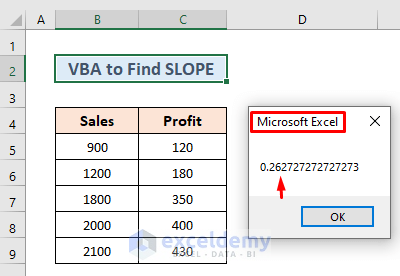
A message box displays the value of the slope.
Read More: How to Find Instantaneous Slope on Excel
Example 5 – The Excel Slope Function Errors
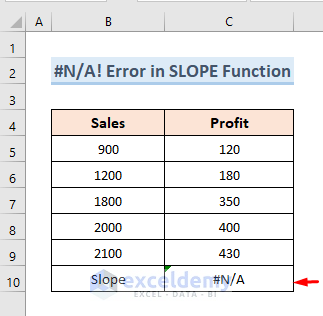
5.1 #N/A! Error
When the specified arrays of known x’s and and known y’s have different length, the SLOPE function displays a #N/A! Error.
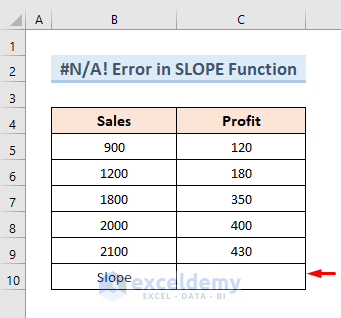
- Select C10 and use the following formula:
=SLOPE(C5:C9,B5:B10)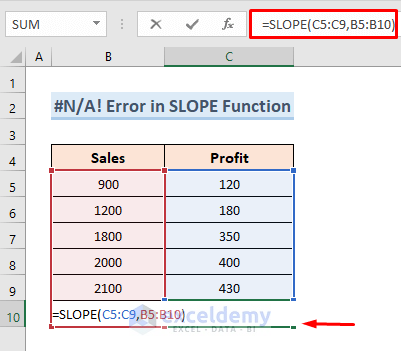
- Press Enter.
- The #N/A! error is displayed as the value in C5:C9 is not equal to B5:B10.
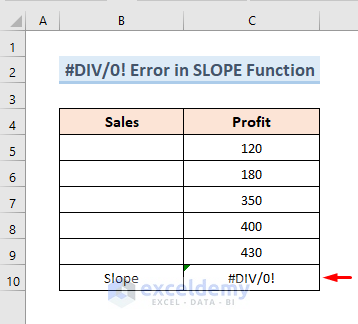
5.2 The #DIV/0! Error
The SLOPE function displays the #DIV/0! error:OPE function throws the #DIV/0! error.
- If any of the known x’s or known y’s arrays are empty.
Calculate the slope of the following dataset:
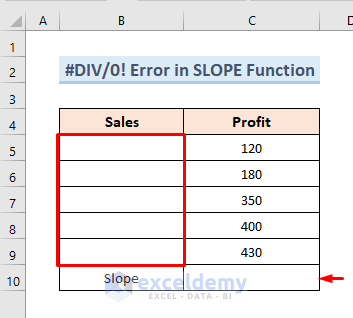
- Select C10 and enter the following formula:
=SLOPE(C5:C9,B5:B9)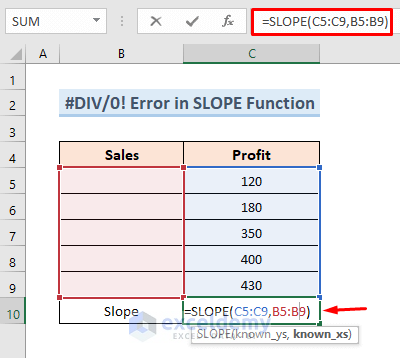
- Press Enter.
- The #DIV/0! error is displayed because there is an empty value in B5:B9.
Download Practice Workbook
Download the practice workbook.
Excel SLOPE Function: Knowledge Hub
- How to Find the Slope of a Regression Line in Excel
- How to Find Slope of Logarithmic Graph in Excel
- How to Calculate Slope of Exponential Graph in Excel
<< Go Back to Excel Functions | Learn Excel
Get FREE Advanced Excel Exercises with Solutions!
