What Is the Slope of a Line?
A slope value describes the relationship between two values, for instance, the x and the y values. It is usually denoted by m in equations and determines two parameters:
- The steepness
- The direction
The mathematical equation is:
y = mx + c
- m is the slope.
- C is the intercept.
The sample dataset contains two variables: time x and distance y.
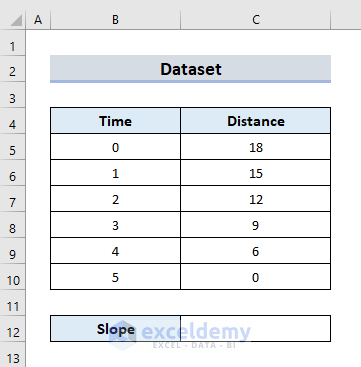
Method 1 – Create a Simple Formula to Calculate the Slope in Excel
Find the mean of the x-values and y-values:
Steps:
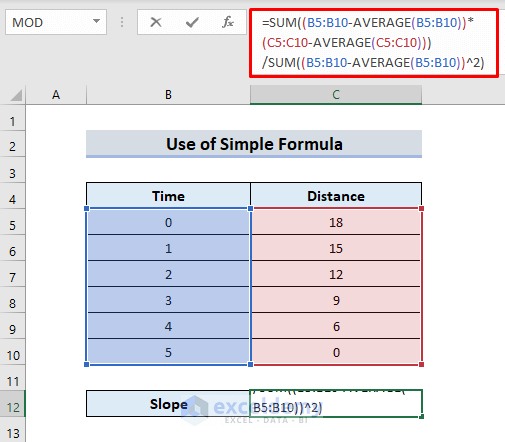
- In C12, enter the following formula.
=SUM((B5:B10-AVERAGE(B5:B10))*(C5:C10-AVERAGE(C5:C10)))/SUM((B5:B10-AVERAGE(B5:B10))^2)- Press Enter or Tab.
- The slope value is displayed in C12.
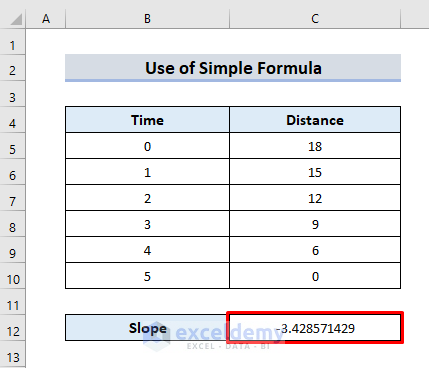
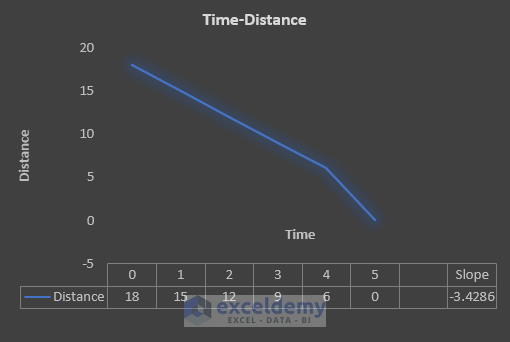
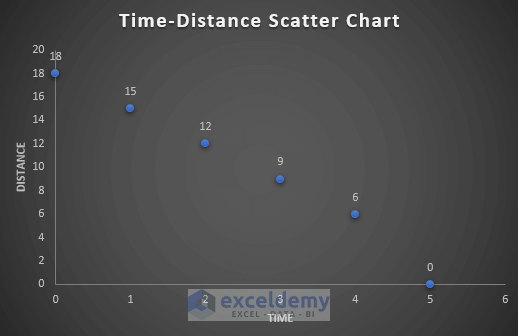
- As there are increasing x-values and decreasing y-values, the value of the slope is negative. A negative slope elopes in an anti-clockwise, left-to-right downhill direction and makes an obtuse angle with the x-axis.
- See the chart:
Formula Breakdown
- SUM((B5:B10-AVERAGE(B5:B10)) sums the value obtained by the average of x-values after subtracting it from the array (B5:B10).
- *(C5:C10-AVERAGE(C5:C10)) returns the average of y-values subtracted from the range (C5:C10) and multiplied by the previous number.
- /SUM((B5:B10-AVERAGE(B5:B10))^2) returns the square number of the average of x-values subtracted from range (B5:B10).The multiplied number is divided by the obtained value.
Read More: How to Find Instantaneous Slope on Excel
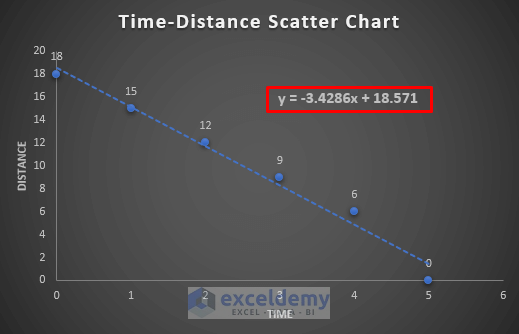
Method 2 – Insert a Scatter Chart to Get the Slope of a Line
Steps:
- Select B4:C10.
- Go to Insert and click Charts.
- Click the Insert Line and Area Chart dropdown icon.
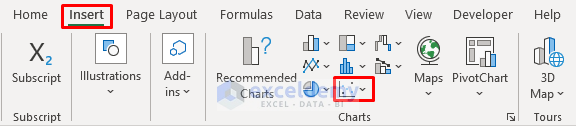
- In Scatter, select a chart type.

- The chart is displayed.
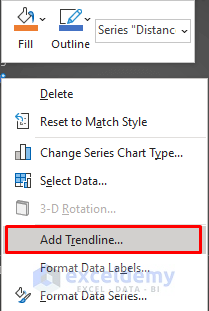
- Right-click any dot on the line.
- Select Add Trendline.
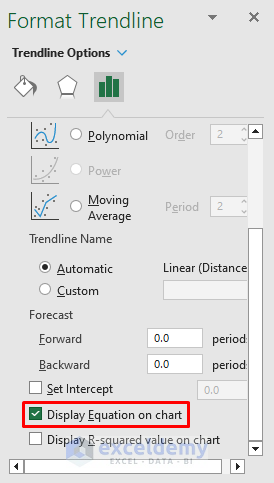
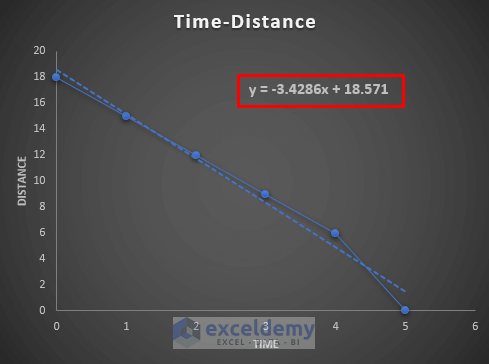
- Check Display Equation on chart.
- The equation y=-3.4286x + 18.571 is displayed in the chart.
- The slope is m= 3.4286.
Read More: How to Find Slope of Logarithmic Graph in Excel
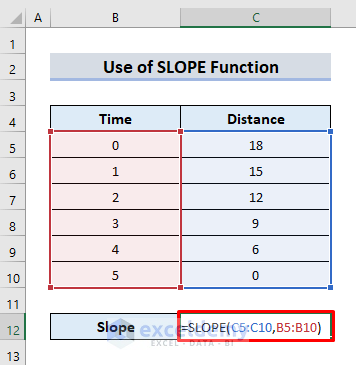
Method 3 – Use the SLOPE Function to Find the Slope in Excel
Steps:
- Enter the formula in C12.
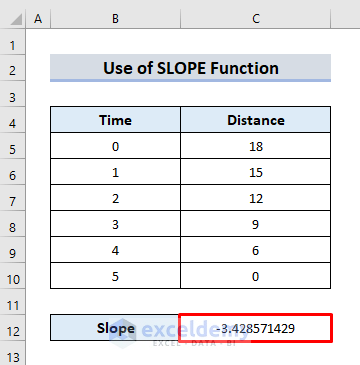
=SLOPE(C5:C10,B5:B10)- Press Enter or Tab.
- The slope is displayed.
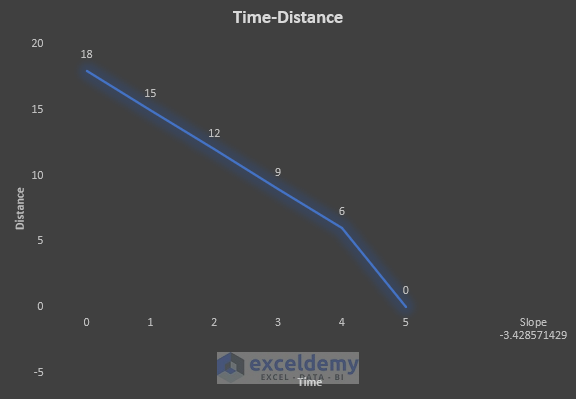
- See the chart:
Read More: How to Calculate Slope of Exponential Graph in Excel
Method 4 – Find the Slope of a Line using Excel VBA
Steps:
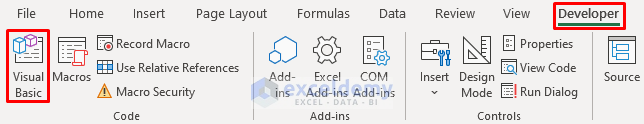
- Go to the Developer tab and select Visual Basic.
- In the Visual Basic window:
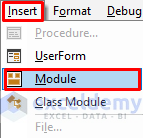
- Click Insert and select Module.
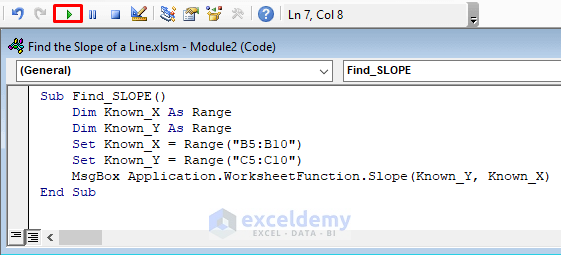
- Enter the following VBA code:
Sub Find_SLOPE()
    Dim Known_X As Range
    Dim Known_Y As Range
    Set Known_X = Range("B5:B10")
    Set Known_Y = Range("C5:C10")
    MsgBox Application.WorksheetFunction.Slope(Known_Y,
    Known_X)
End Sub- Click Run.
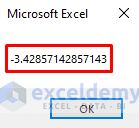
- This is the output.
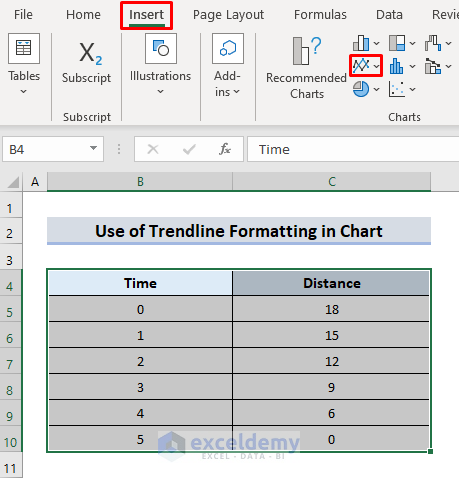
Method 5 – Format a Trendline to Determine the Slope
Steps:
- Select B4:C10.
- Go to Insert and select Charts.
- Click the Insert Line and Area Chart dropdown icon.
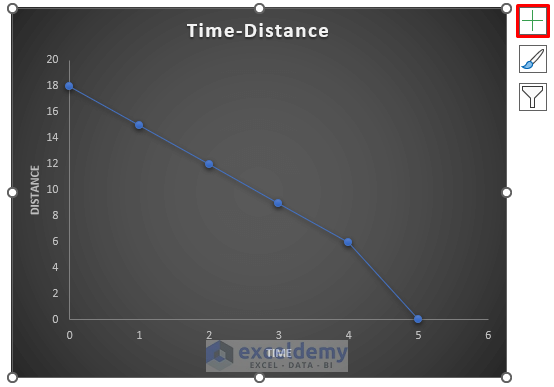
- The chart is displayed
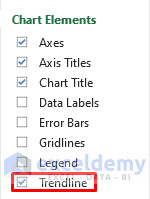
- Select Chart Elements.
- Check Trendline.
- Click Format Trendline.
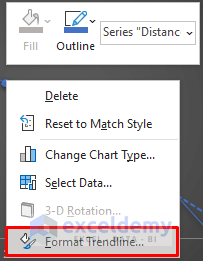
- Check Display Equation on chart.
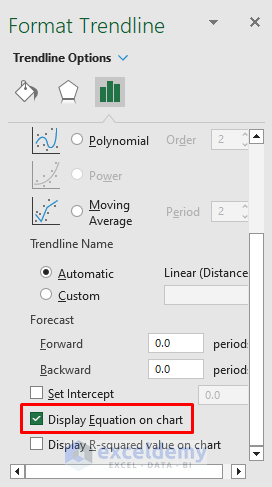
- The equation is displayed in the chart.
- The slope is -3.4286.
Download Practice Workbook
Related Article
<< Go Back to Excel SLOPE Function | Excel Functions | Learn Excel
Get FREE Advanced Excel Exercises with Solutions!
