Slope and Exponential Graphs
Exponential Graph:
The basic equation is:
y=a.bxa and b are constants.
Slope:
The slope indicates whether there is an upward or a downward trend.
To find the slope of this exponential equation, use the expression:
lny = lna + x(lnb)
Slope: dy/dx=a.bx(lnb)
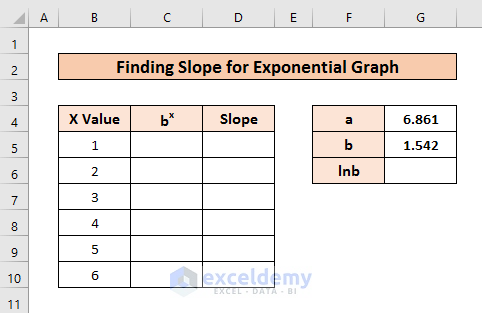
This is the sample dataset.
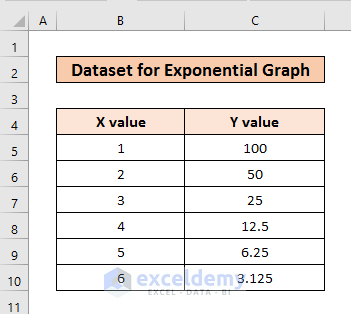
To convert it into an exponential function:
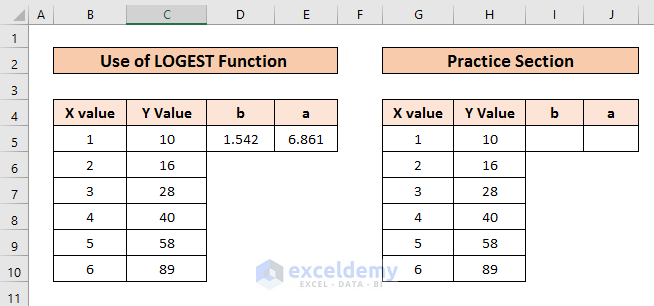
Step 1 – Finding the Constant a and b of the Exponential Graph with the LOGEST Function
- Add two columns beside the dataset.
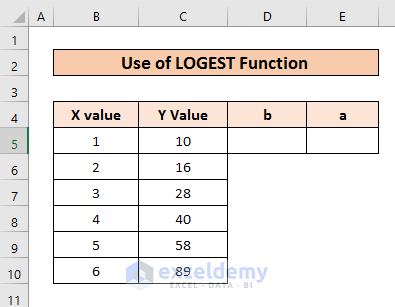
- Select D5 and E5.
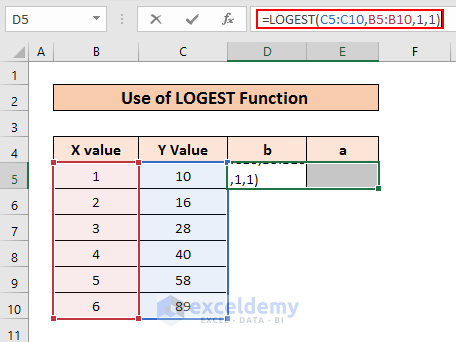
- Use the following formula and press ENTER.
=LOGEST(C5:C10,B5:B10,1,1)- C5:C10:- Y values
- B5:B10:- X values
- 1 :- const value
- 1:- Stats value
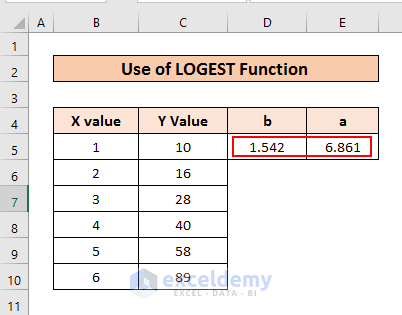
This is the output.
Read More: How to Calculate Slope and Intercept in Excel
Step 2 – Calculating the Slope
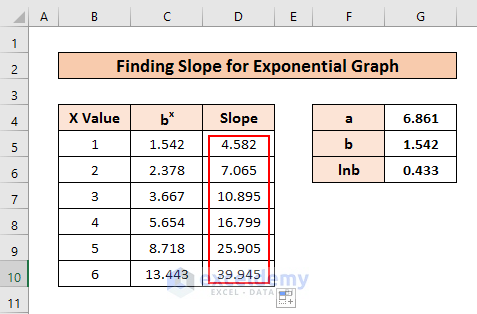
The slope for the exponential equation is:
dy/dx=a.bx(lnb)Find bx and lnb and calculate the corresponding slopes for the X values:
- Use the LN function in G6 and press ENTER.
=LN(G5)
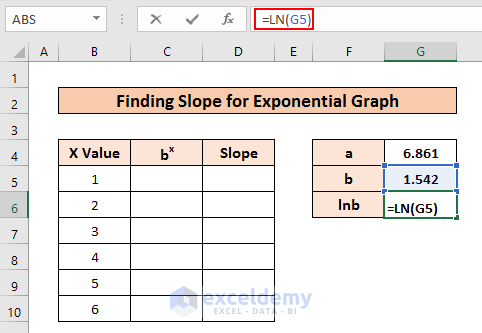
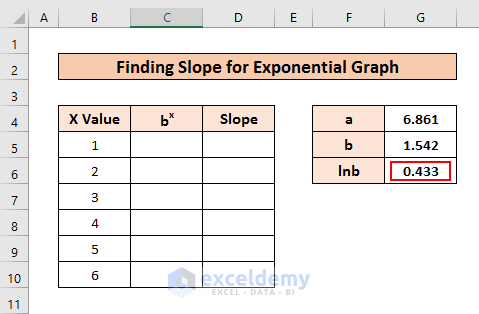
The value of lnb is displayed.
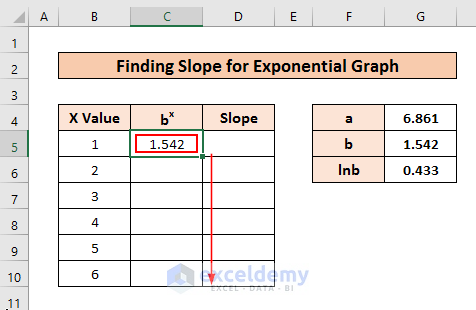
- Use the POWER function in C5 and press ENTER.
=POWER($G$5,B5)- $G$5:- absolute value
- B5:- X values
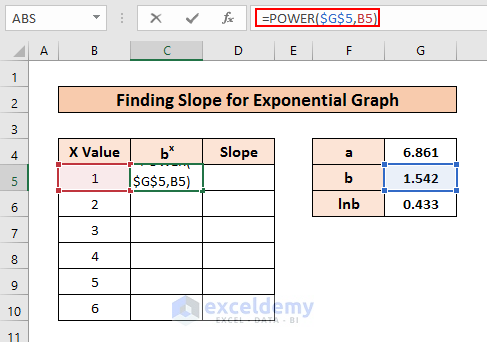
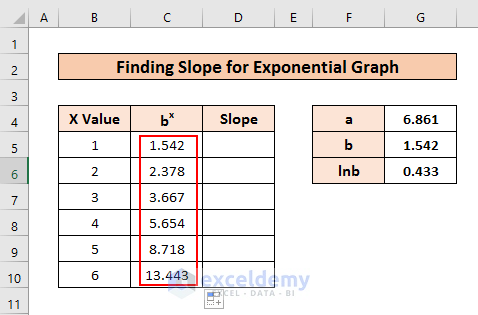
The value of bx is displayed.
- Drag down the Fill Handle to see the result in the rest of the cells.
This is the output.
- Enter the following formula in D5 and press ENTER.
=$G$4*C5*$G$6- $G$4:- absolute value
- C5:- bx
- $G$6:- absolute value
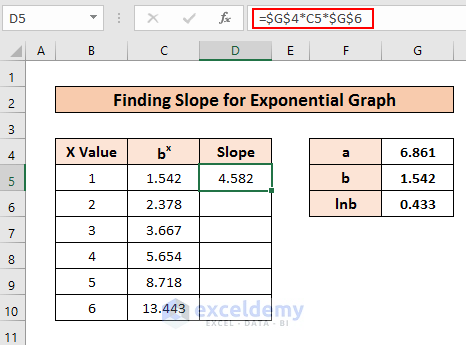
The first slope value is displayed.
- Drag down the Fill Handle to see the result in the rest of the cells.
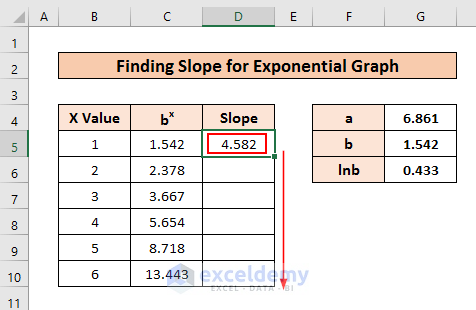
This is the output.
Read More: How to Find the Slope of a Line in Excel
Step 3 – Plotting a Graph with the Slope Value vs the X Values
- Copy and paste the X Value and Slope Columns in a new sheet.
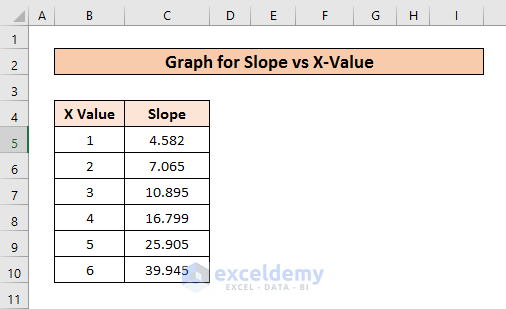
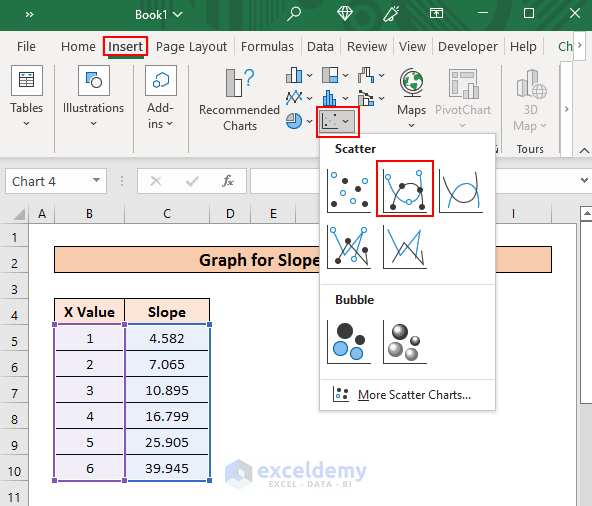
- Select the data.
- Go to the Insert tab and select Charts.
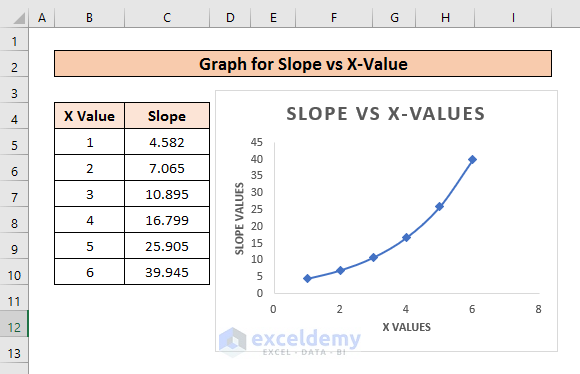
- Choose a chart type.
The graph is displayed.
Read More: How to Find Instantaneous Slope on Excel
Practice Section
Download the practice workbook.
Download Practice Workbook
Related Articles
<< Go Back to Excel SLOPE Function | Excel Functions | Learn Excel
Get FREE Advanced Excel Exercises with Solutions!
