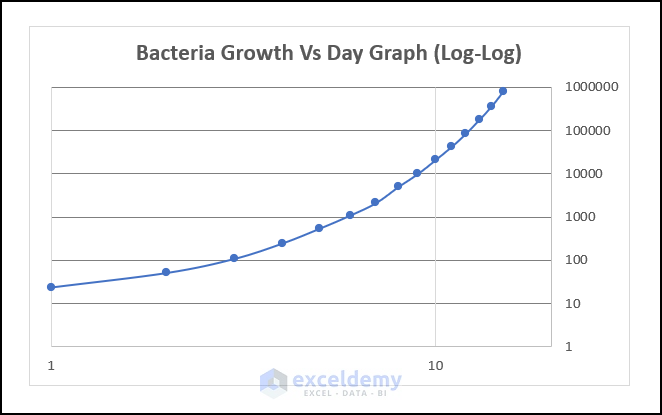
By adjusting a few axis format variables in Excel, we can simply plot a log-log graph. Both axes in the log-log or natural log-log graph are really on a logarithmic scale. Similar to the equation y = c. xa, this graph illustrates whether the variables are in a constant power relationship. In this case, the X and Y are related by a power of ‘a’ as in the image below.
- The line should have a smaller curve if a dataset derived from this equation is shown using a logarithmic scale.
Step 1 – Create a Logarithmic Graph by Using the Charts Tool of Excel
- Select the Scatter Chart from the Charts group under the Insert tab.
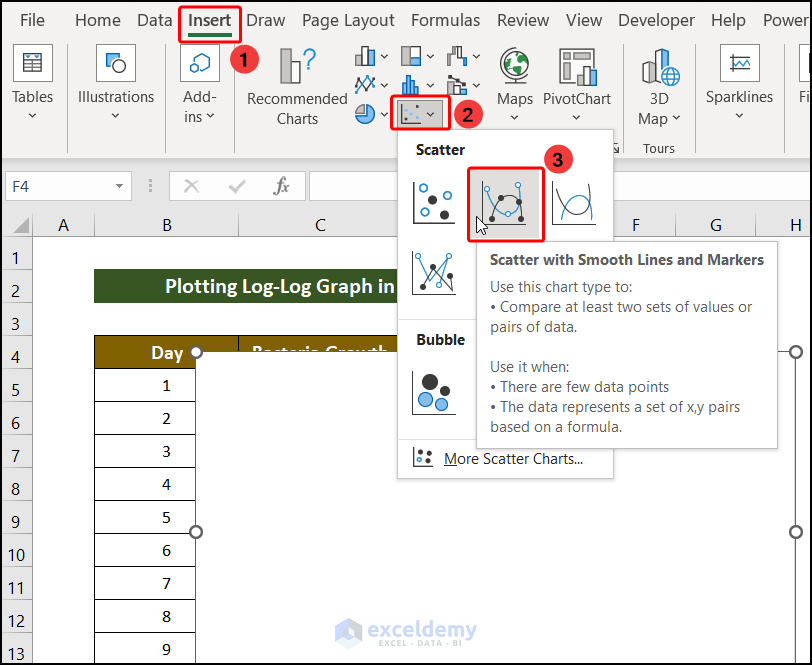
- A blank chart will appear.
- Right-click on the chart and choose the command Select data from the context menu.
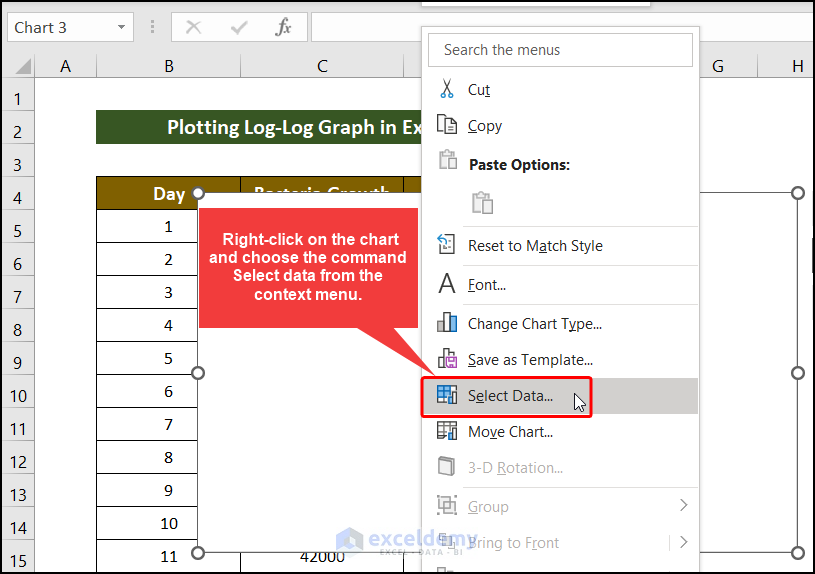
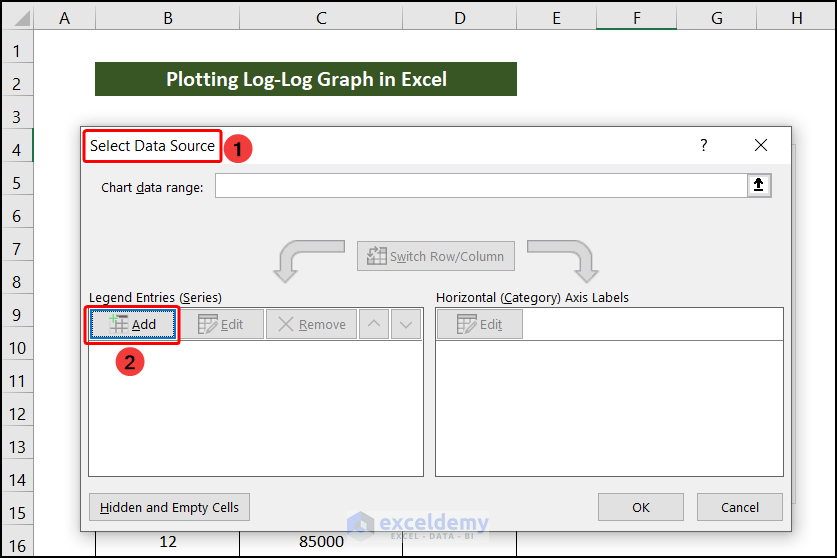
- A new window titled Select Data Source will appear. Click the Add command icon in that window.
- Choose the range of cells that we will use as data for the X-axis and the Y-axis in the following window.
- Choose the cell address that currently has the cells and cell name in it to insert the title there.
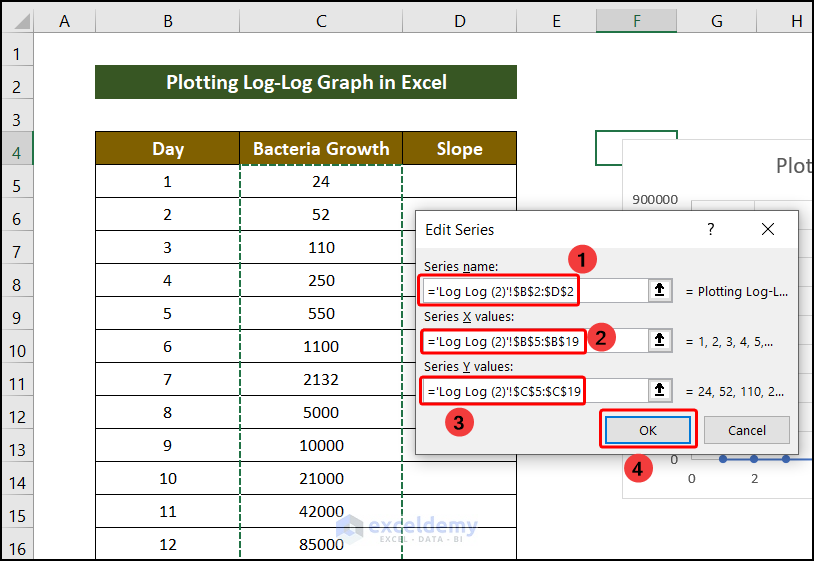
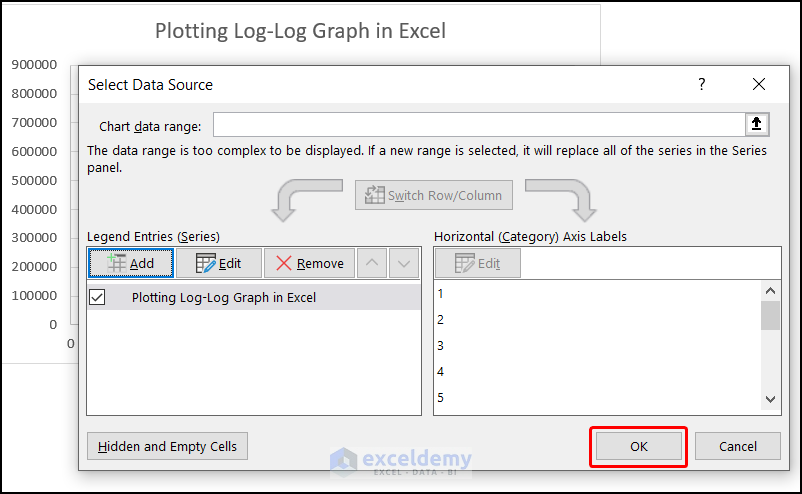
- Click OK.
- Right-click on the labels for the Horizontal Axis to generate the logarithmic graph.
- Select Format Axis from the context menu.
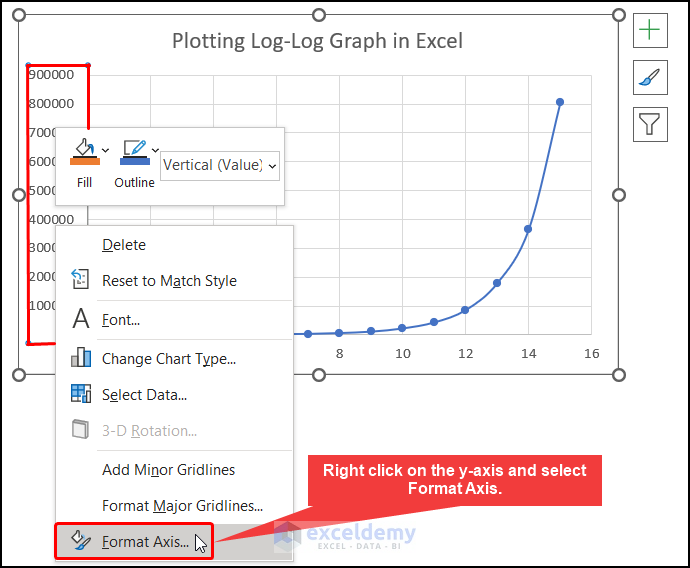
- It will reveal a new side panel. Select the Logarithmic scale checkbox and enter Base 2.7 under the Axis Options in the Format Axis side panel.
- Set Vertical Axis Crosses to Automatic as well.
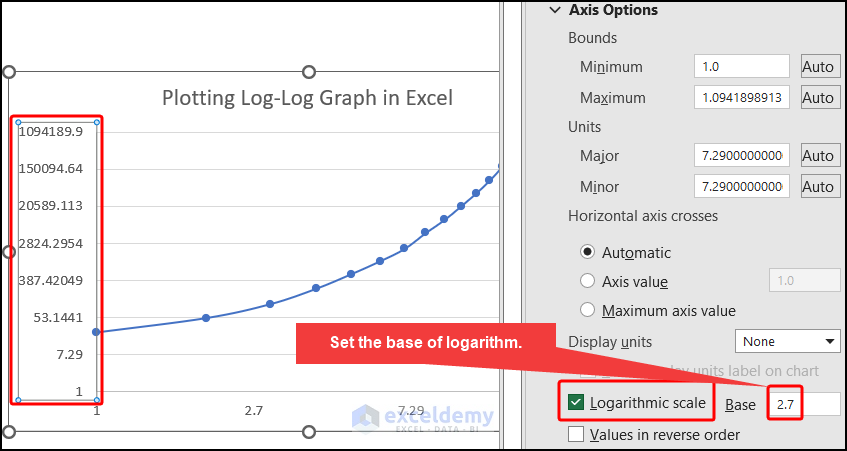
- Similar to the y-axis, check the Logarithmic scale checkbox for the x-axis under the Axis Options in the Format Axis side panel.

Read More: How to Calculate Slope and Intercept in Excel
Step 2 – Find the Slope of the Logarithmic Graph
We have data that could fit the theoretical y = c. xa curve. The slope of a natural log-log plot is equal to the exponent a‘s value, which is calculated as
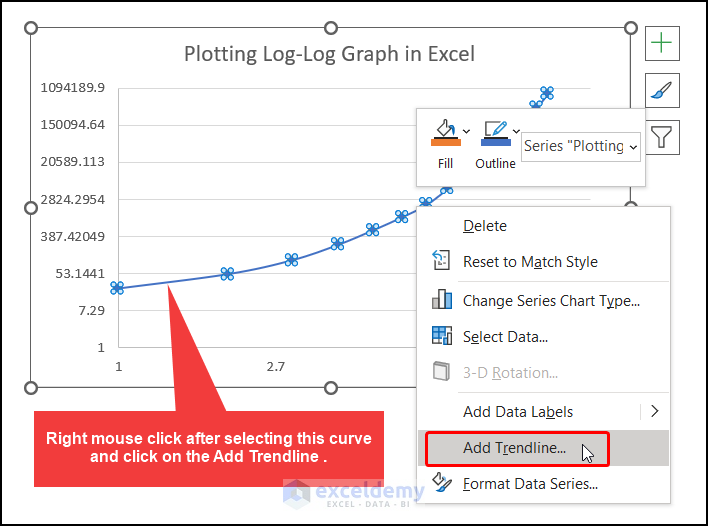
a=ln(y2)-ln(y1)/ln(x2)-ln(x1)- Select Add Trendline to find the equation of our data like the image below.
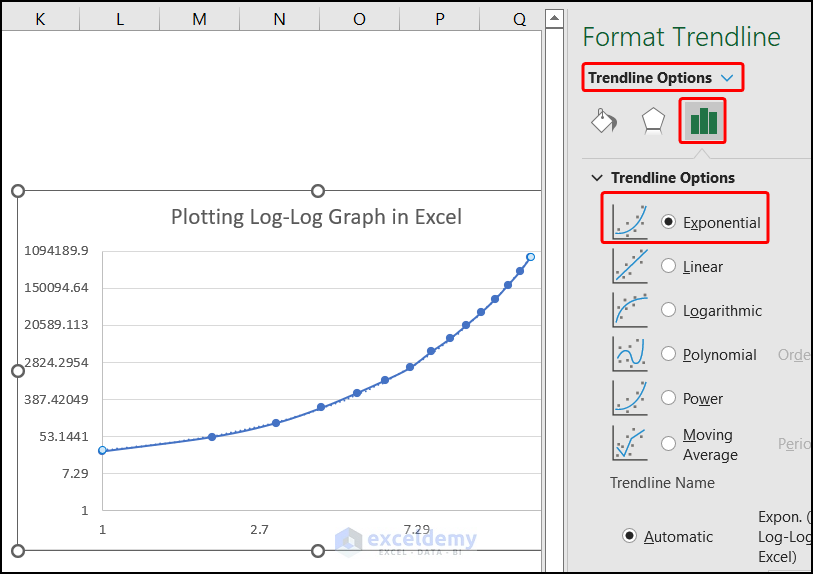
- Select Exponential as the trendline like in the following image.
- Select Display Equation on Chart in the Trendline Options.
y = 12.484e0.7387x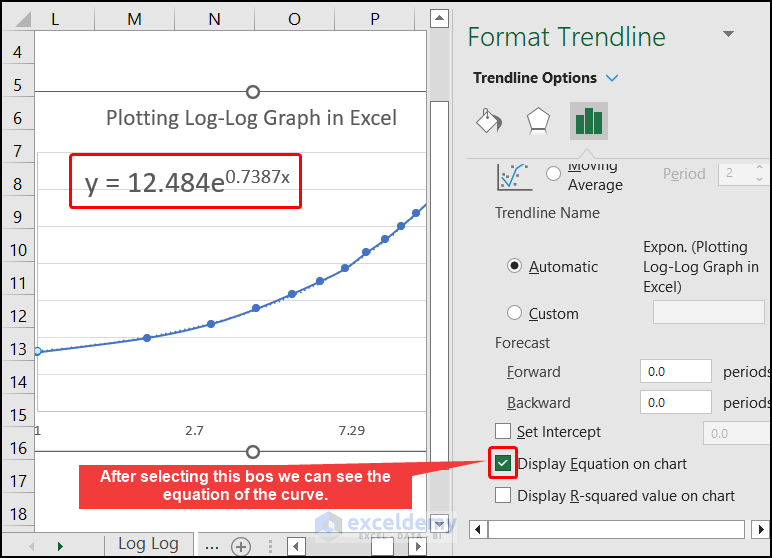
- We will get the following equation to find the slope in each point of our x-value for this example the x-values are Day.
dy/dx=12.484 x 0.7387 x e0.7387x- Using the differential equation, we will get the slope in Excel like the following image.
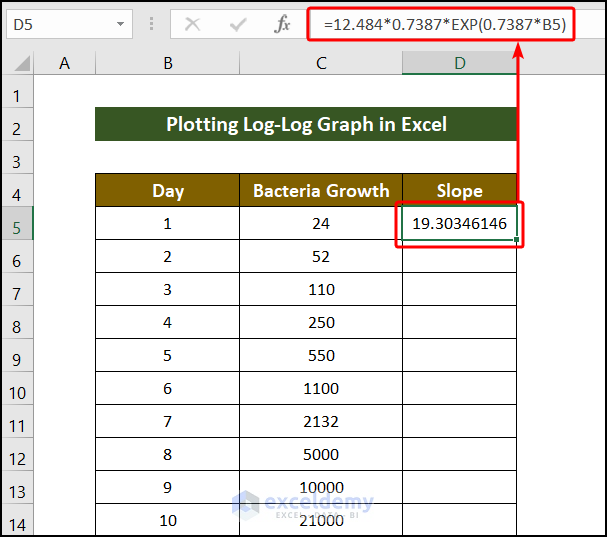
The formula is as follows:
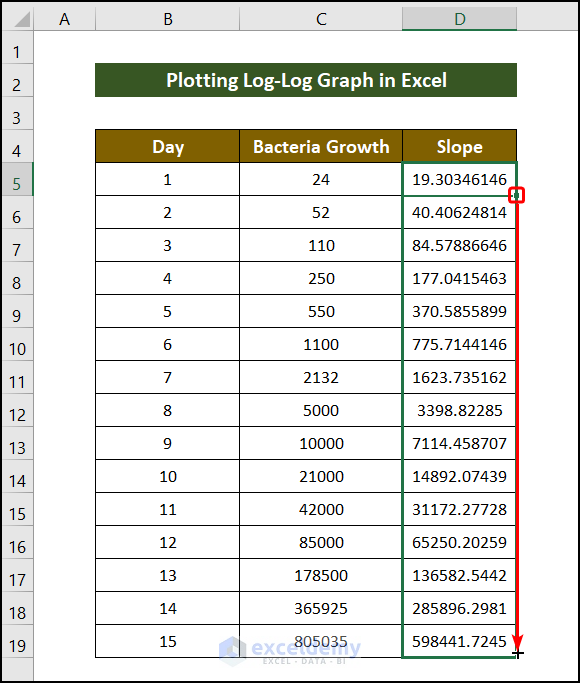
=12.484*0.7387*EXP(0.7387*B5)- Drag the fill handle down to complete the series.
Read More: How to Find the Slope of a Line in Excel
Download the Practice Workbook
Related Articles
- How to Find the Slope of a Regression Line in Excel
- How to Find Instantaneous Slope on Excel
- How to Calculate Slope of Exponential Graph in Excel
<< Go Back to Excel SLOPE Function | Excel Functions | Learn Excel
Get FREE Advanced Excel Exercises with Solutions!
