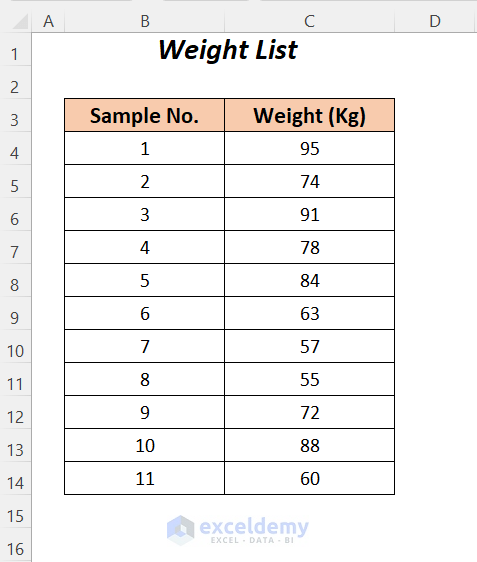
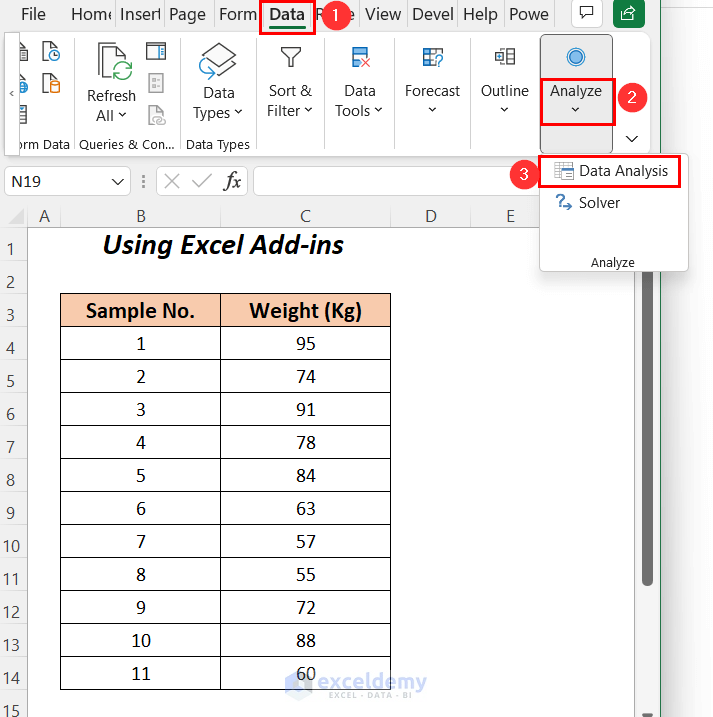
We have the following sample dataset containing some samples showing their weight distribution. Using this dataset, we will determine the upper and lower limits of a confidence level.
Method 1 – Using Excel Add-ins to Find Upper and Lower Limits of a Confidence Interval
Step 1:
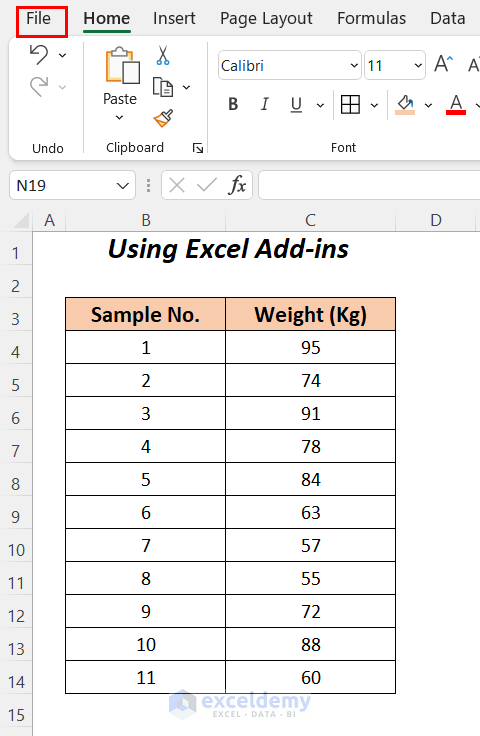
Enable the Add-ins for calculating the confidence interval of the weights.
- Go to the File menu.
- Select Options.

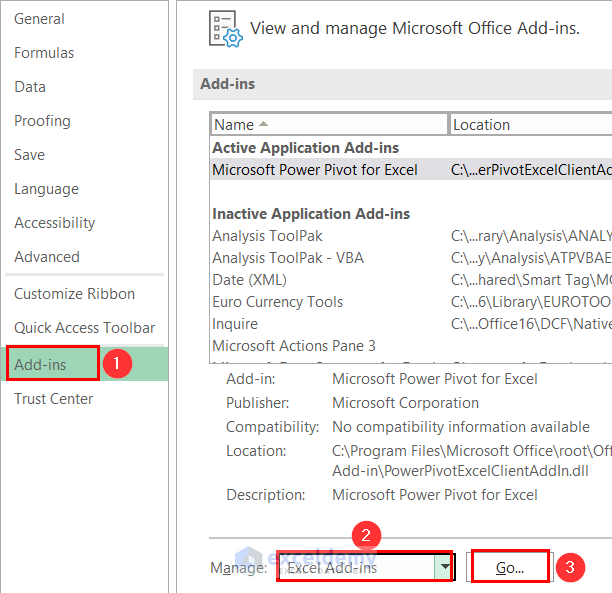
- Go to the Add-ins tab, select Excel Add-ins from the Manage options and click Go.
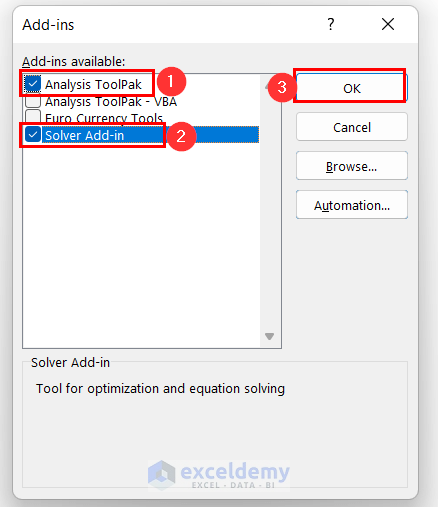
- Check the options Analysis Toolpak, Solver Add-in and press OK.
Step 2 :
After enabling the ToolPak, analyze the data.
- Go to the Data tab >> Analyze group >> Data Analysis
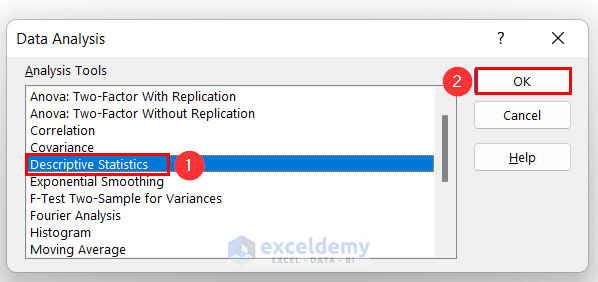
- Choose the Descriptive Statistics option from the Data Analysis dialog box and press OK.
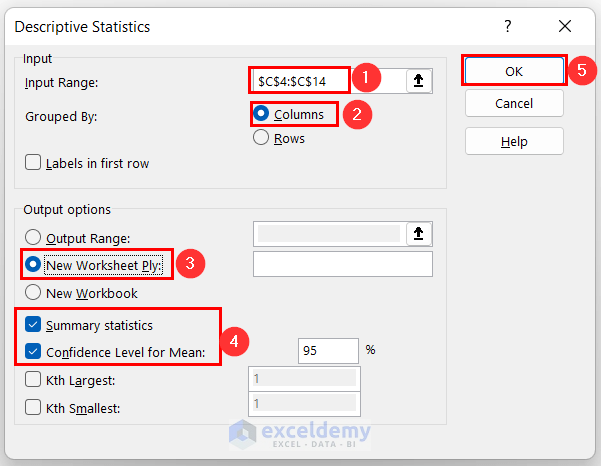
- Choose the Input Range as $C$4:$C$14 (the range of the weights) >> Grouped By → Columns >> New Worksheet Ply >> check the options Summary statistics and Confidence Level for Mean (by default 95%).
- Click OK.
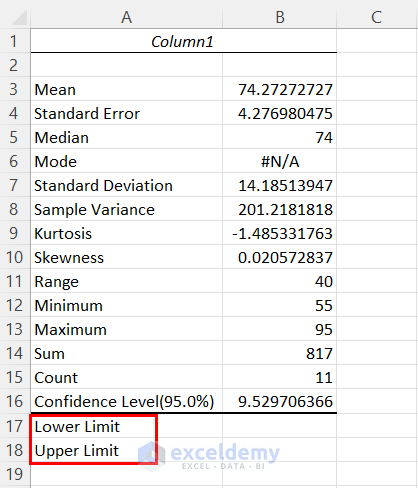
You will get the results in a new worksheet. Utilize the Mean value and Confidence Level for calculating the limits.
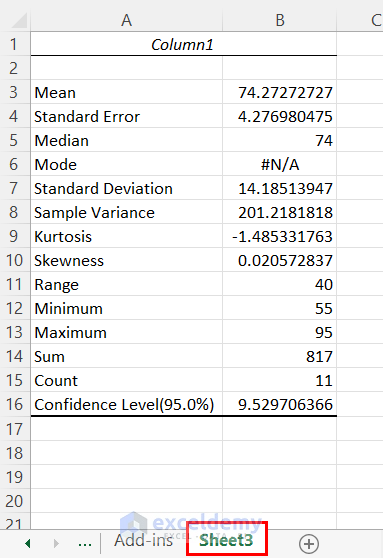
- To get the limit values we have used the following two rows after the created table to determine the Lower Limit and Upper Limit.
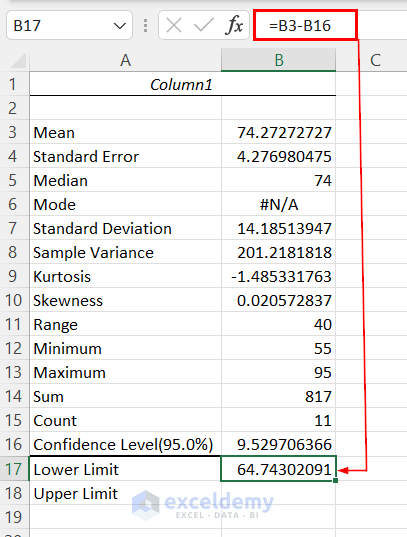
- Enter the following formula to get the Lower Limit.
=B3-B16We are subtracting the Mean value from the Confidence Level.
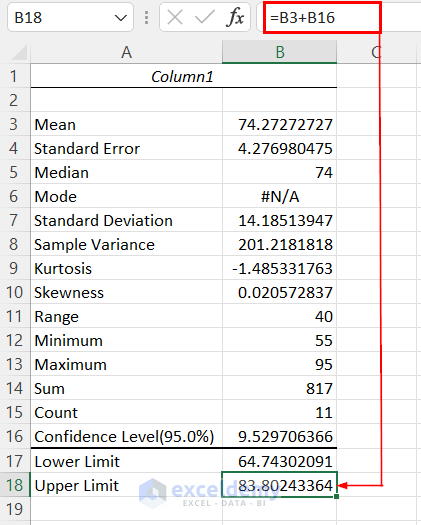
- Apply the following formula in cell B18 to gain the Upper Limit
=B3+B16We are adding up the Mean value with the Confidence Level.
Read More: How to Calculate 99 Confidence Interval in Excel
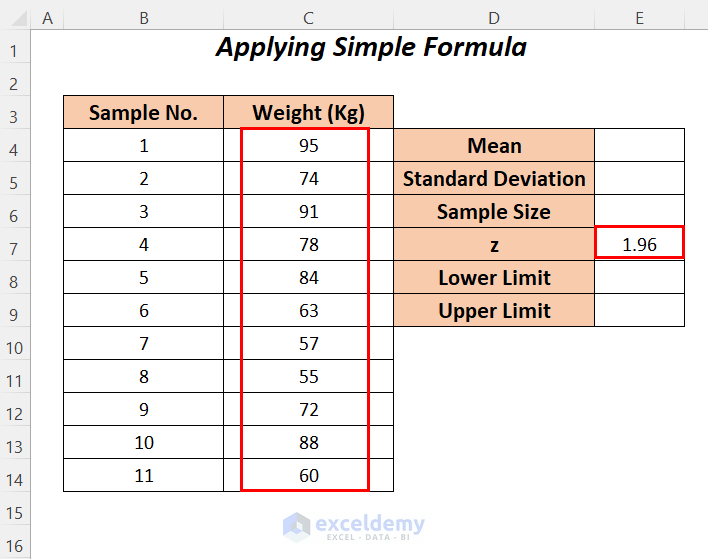
Method 2 – Utilizing a Simple Formula
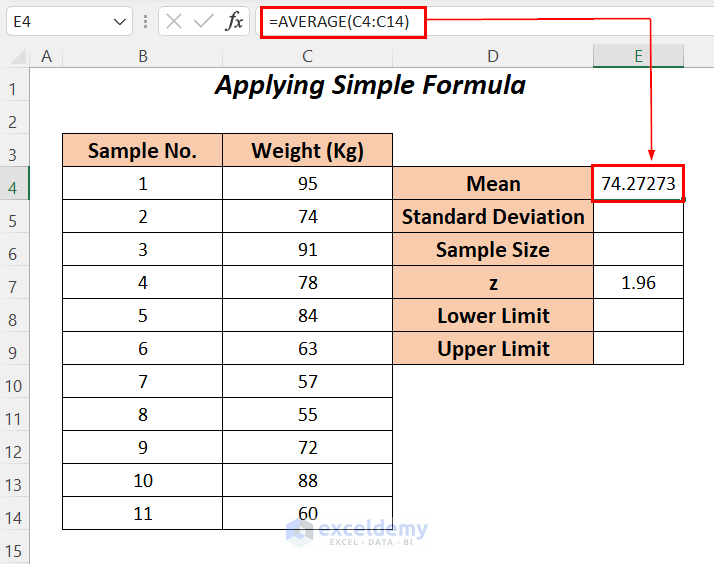
We will use a simple formula to calculate the limits manually. For calculation, we have added some rows beside our dataset and inserted 1.96 as the z value (1.96 will work for a 95% confidence level).
Step 1:
Calculate the mean, standard deviation and sample size using the AVERAGE, STDEV and COUNT functions.
- Enter the following formula in cell E4.
=AVERAGE(C4:C14)The AVERAGE function will determine the mean weight of the range C4:C14.
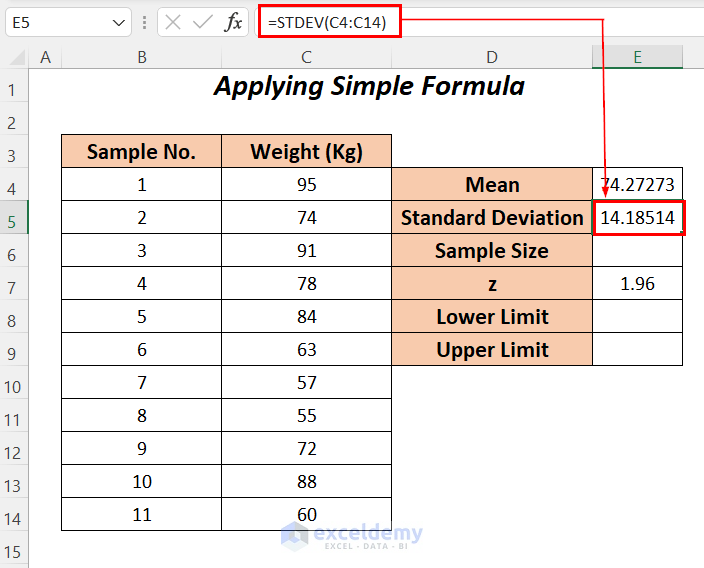
- Apply the following formula in cell E5.
=STDEV(C4:C14)STDEV calculates the standard deviation of the range C4:C14.
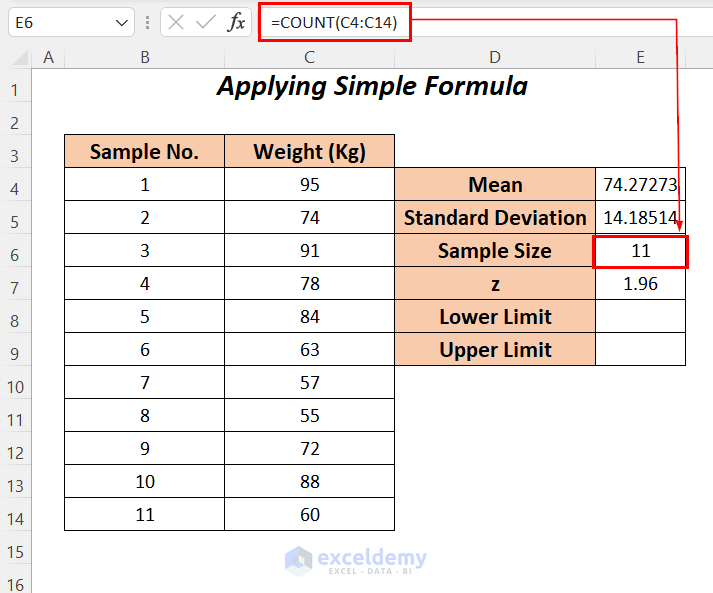
- For calculating the sample size, enter the following formula in cell E6.
=COUNT(C4:C14)The COUNT function will determine the total number of samples in the range C4:C14.
Step 2:
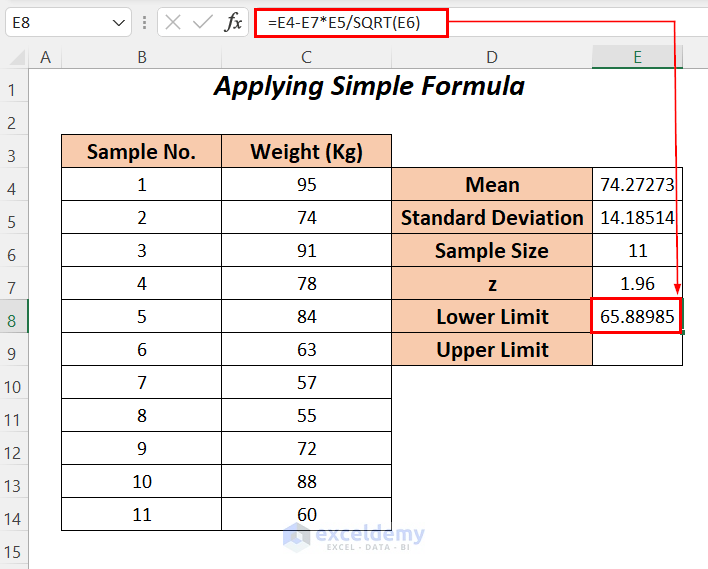
Enter the following formula to calculate the lower limit.
=E4-E7*E5/SQRT(E6)
Formula Breakdown
- E7*E5 → becomes
- 96*14.18514 → 27.803
- SQRT(E6) → becomes
- SQRT(11) → The SQRT function will calculate a square root value of 11
- Output → 3.3166
- SQRT(11) → The SQRT function will calculate a square root value of 11
- E7*E5/SQRT(E6) → becomes
- 803/3.3166 → 8.38288
- E4-E7*E5/SQRT(E6) → becomes
- 27273-8.38288 → 65.88985
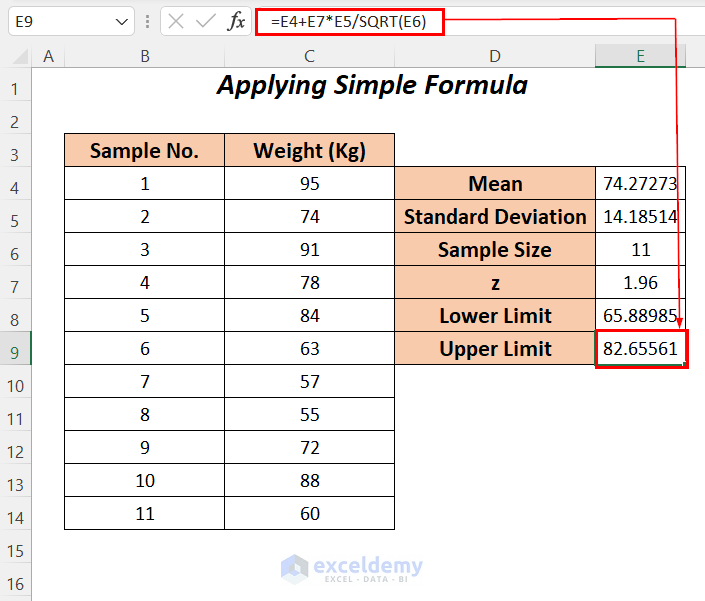
- Enter the following formula to calculate the upper limit.
=E4+E7*E5/SQRT(E6)Formula Breakdown
- E7*E5 → becomes
- 96*14.18514 → 27.803
- SQRT(E6) → becomes
- SQRT(11) → The SQRT function will calculate a square root value of 11
- Output → 3.3166
- SQRT(11) → The SQRT function will calculate a square root value of 11
- E7*E5/SQRT(E6) → becomes
- 803/3.3166 → 8.38288
- E4+E7*E5/SQRT(E6) → becomes
- 27273+8.38288 → 82.65561
Read More: How to Calculate 95 Percent Confidence Interval in Excel
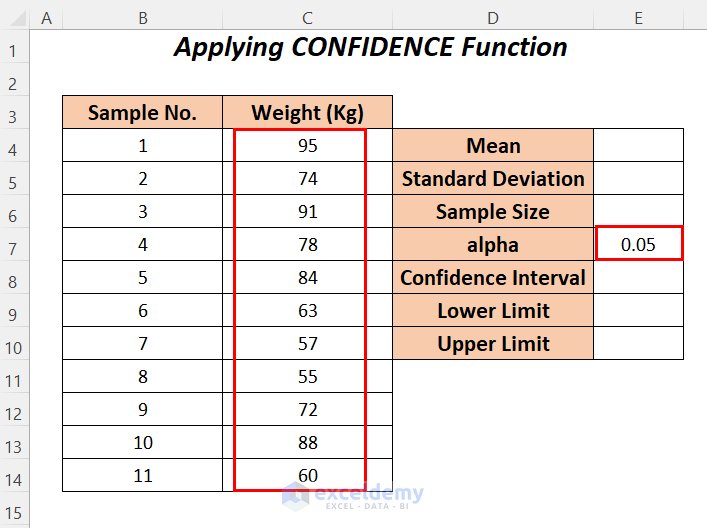
Method 3 – Applying CONFIDENCE Function to Find Upper and Lower Limits of a Confidence Interval
We will apply the CONFIDENCE function to calculate the confidence interval at 95% which means that the alpha value would be 5% or 0.05.
Steps:
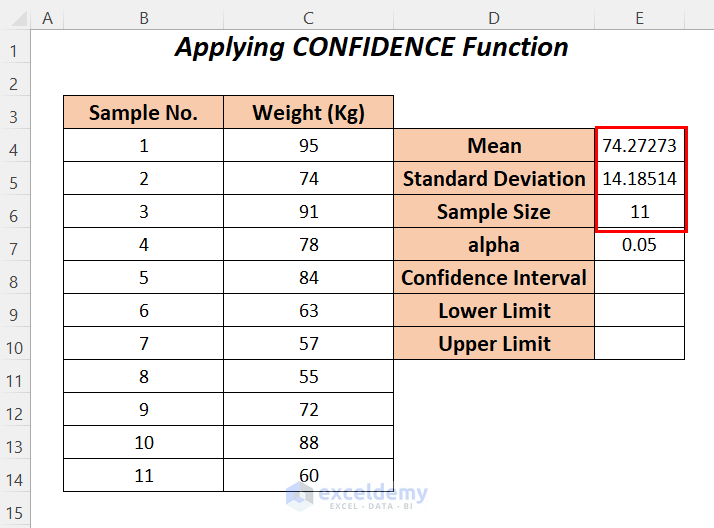
- Follow Step-01 of Method-2 to calculate the Mean, Standard Deviation, and Sample Size of the weights.
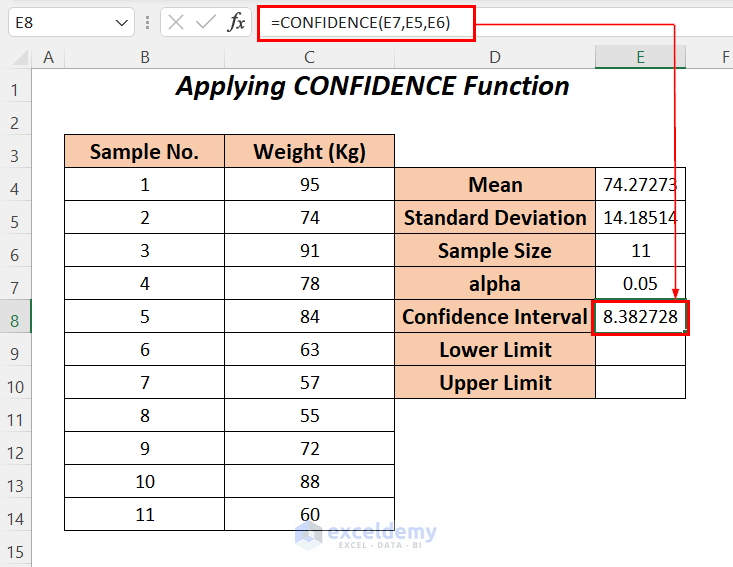
- Apply the following formula in cell E8.
=CONFIDENCE(E7,E5,E6)E7 is the significant value or alpha, E5 is the standard deviation and E6 is the sample size. CONFIDENCE will return the confidence interval of this range.
- To gain the lower limit, enter the following formula to subtract the mean value from the confidence interval.
=E4-E8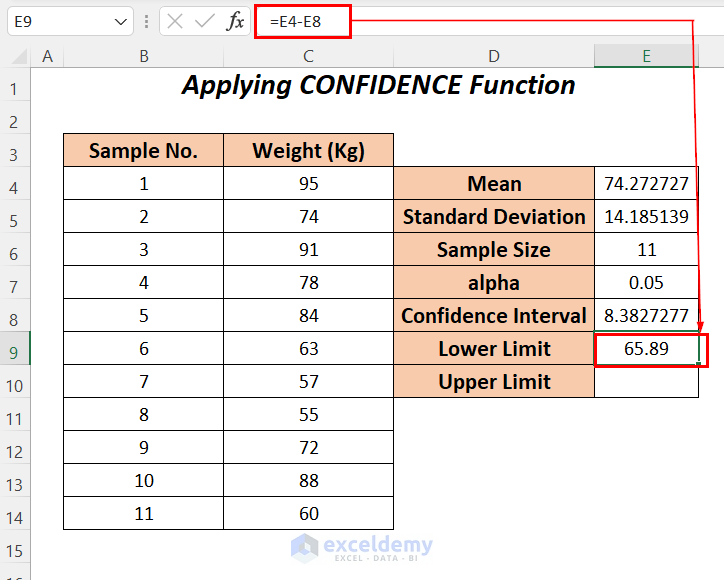
- For the upper limit, enter the following formula to add the mean value with the confidence interval.
=E4+E8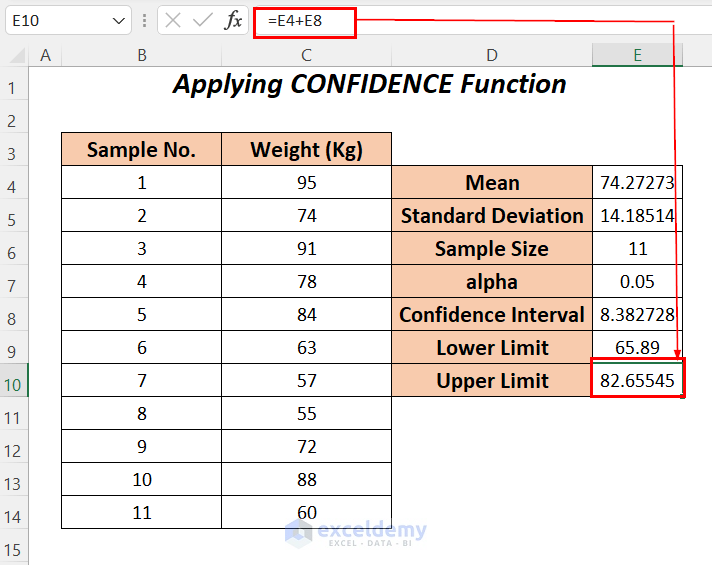
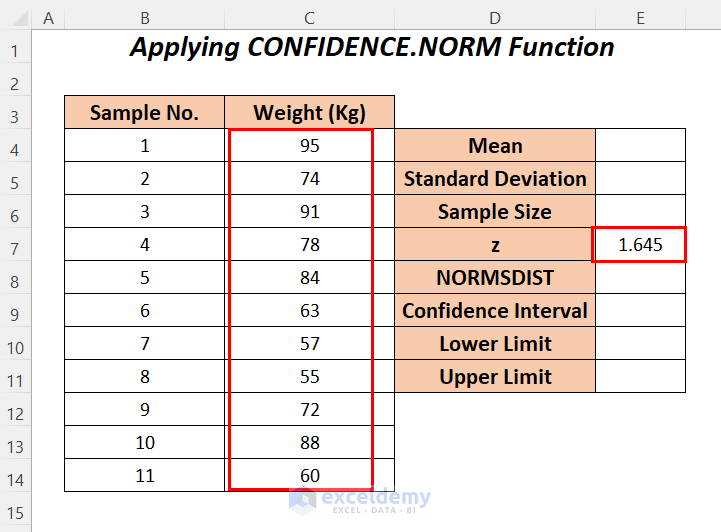
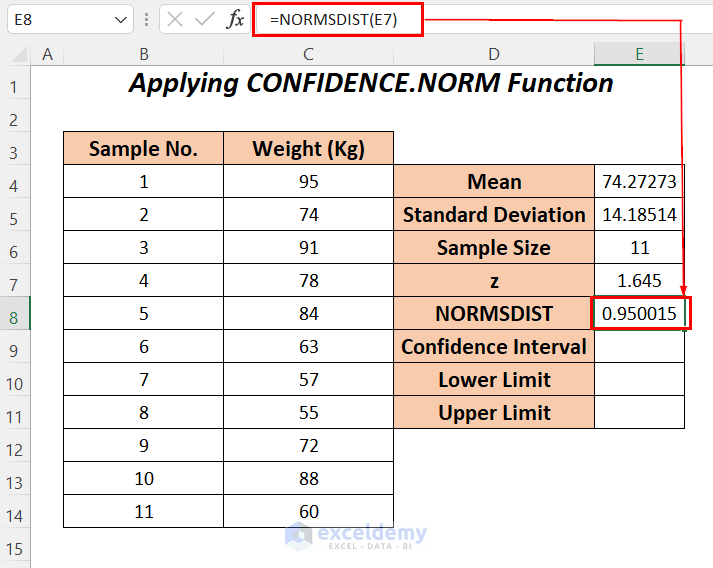
Method 4 – Implementing NORMSDIST and CONFIDENCE.NORM Functions
We will use the NORMSDIST function to calculate the normal distribution of the z value (for this function the z value will be 1.645 for a 95% confidence level) and the
Steps:
- Follow Step-01 of Method-2 to calculate the Mean, Standard Deviation, and Sample Size of the weights.
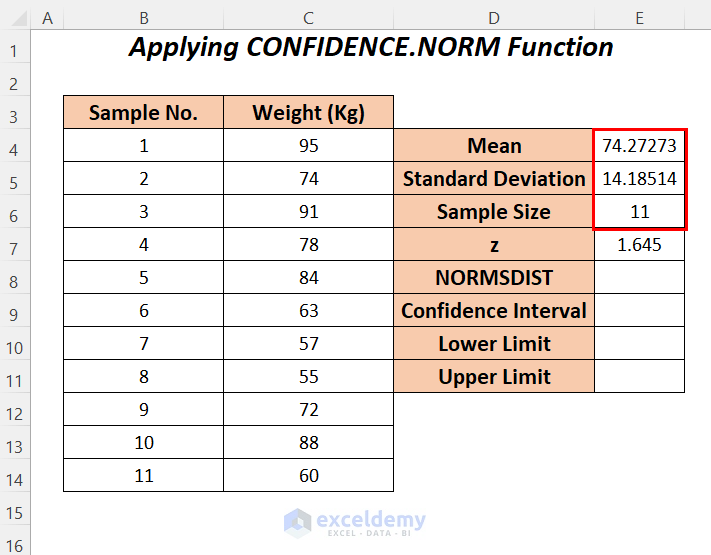
- To calculate the confidence level percentage apply the NORMSDIST function in cell E8.
=NORMSDIST(E7)E7 is the z value.
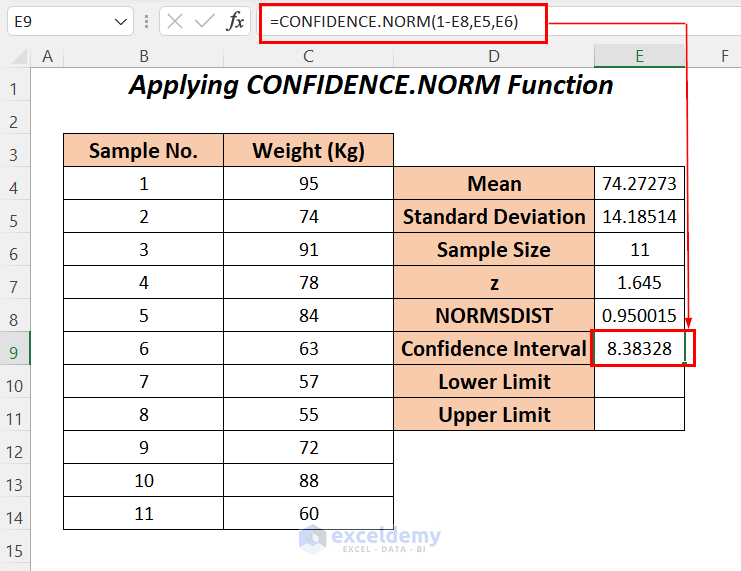
- Enter the following formula in cell E9.
=CONFIDENCE.NORM(1-E8,E5,E6)1-E8 will return the alpha or significant value which will be 0.05, E5 is the standard deviation, and E6 is the sample size. CONFIDENCE.NORM will return the confidence interval of this range.
- To gain the lower limit, enter the following formula to subtract the mean value from the confidence interval.
=E4-E8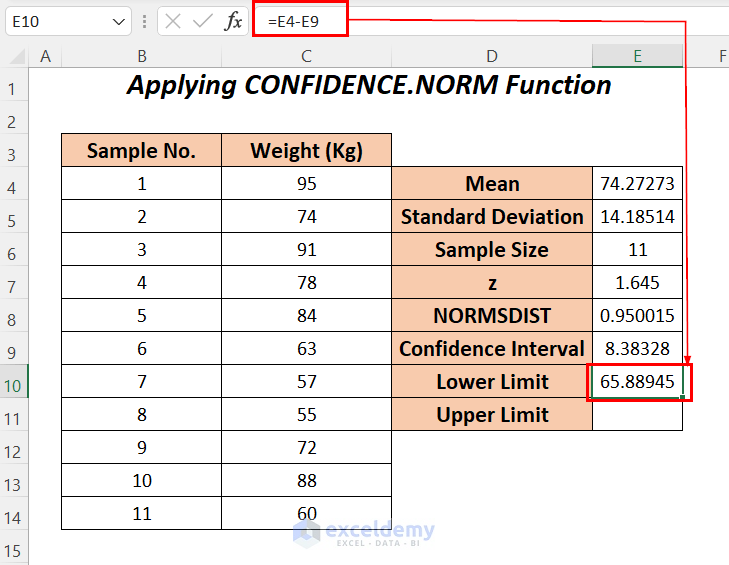
- For the upper limit add the mean value with the confidence interval.
=E4+E8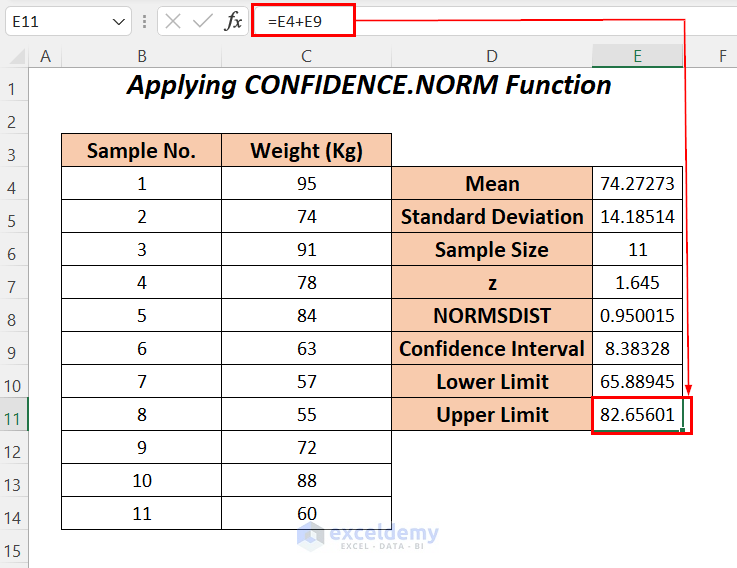
Read More: How to Calculate Confidence Interval in Excel
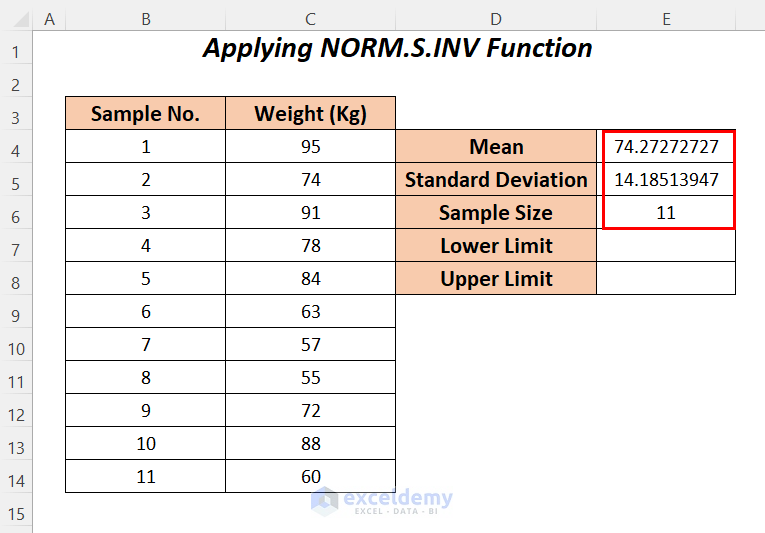
Method 5 – Utilizing NORM.S.INV and SQRT Functions to Find Upper and Lower Limits of a Confidence Interval
Steps:
- Follow Step-01 of Method-2 to calculate the Mean, Standard Deviation, and Sample Size of the weights.
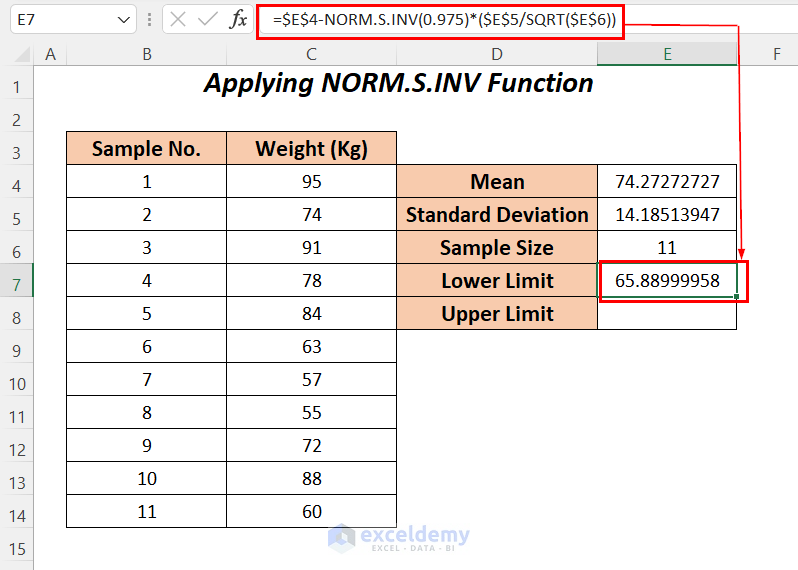
- For calculating the lower limit apply the following formula in cell E7.
=$E$4-NORM.S.INV(0.975)*($E$5/SQRT($E$6))Formula Breakdown
- S.INV(0.975) → it will return the value of the z which will be used for calculating the confidence interval (for the 95% level we have to use 0.975 here)
- Output → 1.95996
- SQRT(E6) → becomes
- SQRT(11) → The SQRT function will calculate a square root value of 11
- Output → 3.3166
- SQRT(11) → The SQRT function will calculate a square root value of 11
- $E$5/SQRT(E6) → becomes
- 185/3.3166 → 4.2769
- S.INV(0.975)*($E$5/SQRT($E$6)) → becomes
- 95996/4.2769 → 8.3827
- $E$4-NORM.S.INV(0.975)*($E$5/SQRT($E$6)) → becomes
- 27273- 8.3827 → 65.88985
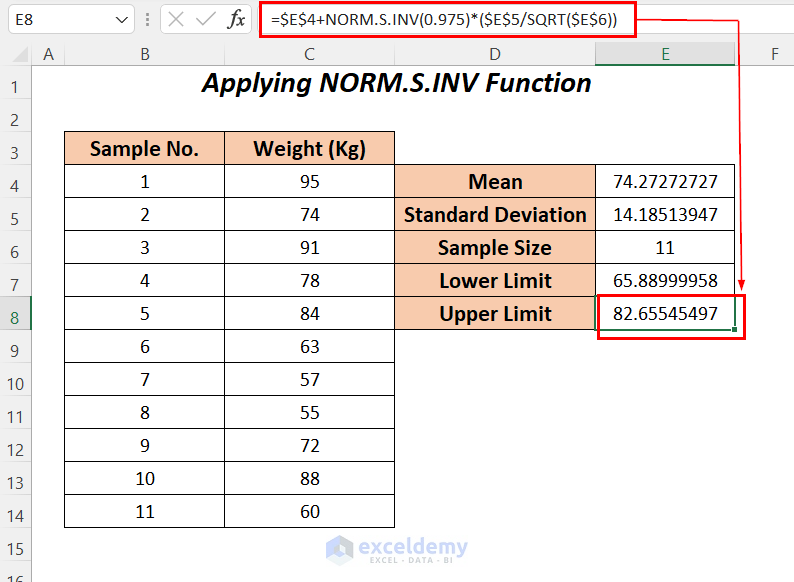
- To have the upper limit apply the following formula in cell E8.
=$E$4+NORM.S.INV(0.975)*($E$5/SQRT($E$6))Formula Breakdown
- S.INV(0.975) → it will return the value of the z which will be used for calculating the confidence interval (for the 95% level we have to use 0.975 here)
- Output → 1.95996
- SQRT(E6) → becomes
- SQRT(11) → The SQRT function will calculate a square root value of 11
- Output → 3.3166
- SQRT(11) → The SQRT function will calculate a square root value of 11
- $E$5/SQRT(E6) → becomes
- 185/3.3166 → 4.2769
- S.INV(0.975)*($E$5/SQRT($E$6)) → becomes
- 95996/4.2769 → 8.3827
- $E$4-NORM.S.INV(0.975)*($E$5/SQRT($E$6)) → becomes
- 27273+ 8.3827 → 82.65545
Download Practice Workbook
Related Articles
- How to Find Confidence Interval in Excel for Two Samples
- Linear Regression Confidence Interval in Excel
- How to Make a Confidence Interval Graph in Excel
<< Go Back to Confidence Interval Excel | Excel for Statistics | Learn Excel
Get FREE Advanced Excel Exercises with Solutions!
