Consider the problem below:
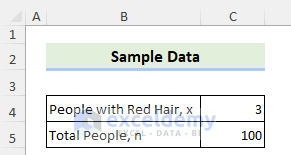
3 out of 100 New Yorkers have red hair. Construct a 90% confidence interval for the proportion of red haired people in the State of New York.
Step 1 – Calculate the Sample Proportion
The Sample Proportion is the part of a given sample of individuals in larger group that follows a specific characteristic.
The parameter p′ represents the sample proportion and is used to calculate the genuine population proportion.
- The following equation is used to find the sample proportion:
- p′ = the sample proportion
- x = the number of the sample population that meets the criteria
- n = the whole number of the sample population
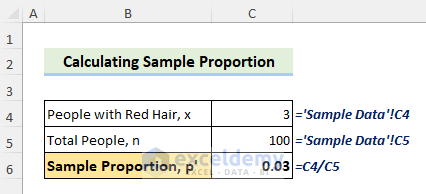
Sample Proportion Calculation:
x = 3; n= 100
Now, p′ = x/n
⇒ p′ = 3/100
⇒ p′ = 0.03
Step 2 – Calculate the Margin of Error
The Margin of Error is a value that estimates the percentage of sample points that can differ from real values.
- The formula to calculate the Margin of Error is:
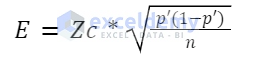
- E= Margin of Error
- Zc= Critical Value
- p′= the sample proportion
- n= the whole number of the sample population
Critical Values represent the rejection region of a hypothesis test.
The following image shows critical values for different confidence intervals.
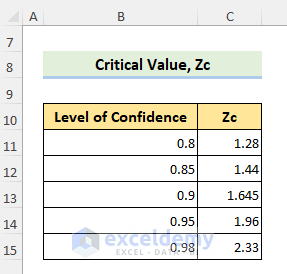
- To choose the correct Zc value from the list, use the following formula in C6.
=INDEX('Sample Data'!B11:C15,MATCH(C5,'Sample Data'!B11:B15,0),2)- Calculate the Margin of Error by using the following formula:
=C5*SQRT(C4*(1-C4)/C6)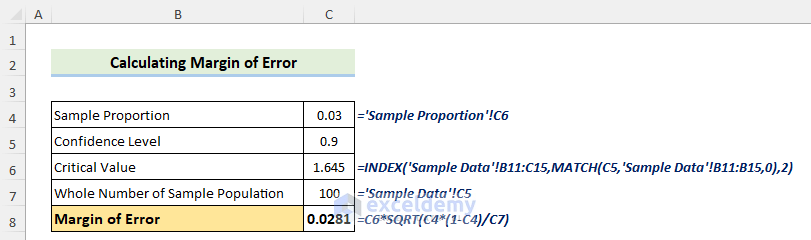
Step 3 – Calculate the Population Proportion
- Taking the Margin of Error into account, the following equation will represent the population proportion with a confidence interval:
- As the Margin of Error is 0.0281, we get the left and right boundary of population proportion as shown below:
p′- E = 0.03 + 0.0281 =0.0581
p′+ E= 0.03 – 0.0281=0.0019
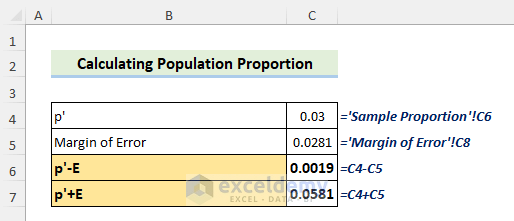
From the above inequality, we can conclude that the population proportion of redheads among the people in the New York State will be between 5.81% to 0.19%.
The normal distribution is shown in the image below. The population proportion will range between 0.19% to 5.81% for a confidence level of 90%. So, the range of population proportion for our sample problem will be:
0.0019 < P < 0.0581
Or,
0.19% < P < 5.81%
Read More: How to Calculate Confidence Interval for Population Mean in Excel
Download Practice Workbook
Download the practice workbook.
Related Articles
- How to Calculate P-Value from Confidence Interval in Excel
- Excel Confidence Interval for Difference in Means
- How to Calculate Confidence Interval Proportion in Excel
<< Go Back to Confidence Interval Excel | Excel for Statistics | Learn Excel
Get FREE Advanced Excel Exercises with Solutions!
