Confidence interval or CI is the measurement of the range of estimates for a particular parameter. This is an important concept in data analysis. As one of the most used data analysis programs, Microsoft Excel also provides means to calculate CI. In this article, we are going to discuss how to calculate the confidence interval for a population mean in Excel.
What Is Confidence Interval?
As mentioned earlier, the confidence interval is a measurement of the range of estimates for a parameter. In other words, it refers to the probability that the value of the parameter will be for a certain number of times. Confidence intervals are used often within 95 to 99 percent confidence level. A 0% confidence level indicates you will get no match if you make the same observations again. Meanwhile, a 100% confidence level indicates you will get the values within the same range. The confidence level interval at a certain confidence level indicates that you are that percent sure that the values will occur within the confidence interval.
The equation for the confidence interval is:
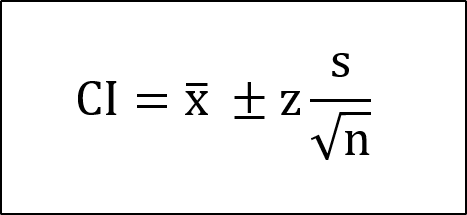
Where CI = confidence interval,
x̅ = sample mean,
z = confidence level value,
s = sample standard deviation,
n = sample size.
How to Calculate Confidence Interval for Population Mean in Excel: 4 Easy Ways
There are a total of four major ways you can calculate the confidence interval for a population mean in Excel. The main idea is the same, we need the mean and the standard deviation of the population. Then factoring in the confidence level value we get an upper limit and a lower limit value of the confidence interval range. We can calculate them individually through formulas. Or we can let Excel calculate all for us. All methods are included below. Go through them to see how they work or find the one you need from the table above.
For all the methods, we are going to use the following dataset.

We are going to calculate the confidence interval for the population mean of the ages in Excel.
1. Using Data Analysis Toolpak
In the first method, we are going to use the Data Analysis Toolpak add-in to calculate the confidence interval for a population mean in Excel. By default, this extension isn’t available in Excel. If you don’t have it, first follow these steps to enable the add-in.
Steps to Enable Data Analysis Toolpak:
- First, click on the File tab on your ribbon.
- Then select Options from the left of the backstage view.

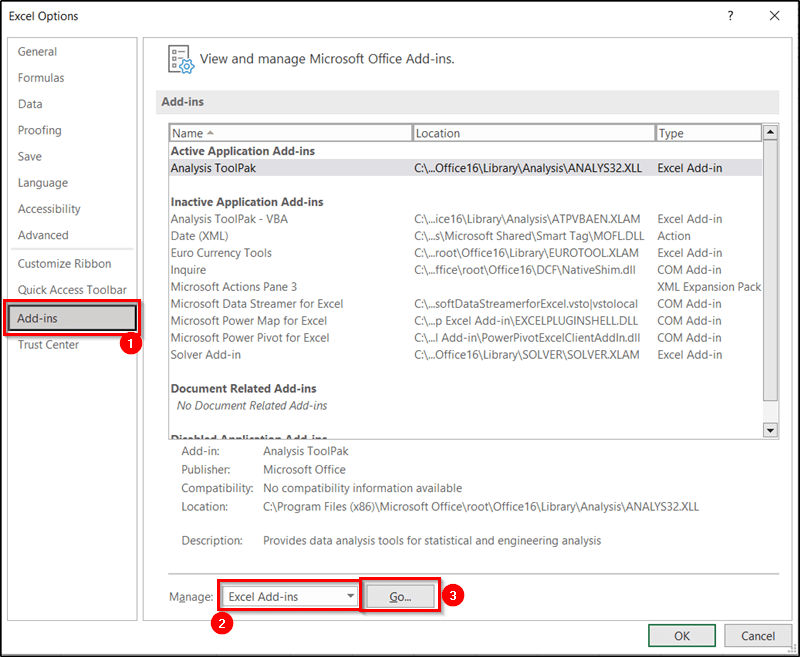
- Now click on Add-ins on the left of the Excel Options box.
- On the right, select Excel Add-ins beside Manage.
- Then click on Go.
- Next, check the Analysis Toolpak under the Add-ins available section of the Add-ins box.
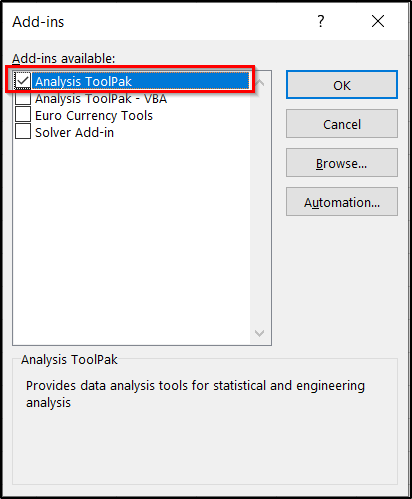
- Finally, click on OK.
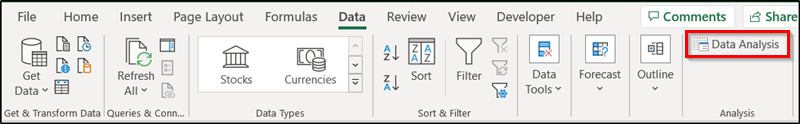
As a result, you will have the feature available under the Data tab.
Once you have the add-in checked in, you can follow these steps to find the confidence interval for the population mean in Excel.
Steps to Calculate Confidence Interval:
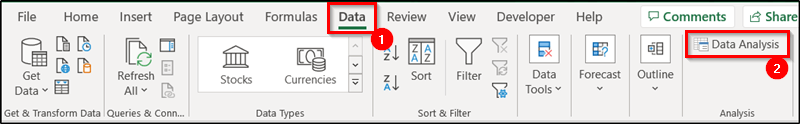
- First, select the Data tab on your ribbon.
- Then select Data Analysis from the Analysis group.
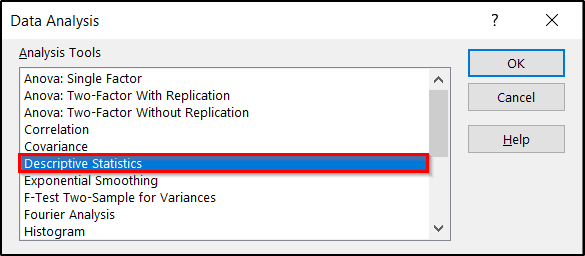
- Next, select the Descriptive Statistics tool in the Data Analysis box and click on OK.
- As a result, the Descriptive Statistics box will open up. Now insert the input range in the Input Range The range of our dataset is C4:C17.
- Then make sure the Columns is checked as the Grouped By
- Also, check the Labels in first row if you have one in the selection.
- In the Output options select the cell or worksheet/workbook you want the output to be in. Here, we are selecting cell E4 of the same spreadsheet.
- Next, check the Summary statistics
- After that, check the Confidence Level for Mean option and enter the value of the confidence level.
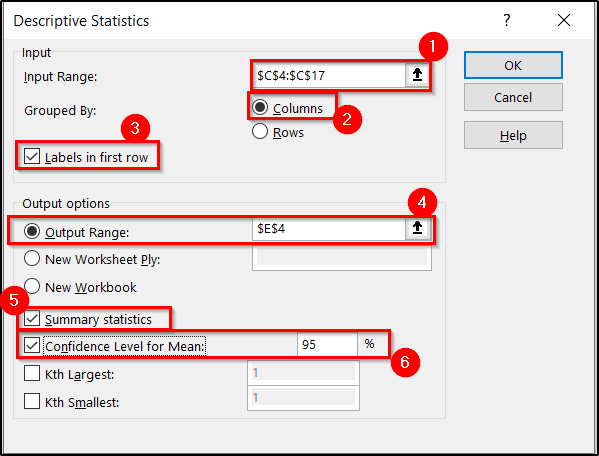
- Once you are done with all the steps, click on OK. The summary statistics will pop up on the selected cell like this.
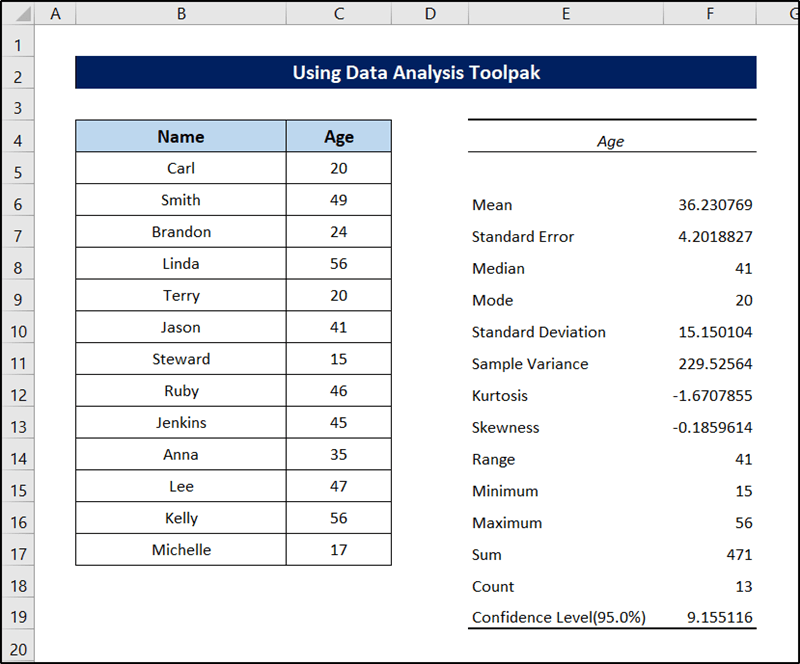
- Finally, let’s calculate the lower and upper bounds of the confidence intervals of the population mean now. For that, let’s select a cell (we are choosing cell C19 here) then write down the formula for the lower bound of the confidence interval.
=F6-F19
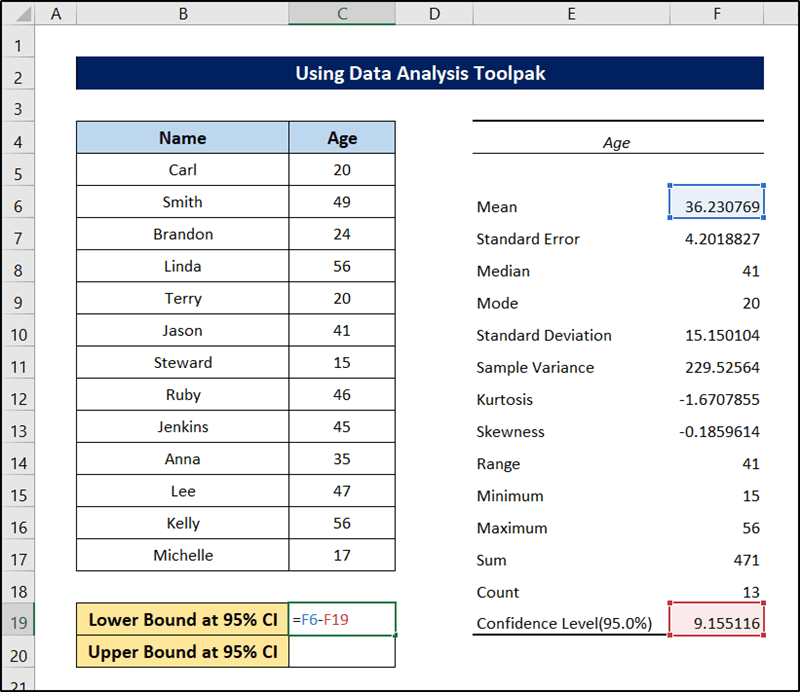
- Then press Enter.

- Similarly, select cell C20 for the upper bound and write down the following formula.
=F6+F19
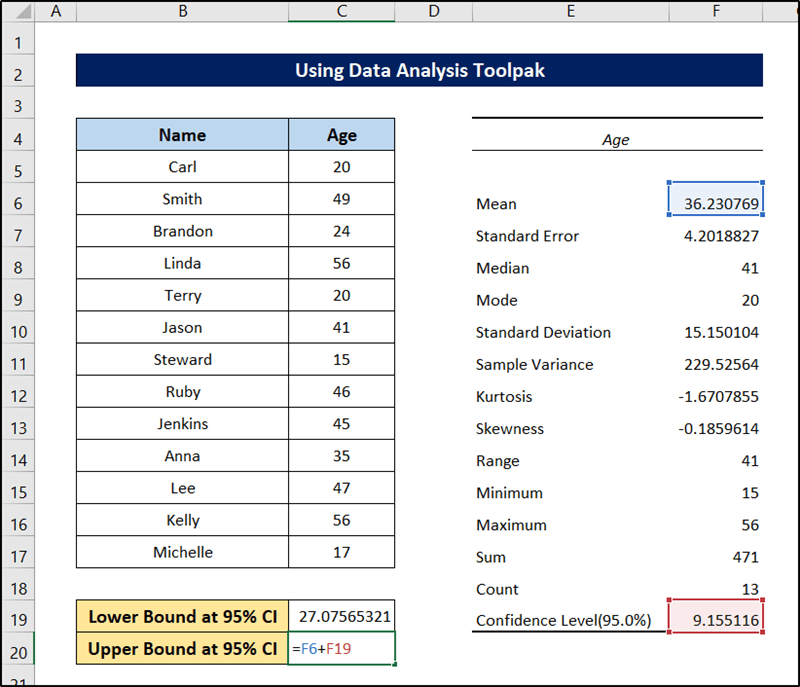
- Then press Enter.
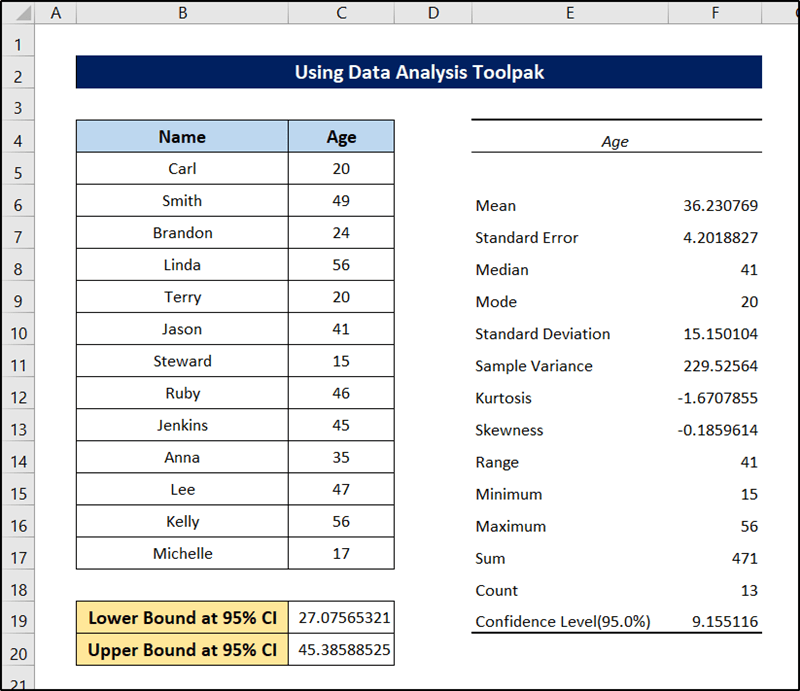
We will finally have both the values for the confidence interval for the population values in Excel in such a way.
2. Utilizing CONFIDENCE Function
From this point on, we are going to determine the mean, standard deviation, and other values required for the formula manually. Then we can determine the confidence level to find the confidence interval of the population mean in Excel. To find the confidence interval in this section, we are going to use the CONFIDENCE function.
The function takes three arguments- the alpha value of the confidence level, the value of the standard deviation, and the sample size. Then the function returns a value for the confidence level.
Besides that, we are also going to use the AVERAGE, STDEV.P, and COUNT functions to measure other parameters.
Follow these steps to see how we can utilize this function to get the confidence interval of the population mean of our dataset in Excel.
Steps:
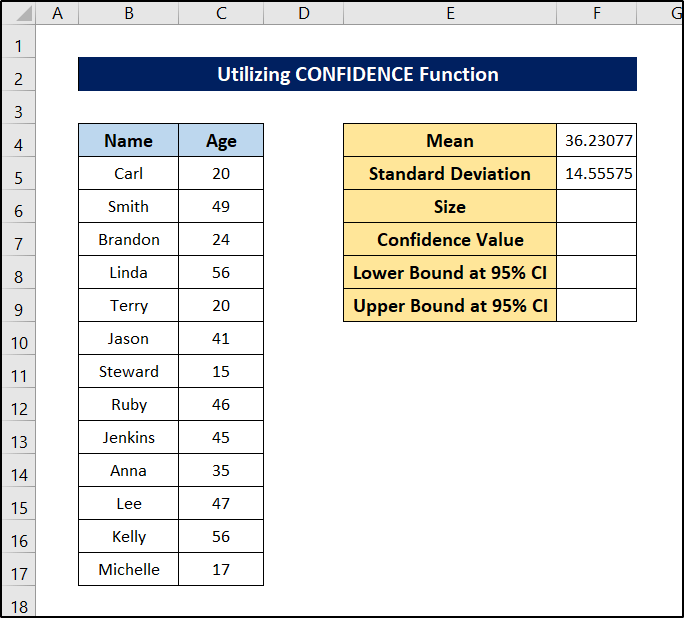
- First of all, let’s calculate the mean value of our sample data. For that, select cell F4 and write down the following formula.
=AVERAGE(C5:C17)

- After pressing Enter, we will get the mean value of the sample.

- Second, let’s calculate the standard deviation of the sample. For that, select cell F5 and write down the following formula.
=STDEV.P(C5:C17)

- Then press Enter.
- To count the size, select cell F6 and write down the following formula.
=COUNT(C5:C17)
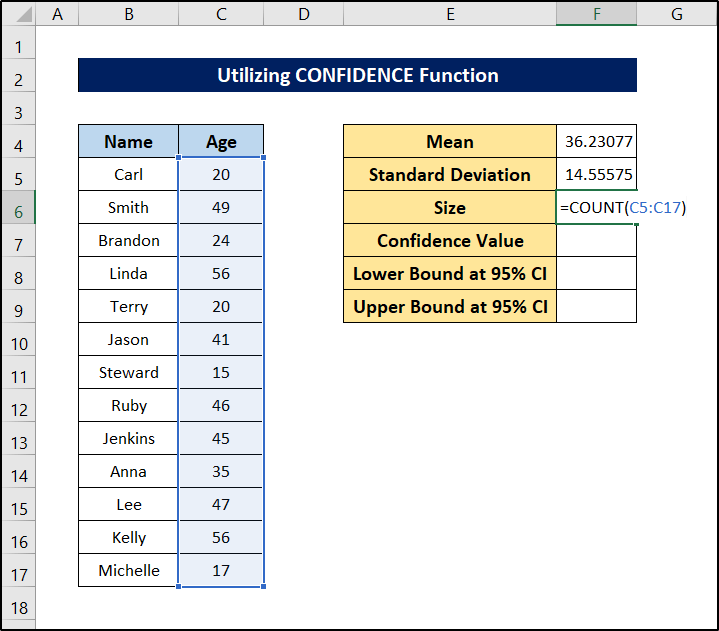
- After pressing Enter, we can get the size of the population.

- Finally, to calculate the confidence value, select cell F7 and write down the following formula.
=CONFIDENCE(1-0.95,F5,F6)
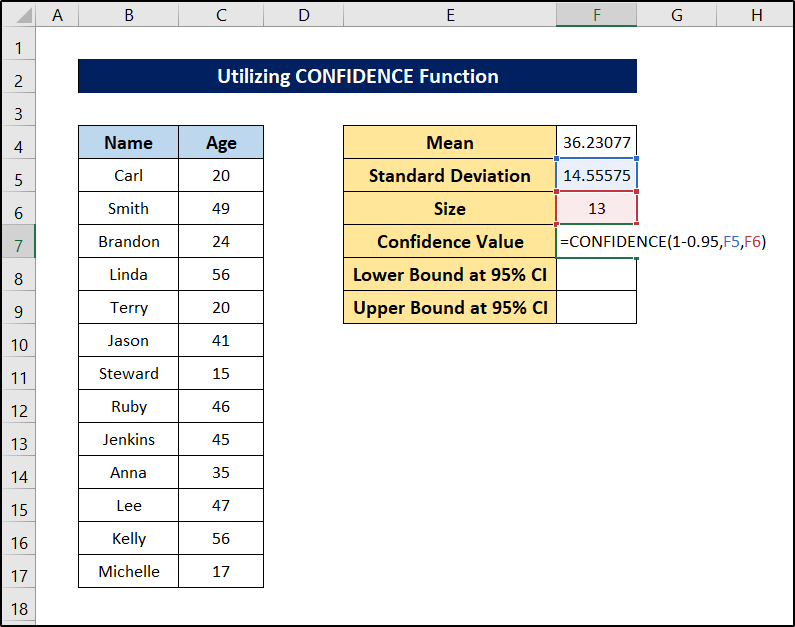
- After that, press Enter.

- Now select cell F8 and write down the following formula to find the lower bound of the confidence interval.
=F4-F7

- And then press Enter.

- Finally, select cell F9 and write down the following formula to find the upper bound of the confidence interval.
=F4+F7
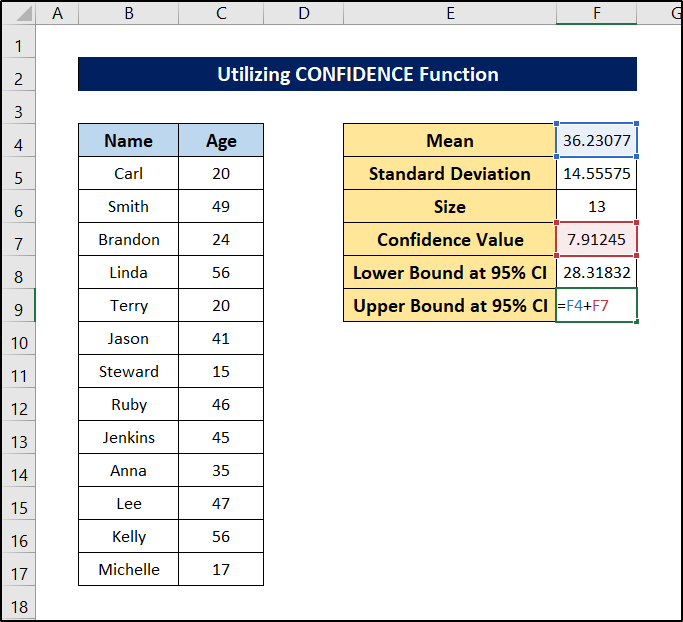
- After that, press Enter.

This is how we can find out the confidence interval for a population mean in Excel.
3. Employing CONFIDENCE.NORM Function
In this method, we are going to utilize the CONFIDENCE.NORM function instead to find out the confidence level of the data. This function takes the alpha value, the standard deviation and the sample size as arguments and returns the confidence level using the normal distribution. This function is used to measure the confidence value from the z distribution.
And similar to the previous method, we are going to utilize the AVERAGE, STDEV.P, and COUNT functions to measure the parameters.
Follow these steps to see the details procedure of the method.
Steps:
- First of all, let’s calculate the mean value of our sample data. For that, select cell F4 and write down the following formula.
=AVERAGE(C5:C17)
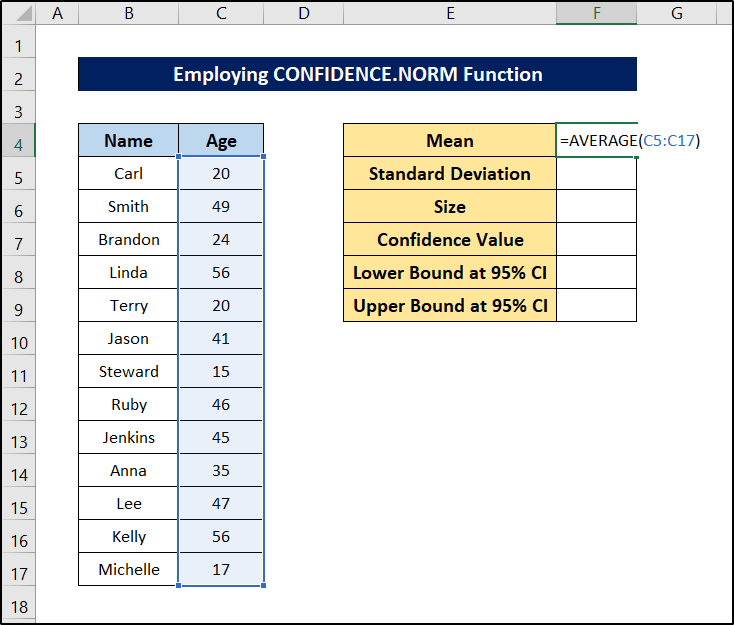
- After pressing Enter, we will get the mean value of the sample.

- Second, let’s calculate the standard deviation of the sample. For that, select cell F5 and write down the following formula.
=STDEV.P(C5:C17)
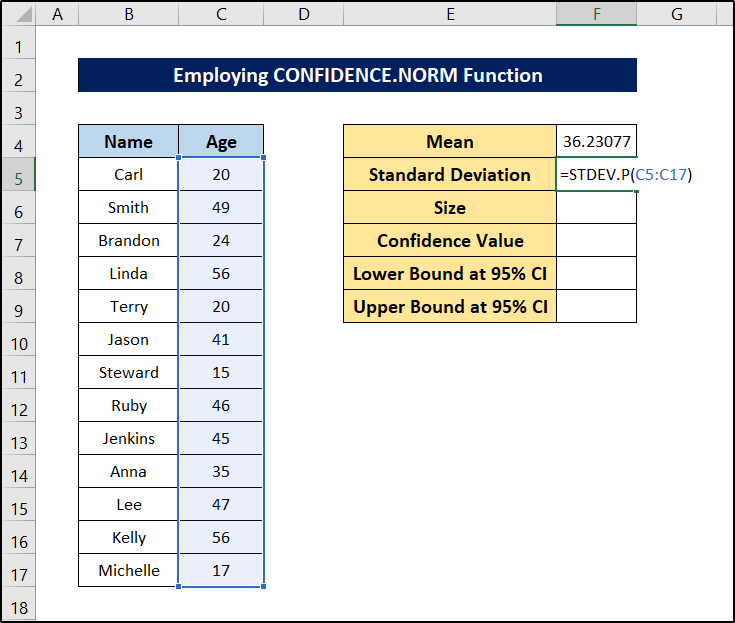
- Then press Enter.

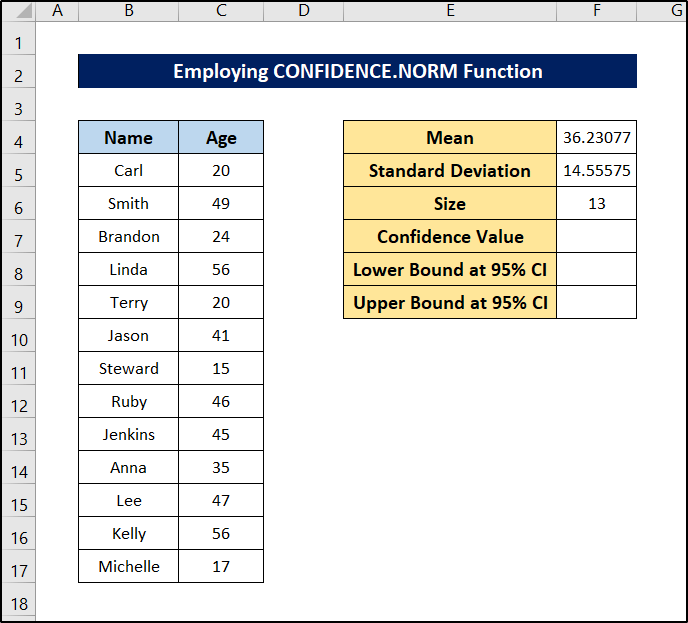
- To count the size, select cell F6 and write down the following formula.
=COUNT(C5:C17)

- After pressing Enter, we can get the size of the population.
- Finally, to calculate the confidence value, select cell F7 and write down the following formula.
=CONFIDENCE.NORM(1-0.95,F5,F6)
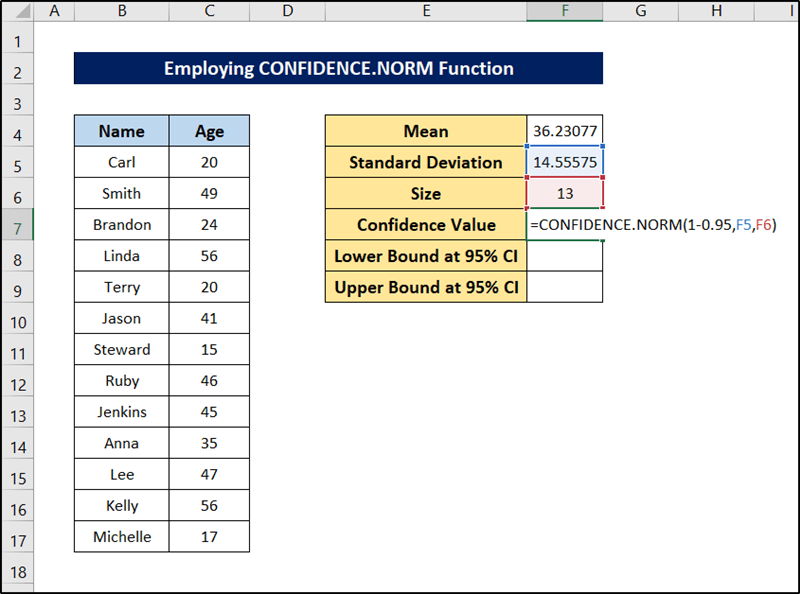
- After that, press Enter.

- Now select cell F8 and write down the following formula to find the lower bound of the confidence interval.
=F4-F7

- And then press Enter.

- Finally, select cell F9 and write down the following formula to find the upper bound of the confidence interval.
=F4+F7

- After that, press Enter.

This is another way to calculate the confidence interval for the population mean in Excel.
4. Using CONFIDENCE.T Function
Almost similar to the previous two methods, we are going to use the CONFIDENCE.T function to calculate the confidence value here. Similar to the functions used in the previous two functions, this function takes three parameters- the alpha value, the standard deviation, and the sample size. Then the function returns the confidence value from the T distribution’s standpoint.
We are also going to use the AVERAGE, STDEV.P, and COUNT functions to measure the parameters.
Follow these steps to see the detailed steps of the procedure.
Steps:
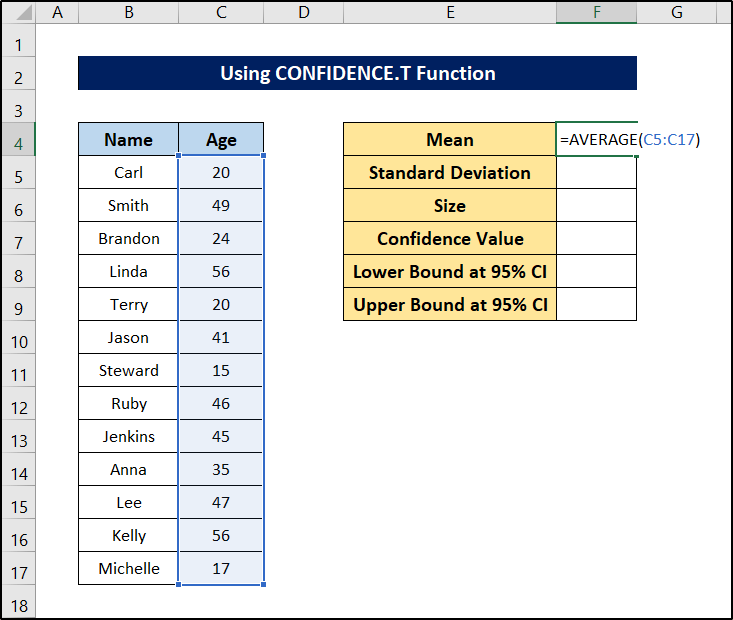
- First of all, let’s calculate the mean value of our sample data. For that, select cell F4 and write down the following formula.
=AVERAGE(C5:C17)
- After pressing Enter, we will get the mean value of the sample.

- Second, let’s calculate the standard deviation of the sample. For that, select cell F5 and write down the following formula.
=STDEV.P(C5:C17)
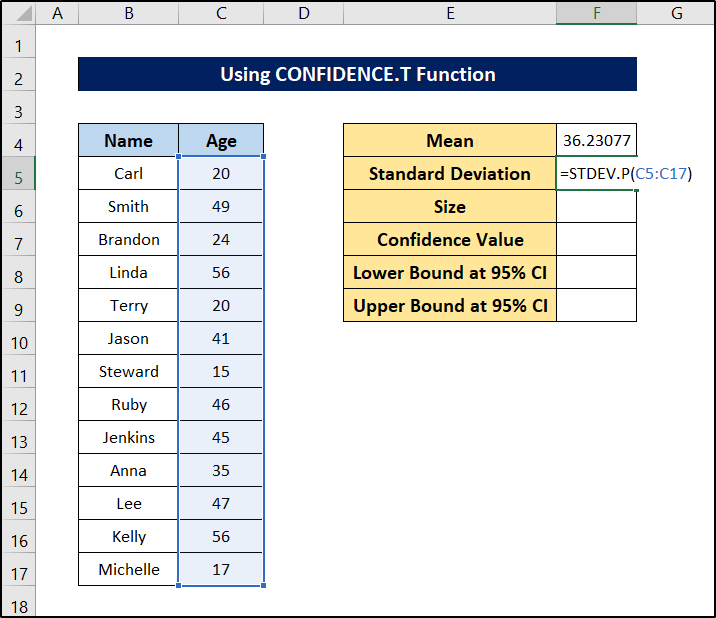
- Then press Enter.

- To count the size, select cell F6 and write down the following formula.
=COUNT(C5:C17)

- After pressing Enter, we can get the size of the population.

- Finally, to calculate the confidence value, select cell F7 and write down the following formula.
=CONFIDENCE.T(1-0.95,F5,F6)
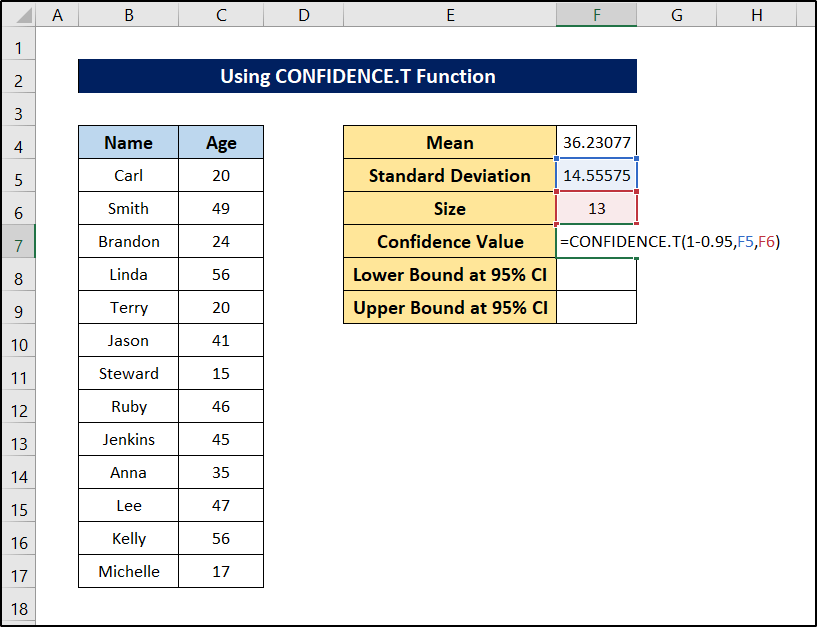
- After that, press Enter.

- Now select cell F8 and write down the following formula to find the lower bound of the confidence interval.
=F4-F7

- And then press Enter.

- Finally, select cell F9 and write down the following formula to find the upper bound of the confidence interval.
=F4+F7
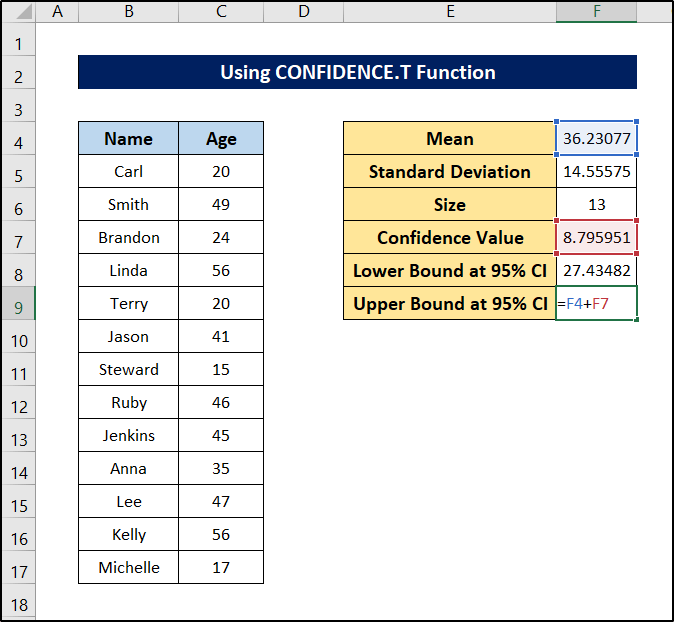
- After that, press Enter.

We can find out the confidence interval for the population mean in Excel in this way too.
Read More: How to Calculate Confidence Interval Without Standard Deviation in Excel
Download Practice Workbook
You can download the workbook used for the demonstration from the download link below.
Conclusion
These were all the methods we can follow to find the confidence interval for a population mean in Excel. Hopefully, you can use your desired method with ease now. I hope you found this guide helpful and informative. If you have any questions or suggestions, let us know in the comments below.
Related Articles
- How to Calculate P-Value from Confidence Interval in Excel
- How to Calculate Population Proportion in Excel
- How to Add Confidence Interval Error Bars in Excel
- Excel Confidence Interval for Difference in Means
- How to Calculate Confidence Interval Proportion in Excel
<< Go Back to Confidence Interval Excel | Excel for Statistics | Learn Excel
Get FREE Advanced Excel Exercises with Solutions!
