The standard deviation of any data collection can be calculated using the STDEV function in Excel. The standard deviation displays how far one value differs from another in terms of digits. This Excel article shows how to compute the standard deviation using the STDEV function in Excel.
STDEV Function: Syntax and Arguments
The STDEV function belongs to the Excel statistical functions category.
➧ Syntax
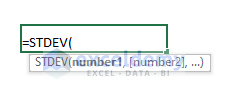
The Syntax for the STDEV Formula is:
STDEV(number1,[number2],…)
➧ Arguments
| Argument | Required/Optional | Explanation |
|---|---|---|
| number1 | Required | This is the primary number argument that compares to a sample of a population. |
| number2 | Optional | This is the number argument that compares to a sample of a population. |
➧ Return Value
Estimated standard deviation.
Simplification of the STDEV Function in Excel
Before we get into how to utilize the STDEV function, let’s have a look at the statistical ideas that are used in this function. In statistics, the standard deviation is a crucial indicator of central tendency and dispersion. The standard deviation is calculated using the formula below:
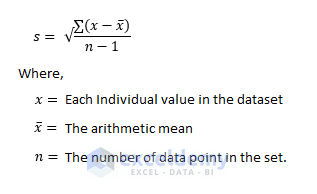
One of the values is the mean or average of the numbers, and n is the overall sample size in this calculation. The standard deviation is a measurement of how much each value in a sample deviates from the average. It is the square root of the variance, in a nutshell. The average of a dataset is a squared variation from the mean or average, which is called variance.
STDEV Function in Excel: 3 Examples
For determining how far individual data are from the average value we widely use STDEV. For calculating the standard deviation, we can use the STDEV function, depending on whether the data set is a sample or represents the complete population.
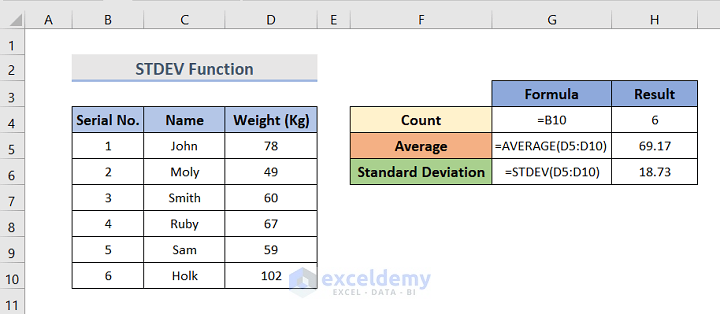
Let us take a look at the following example. We have a dataset of six people’s weights and their serial numbers. We can orally calculate the average weights. Now, we want to calculate the standard deviation of their weights.
STEPS:
- First, we need to select the cell where we want the value of the standard deviation.
- Next, write down the formula. The formula for calculating standard deviation is like this:
=STDEV(D5:D10)- We can see the formula in cell G6, shown in the picture below.
- Finally, the standard deviation for values in cells D5 through D10 would be calculated as a result of this, and we can see the result in cell H6.
Now, we will see the other STDEV functions.
1. Using STDEV.S Function
The STDEV.S function in Excel estimates the standard deviation for a collection of data in a sample. STDEV.S is a replacement for the earlier STDEV function, and it behaves in the same way. We are using the same dataset which contains the weights of some people with their serial numbers. So, to calculate the standard deviation of their sample weights.
STEPS:
- Likewise, in the STDEV function, select the cell where the value of the standard deviation would appear.
- Then, simply write down the formula:
=STDEV.S(D5:D10)- We take in the formula in cell G6.
- At last, the standard deviation would be calculated which we can see in cell H6.

2. Using STDEV.P Function
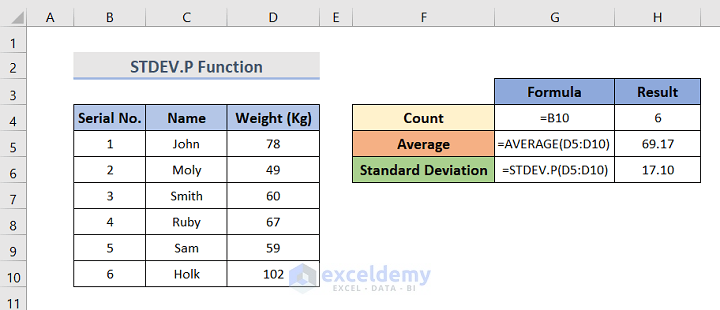
The STDEV.P function in Excel estimates the standard deviation for a collection of data in a sample. STDEV.P uses the “n” method to calculate standard deviation, ignoring logical values and text.
Assuming we are using the same dataset as before. Now, the steps are as similar as before. We just need to write the function and the formula like below:
=STDEV.P(D5:D10)The main purpose of the STDEV.P function is to get the standard deviation of the population.
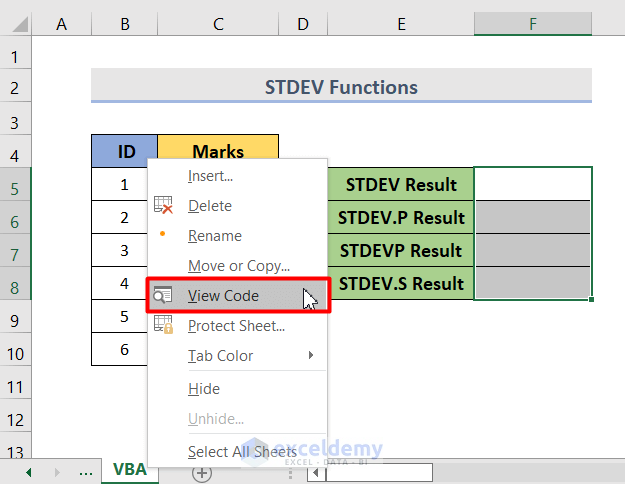
3. STDEV Example in VBA
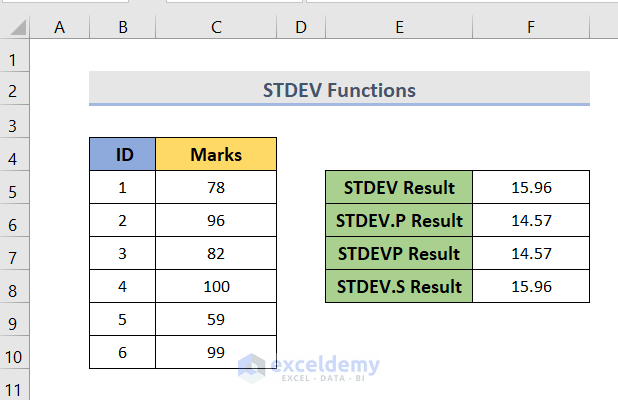
We can also use the STDEV function in VBA. In the following dataset, there are some Student marks with their ID numbers. So now we want to see the results of standard deviation using STDEV, STDEV.P, STDEVP, and STDEV.S functions. Sequentially, the names of the functions are in cells E5 to E8. The results will be shown back-to-back in each function’s right cell which is in column F, after using the VBA code.
application.worksheetfunction.stdev(number1,number2)STEPS:
- At first, open the visual basic editor by right-clicking on the sheet from the sheet bar and then going to View code.
- After that, write down the VBA code here.
VBA Code:
Sub Sd()
Dim Sd As Single
Range("F5") = Application.WorksheetFunction.StDev(Range("C5:C10"))
Range("F6") = Application.WorksheetFunction.StDev_P(Range("C5:C10"))
Range("F7") = Application.WorksheetFunction.StDevP(Range("C5:C10"))
Range("F8") = Application.WorksheetFunction.StDev_S(Range("C5:C10"))
Debug.Print Sd
End Sub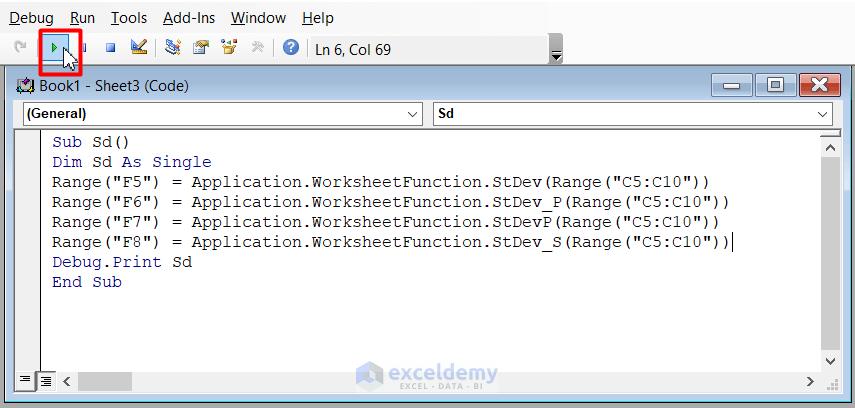
- Then, Run the code. This will insert a new column and align all the duplicate values in this new column from the two sets of data. And we can see our desired result.
STDEV Function Errors in Excel
- #DIV/0! error occurs if the STDEV function is called with fewer than two numeric values. (Note that the STDEV function does not recognize text representations of numbers that are supplied as part of an array of cells as numeric values.)
- If any of the values passed straight to the STDEV function are text values that cannot be converted to numeric values, #VALUE! the error will occur.
Things to Remember about the STDEV Function in Excel
- Arguments must give the function with two or more numeric values.
- The STDEV function accepts numeric inputs in the range of 1 to 255.
- As arguments, we can use numbers, arrays, and references to numbers.
- STDEV function ignores the text and logical values that occur in references but evaluates the text and logical hardcoded as function arguments.
Download Practice Workbook
You can download the workbook and practice with them.
Conclusion
Hope this will help you! If you have any questions, suggestions, or feedback, please let us know in the comment section.
<< Go Back to Excel Functions | Learn Excel
Get FREE Advanced Excel Exercises with Solutions!
