When you want to gather any formation based on a large population, things get difficult sometimes to capture this huge number of people. In that case, we tend to go for the confidence interval which is calculated for a small group of people, that represent the whole population. In Microsoft Excel, we can easily calculate the confidence interval based on their proportion. Therefore, in this article, we will guide you on how to calculate confidence interval proportion in Excel with 2 useful examples.
What Is Confidence Interval?
Before starting the calculation, we must understand the confidence interval first. According to statistics, it is basically a probability of a specific parameter that falls between a couple of values. Confidence interval measures the level of certainty of uncertainty in a trial process.
Now, in the case of proportion, the confidence interval provides a range of values that contains a proportion of the population with a level of confidence in a specific sample test. The values show the confidence interval proportion for both high and low estimations.
Mathematical Formula of Confidence Interval for Proportion
To calculate the confidence interval for proportion, we have to use this formula.
Here,
p = Proportion of Success
z = Chosen z-Value
n = Sample Size
In the formula, the z-value is dependent on the confidence level which generally differs from 90% to 99%. Moreover, the relationship between the z-value and the confidence interval is always proportional. The confidence interval for proportion is always calculated for both the upper and lower bound.
How to Calculate Confidence Interval for Proportion in Excel: 2 Practical Examples
Finally, we will start calculating the confidence interval for proportion with 2 examples. Here, we will do the calculation with the mathematical formula that we described above. Along with it, we will also apply the Excel formula for the calculation. So, without further delay, let’s go through the calculation.
Example 1: Find Confidence Interval Proportion with Excel Formula
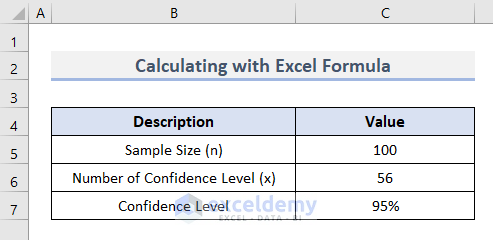
To illustrate the process, let us assume we have run a survey on 100 students to find out the proportion of their acceptance of the new curriculum. Seems like, out of 100, 56 students have agreed on the new curriculum with a confidence level of 95%. Now, taking these parameters, let us find out the confidence interval for the proportion of this case.
- In the beginning, insert the values of Sample Size, Number of Confidence Levels and rate of Confidence Level in the cell range C5:C7.
- Then, calculate the Proportion of Success with this formula in cell C8 and press Enter.
=C6/C5
- Along with it, find out the Proportion of Failure as well in cell C9.
- For this, type this formula and hit Enter.
=1-C8
- Now, calculate the Alpha value based on the Confidence Level with this formula in cell C10.
=1-C7- Following, press Enter.

- Next, type this formula in cell C11 and press Enter to get the z-value for a 95% Confidence Level.
=ABS(NORM.S.INV((C10)/2))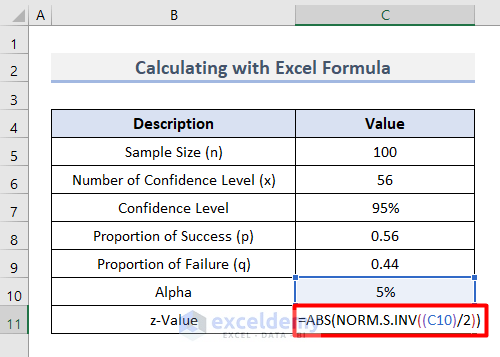
- Lastly, insert this formula to get the Margin of Error for proportion in cell C12.
=C11*SQRT(C8*C9/C5)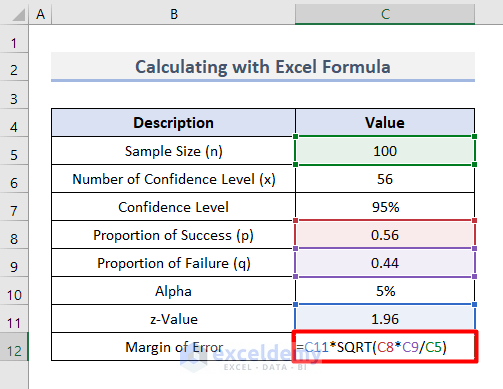
- Lately, hit Enter and you will get all the parameters that we will need for the final calculation.

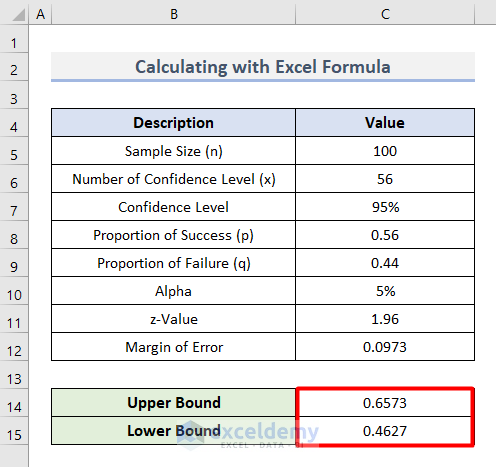
- Now, type this formula in cell C14 to calculate the Upper Bound.
=C8+C12
- Also, apply this formula for calculating Lower Bound in cell C15.
=C8-C12
- Finally, hit Enter.
- That’s it, you can now see the true proportion of the confidence interval based on the survey.
Example 2: Calculate Confidence Interval Proportion with Mathematical Formula
In this section, we will take the same case scenario for calculation. The only difference is that we will find out the proportion of the confidence interval by calculating it with the mathematical formula. Let’s see how it works.
- First, insert all the parameters up to z-Value in the cell range B5:C11 that we got from the example above.
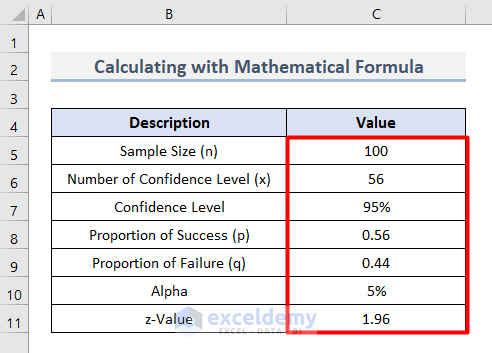
- Now, insert this mathematical formula in cell C12 to calculate the Margin of Error.
=C11*((C8*C9)/C5)^0.5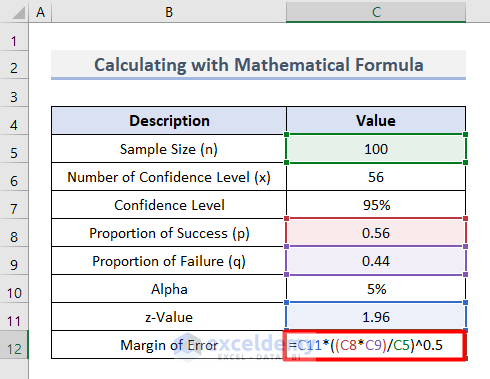
- After this, hit Enter to get the output.

- Next, type this formula in cell C14 to calculate Upper Bound.
=C8+C12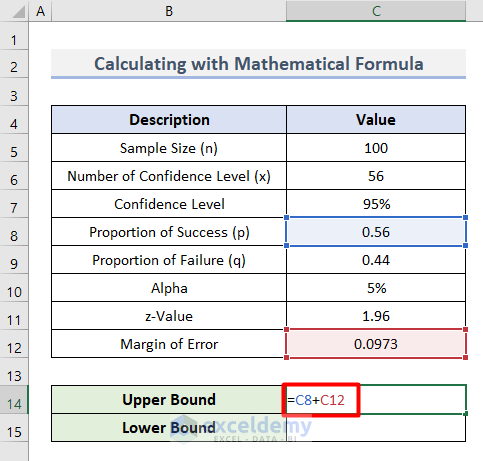
- Lastly, get the Lower Bound value in cell C15 with this formula.
=C8-C12
- Finally, hit Enter.
- That’s it, you can see that the true proportion values of confidence intervals are the same for any type of formula.

How to Calculate Confidence Interval for Difference in Proportion in Excel
So far, we calculated the confidence interval for a single bunch of students. Let us consider now two groups of students where each group has 100 people. But the confidence levels are 56 and 46 respectively. The basic formula to calculate the difference is as follows,
Where,
p1, p2 = Proportion of sample 1 and sample 2
n1, n2 = Sample size of sample 1 and sample 2
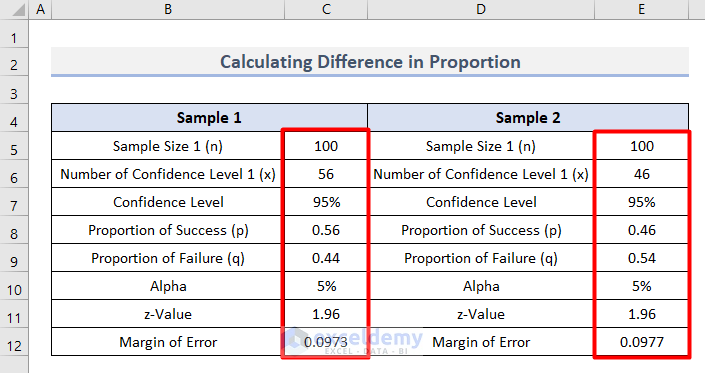
Now, we will calculate the confidence interval for the difference in proportion among these two groups for a confidence level rate of 95%.
- First, insert all the parameters for each group in the cell range B5:E12.
- Then, type this formula in cell C14 to get the difference in Upper Bound.
=(C8-E8)+(C12+E12)
- Press Enter.
- Lastly, insert this formula to calculate the difference of proportion in the Lower Bound in cell C15.
=(C8-E8)-(C12+E12)
- Finally, hit Enter.
- That’s it, you will get the difference in proportion between the two groups’ acceptance of the new curriculum.

Download Practice Workbook
Get this sample file to try the process by yourself.
Conclusion
Concluding the article, I hope that you have got a clear understanding of how to calculate confidence interval proportion in Excel with 2 useful examples. Let us know your insightful suggestion in the comment box.
Related Articles
- How to Calculate P-Value from Confidence Interval in Excel
- How to Calculate Population Proportion in Excel
- How to Calculate Confidence Interval Without Standard Deviation in Excel
- How to Add Confidence Interval Error Bars in Excel
- How to Calculate Confidence Interval for Population Mean in Excel
- Excel Confidence Interval for Difference in Means
<< Go Back to Confidence Interval Excel | Excel for Statistics | Learn Excel
Get FREE Advanced Excel Exercises with Solutions!
