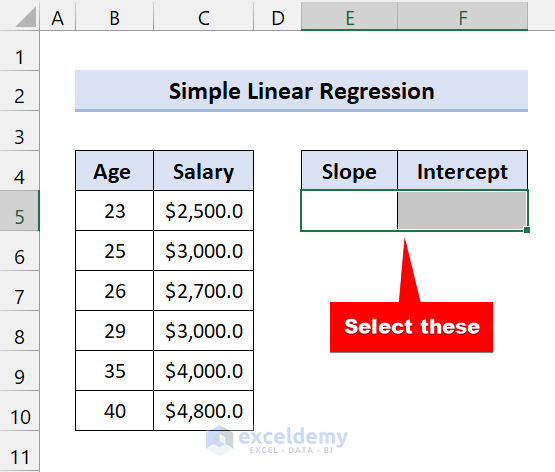
Method 1 – Simple Linear Regression Using the LINEST Function
Steps
- Select the range of cells E5:F5.
- Type the following formula:
=LINEST(C5:C10,B5:B10,TRUE,FALSE)Here, Age = x and Salary = y
- Press Ctrl+Shift+Enter.
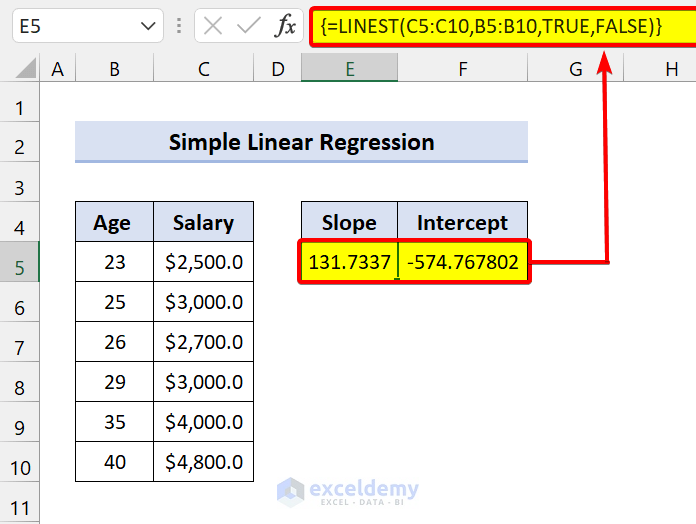
We have a slope of 131.7337. It means that when Age increases by 1, salary increases by $131.7337.
So, if the Age is 24, the salary will be:
Salary = $131.7337*24+(-574.7678)
= $2586.842
We used the LINEST function of Excel here.
Method 2 – Multiple Linear Regression in Excel
Steps
- Select the range of cells F5:H5.
- Type the following formula:
=LINEST(D5:D10,B5:C10,TRUE,FALSE)- Press Ctrl+Shift+Enter.
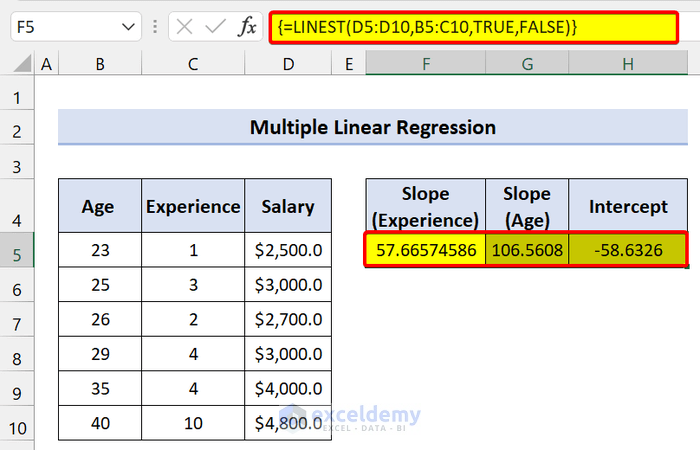
We found all the values using the LINEST function in Excel.
Method 3 – LINEST Function to Predict Dependent Variable for Simple Linear Regression in Excel
Steps
- Type any of the following formulae in cell G5:
=SUM(LINEST(C5:C10,B5:B10,TRUE,FALSE)*(E5:F5))
Or,
=SUMPRODUCT(LINEST(C5:C10,B5:B10,TRUE,FALSE)*(E5:F5))
Or,
=SUMPRODUCT(LINEST(C5:C10,B5:B10,TRUE,FALSE)*{37,1})
- Press Enter or Ctrl+Shift+Enter.
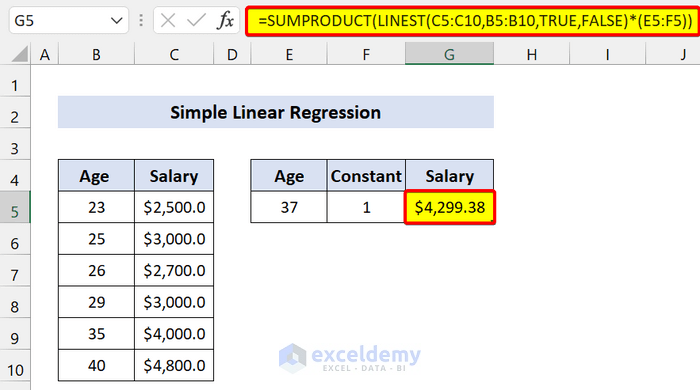
We found the dependent variable salary based on Age using the LINEST function.
To verify this, we are using the y=mx + b formula. Find the Slope and intercept as we showed earlier. Type the following formula:
=E8*37+F8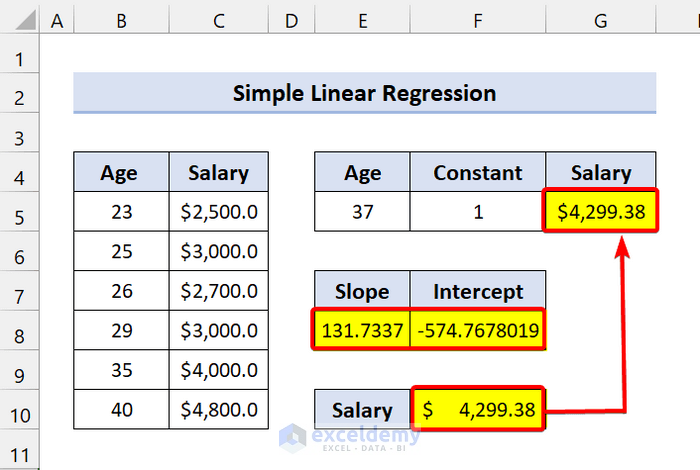
The result is the same as before.
Method 4 – LINEST Function to Predict Dependent Variable for Multiple Linear Regression in Excel
Steps
- Type any of the following formulae in cell I5:
Regular Formula:
=SUMPRODUCT(LINEST(D5:D10,B5:C10,TRUE,FALSE)*(F5:H5))
Or,
Array Formula:
=SUM(LINEST(D5:D10,B5:C10,TRUE,FALSE)*(F5:H5))
Or,
=SUM(LINEST(D5:D10,B5:C10,TRUE,FALSE)*{5,28,1})
- Press Enter or Ctrl+Shift+Enter.
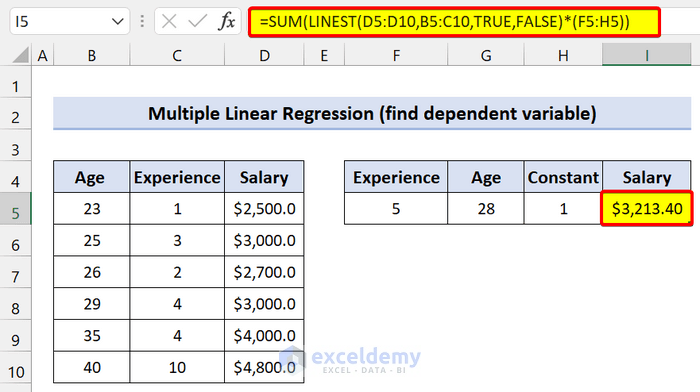
We used the LINEST function to find the Salary based on Experience and Age.
To verify this, we are using the formula: y = m2x2 + m1x1 + b
Find the Slope and intercept as we showed earlier. Type the following formula in cell G10:
=F8*5+G8*28+H8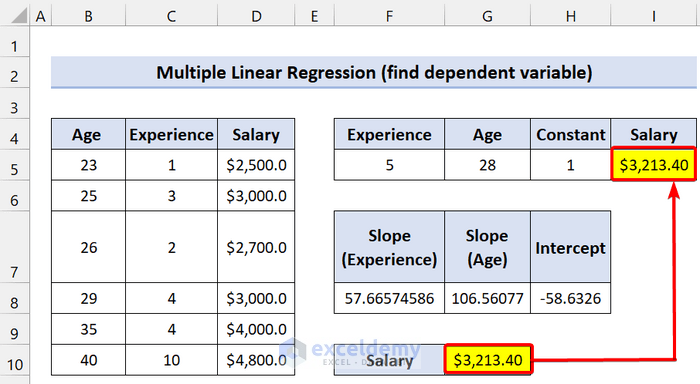
See our LINEST function gave the exact result, like using the Linear Regression formula.
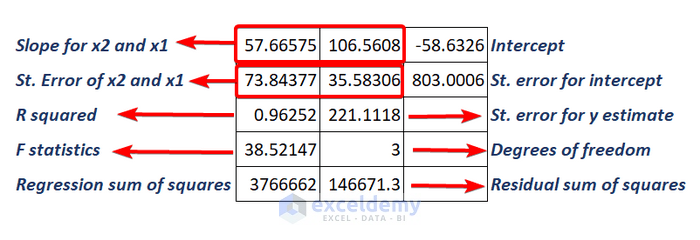
Additional Regression Statistics by LINEST Function in Excel
We set the [stats] to FALSE. We did it because we didn’t want additional statistics. If you want the regression analysis, set it to TRUE.
For simple linear regression, use the following formula:
=LINEST(C5:C10,B5:B10,TRUE,TRUE)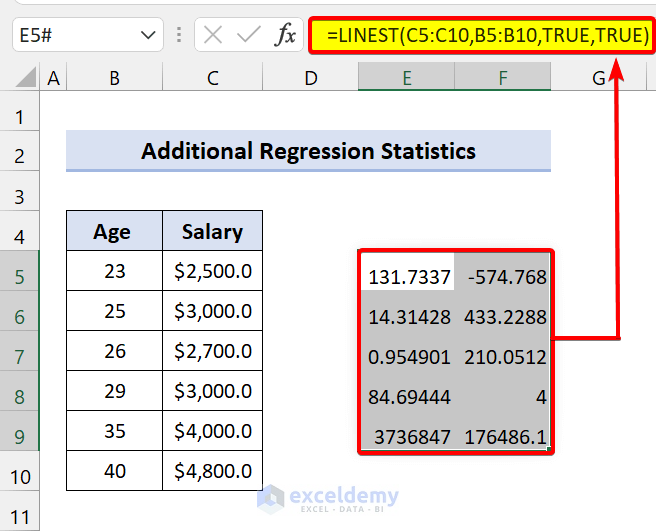
For multiple linear regression, type the following formula:
=LINEST(D5:D10,B5:C10,TRUE,TRUE)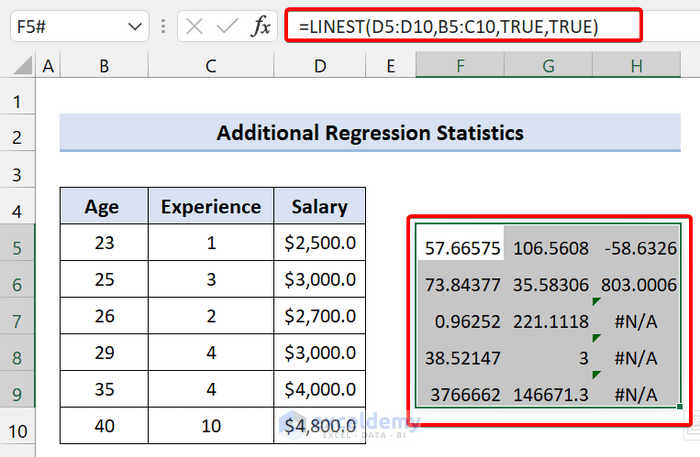
To remove the #N/A error, type the following formula:
=IFERROR(LINEST(D5:D10,B5:C10,TRUE,TRUE),"")Look at the following screenshot to know the meaning:
Things to Remember
✎ If you omit the [const] argument, it will be considered TRUE. And our equation will be y=mx+b. But if you set it to FALSE, it will consider the constant 0. And equation will be y=mx.
✎ If the known_x’s and known_y’s ranges have different dimensions, it will show #REF! Error
✎ If known_x’s or known_y‘s contains at least one blank cell, text value, or a text representation of a number, it will show #VALUE! Error
✎ Also, if the const or stats argument cannot be evaluated as TRUE or FALSE, it will show the #VALUE error.
Download Practice Workbook
Download this practice workbook.
<< Go Back to Excel Functions | Learn Excel
Get FREE Advanced Excel Exercises with Solutions!
