Method 1 – Calculating the Standard Error of the Regression Slope with a Scatter Chart in Excel
STEPS:
- Select cell (B4:C9).
- Go to the Insert tab.
- Click on the ‘Insert Scatter (X, Y) or Bubble Chart’ Icon.
- Select the first scatter chart.
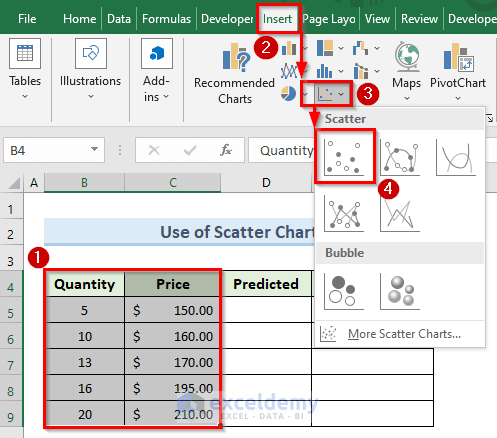
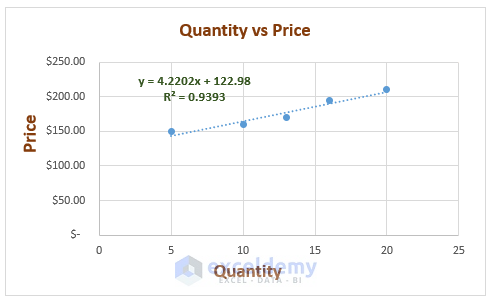
- A chart like the following image will appear. We can see data points on the chart.
- Right-click on any data point and select the option ‘Add Trendline’.
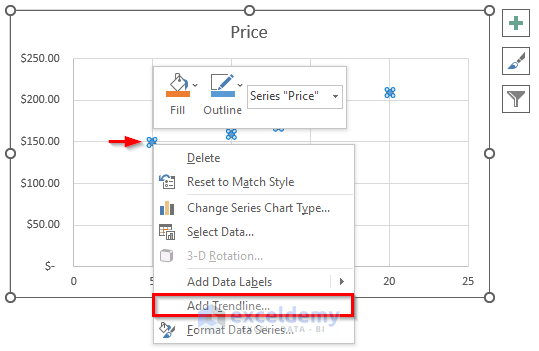
- The above action will insert a trendline in the graph.
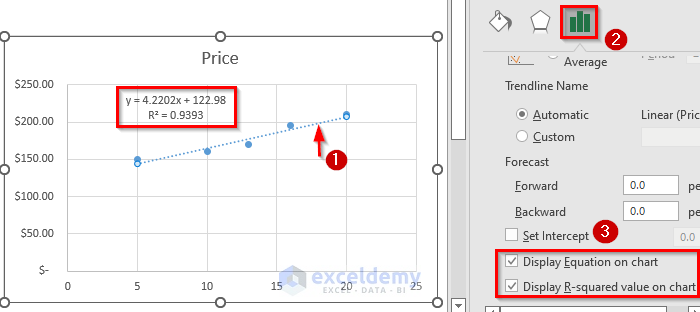
- Click on the trendline.
- Go to the Trendline Options.
- Check the options ‘Display Equation on chart’ and ‘Display R-squared value on chart’.
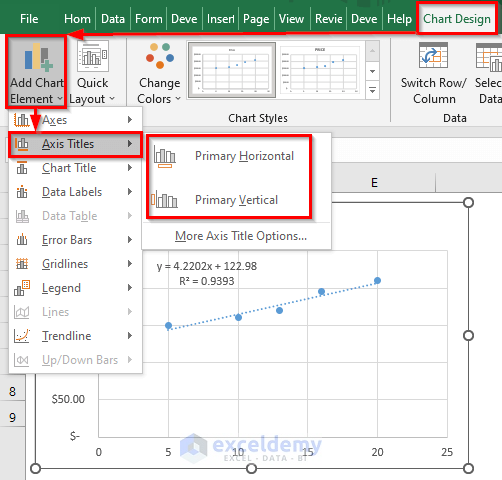
- Select the chart.
- Go to Chart Design > Add Chart Element > Axis Title.
- Set axis titles using the option ‘Primary Horizontal’ and ‘Primary Vertical’.
- Our table will look like the following image.
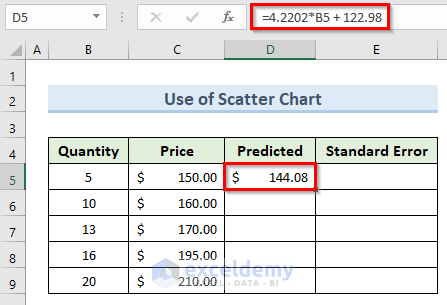
- Following the trendline equation, insert the below formula in cell D5:
=4.2202*B5 + 122.98- Press Enter.
- We get the predicted price from the trendline in cell D5.
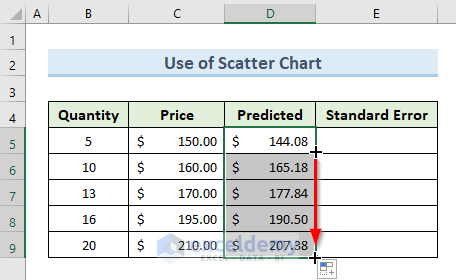
- Drag the Fill Handle tool from cell D5 to D9.
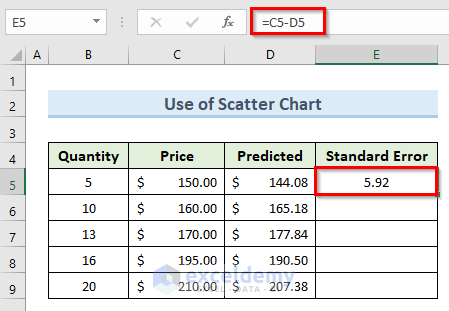
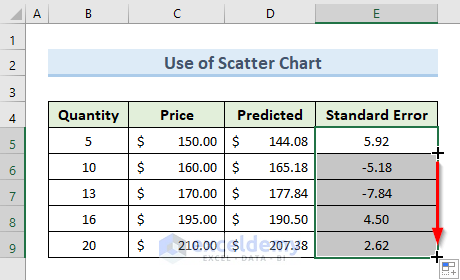
- Insert the following formula in cell E5:
=C5-D5- Press Enter.
- We get the standard error for the first point in cell E5.
- Drag the Fill Handle tool from cell E5 to E9.
- We get standard errors of regression slope for all the data points.
Method 2 – Applying the Excel LINEST Function to Calculate Standard Error Along with Uncertainty of Regression Slope
STEPS:
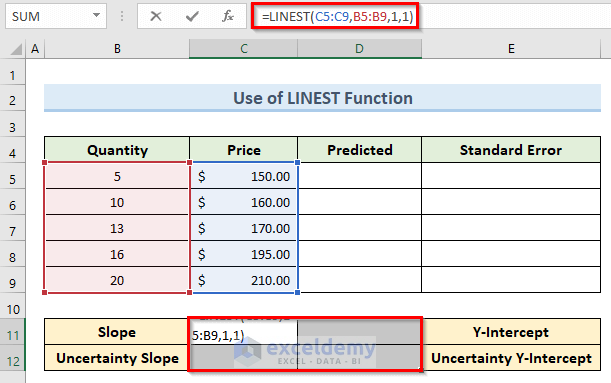
- Select cells (C11:D12).
- Enter the following formula in cell C11:
=LINEST(C5:C9,B5:B9,1,1)- Don’t press Enter. Press Ctrl + Shift + Enter since it is an array formula.
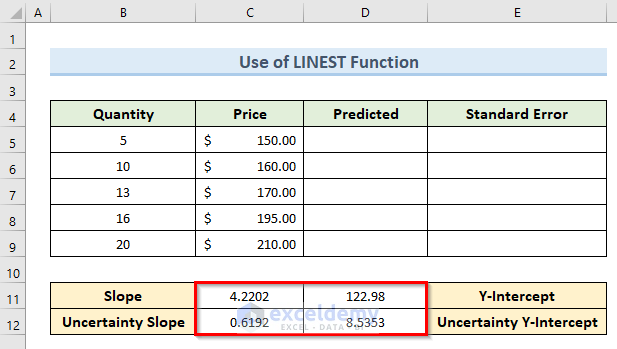
- The above command will give results like the following image.
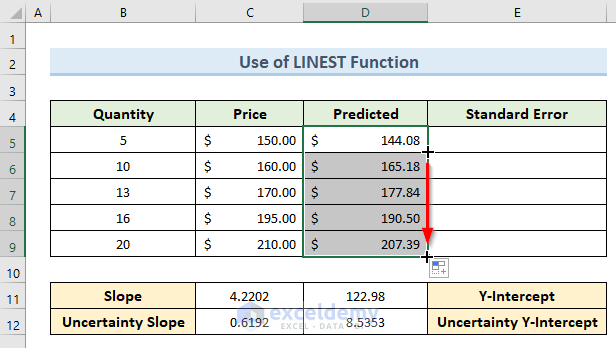
- Insert that formula in cell D5:
=$C$11*B5+$D$11- Press Enter.
- We get the predicted price in cell D5.
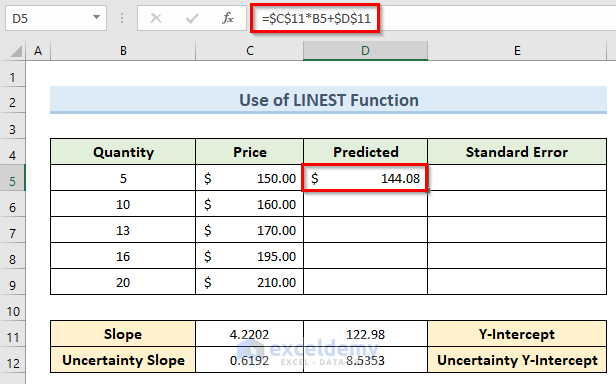
- Drag the Fill Handle tool from cell D5 to D9.
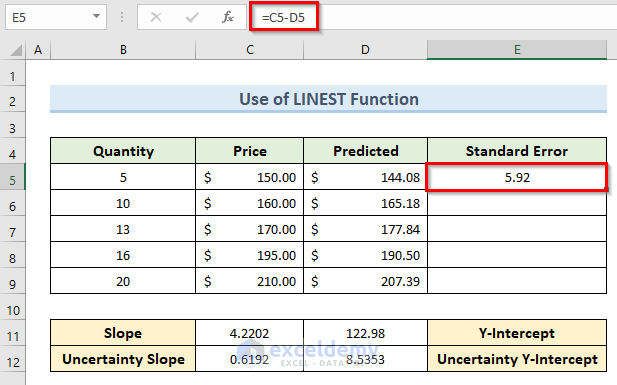
- To calculate the standard error, insert the following formula in cell E5:
=C5-D5- Press Enter.
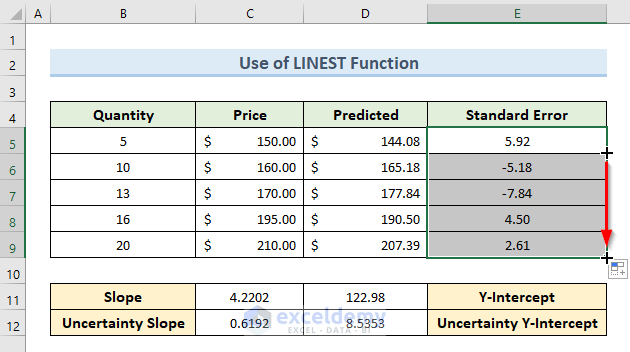
- Drag the Fill Handle tool from cell E5 to E10.
- We get standard errors of regression slope for all the data points.
Download Practice Workbook
You can download the practice workbook from here.
Related Articles
<< Go Back to Excel for Statistics | Learn Excel
Get FREE Advanced Excel Exercises with Solutions!
