Want to analyze business or any data in Excel?
You have to master some common statistical ways.
Excel is just a tool, how sharply you can use this tool for your data analysis, depends on how well you know the data analysis methods.
I have shared here some of the statistical terms that are most used in data analysis.
The terms I am going to introduce you with are:
- Samples
- Sample Size
- Standard Deviation
- Central Limit Theorem
- Standard Error
- Standard Score / Sigma / Z-Score
- Bell Curve / Gaussian distribution / Normal Distribution
- Margin of Error
- Confidence Level
- Confidence Interval
Samples and Sample Size
I am going to present the concept with simple examples. As my course is both for non-statisticians and statisticians, so I tried my best to keep things simple and straight forward.
Read More: Multiple Regression Analysis with Excel
Let’s assume that you run a grocery store. You have a machine to fill sugar into bags. When filled with sugar, your every bag should have 250 grams of sugar. Now your store has 1000 of bags already filled with sugar. You are a very honest person, and you will not cheat your customers.
So you want to weigh the bags to check whether every bag has 250 grams of sugar. As an owner of a small store in the town, you can afford only one employee in your store. And for that employee, it is tough to weigh every bag. So, you tell your employee to pick 10 bags arbitrarily.
That is your first sample. 10 bags. As the sample has 10 bags, so sample size, N is 10. The sample size is denoted by the capital letter N.
Your employee weighs 10 bags one by one manually and records the weights like the following:

Sample 1 contains values of 10 bags and Sample 2 contains data of 25 bags.
So, you get the data points of your first sample.
Now you decide to pick some bags by yourself. You pick 25 bags arbitrarily. This is your second sample and the sample size of the second sample is 25 as you have picked 25 bags to check.
Now your employee weighs these 25 bags and records the weights of the bags as in the image above.
So I think you have got a clear idea on Sample and Sample Size.
Standard Deviation
Now let’s talk about standard deviation. It is always better to work with a sample that has a higher number of data points, so I am taking the second sample to calculate the standard deviation.
The Standard Deviation is a measure of how spread-out numbers are. I am not going to talk about how standard deviation works. Mathisfun.com has a great article on standard deviation and variance. Please check it out here. In the link, you will also get some questionnaires to judge your understanding.
I have used the STDEV.P Excel function to find out the standard deviation of the 25 data points of the second sample. The result is 8.02
Read More: How to Calculate/Find Mean and Standard Deviation in Excel
Central Limit Theorem
Central Limit theorem is a statistical theorem. I am not going to describe this theory in technical language. That will call for mathematical equations. In this article, I am going to give a practical example and then I will introduce you with the Central Limit theorem.
For example, you are going to find out the average age of Egypt people. We are assuming that Egypt government does not store the data of its population centrally. So the Egypt government hires your data consultancy firm and want to know the average age of its population. It is impossible for your firm to go door to door, and collect the data of all 82 million people of Egypt. Then what will you do? You will work with samples of data. Of course, you will not work with just one sample. You will work with multiple samples from different sources.
Here are the assumptions of the Central Limit Theorem:
- The first assumption is: The samples will be sufficiently large to represent the population.
- And the second assumption is: the variances (read more about variances) of the samples will be finite. I will not discuss here infinite variances. That is too technical. Just remember that: you can ignore this assumption as most of the samples will have finite variances.
So here is our Central Limit theorem tells based on the above example. I am assuming here that you have collected total 100 data sets, I mean 100 samples of data. So the central limit theorem tells us that:
- The mean of all the samples will be equal to the mean of the population. Let’s elaborate more: you got 100 mean values from 100 samples. Then calculate the average of these 100 mean values. And the result will be equal to the mean of the whole population.
- And all of the samples will follow an approximately normal distribution pattern. In the image below, you are seeing an example of a normal distribution pattern. This graph is also called Bell Curve.
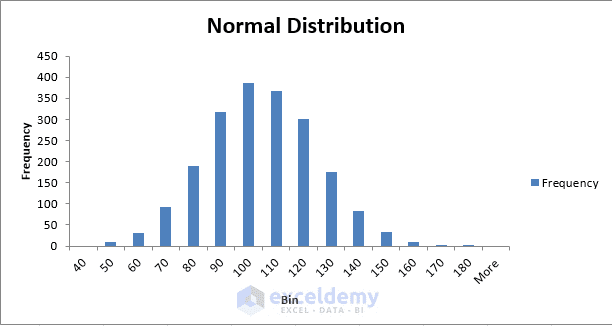
A simple Normal Distribution / Bell Curve
So I hope you have got an idea on Central Limit theorem. Now I shall show you some ways to implement this theorem with your business data.
- First of all: don’t take any decision so fast based on a small number of data. The reason is that short-term results can be deceiving. When you will gather more data, you will start seeing a pattern with your data.
- If you look at a few days’ result, it’s most likely that your data won’t look like a normal curve. Keep collecting more data from your business, and see whether your data starts making perfect normal distribution curve.
So, keep measuring, keep analyzing, and keep an open mind to observe regularly what your data tells you.
Read More: How to Make a Histogram in Excel Using Data Analysis ToolPak
Standard Scores / Sigma / Z-Scores
Let’s back to our previous example. You have got 8.02 standard deviation for the second sample of data. And the mean of the sample is 249.92 (just use AVERAGE(…) function on the numbers to get the mean of the sample data).
Standard deviation is denoted by symbol: sigma (σ)
So for the above example, we can write: σ = 8.02
And the mean value is denoted by symbol Mu (µ).
So we can write, µ = 249.92
So, we want to know about Standard Scores or Sigma or Z-scores. The number of standard deviations from the mean is called the “Standard Score”, “sigma” or “z-score”.
Say, on the context of above example, when someone says: the value 262 has a Z-score of 2.0. It means that the value 262 is within 2 standard deviations of the mean. Did not understand?
Let’s explain more. When we say a number has a value of Z-score 1, it means the number is within 1 standard deviation.
- 1-standard deviation means the range between µ + σ and µ – σ; when a value falls in this range, we say the value has a Z-score of 1.0
- 2-standard deviation means the range between µ + 2σ and µ – 2σ; when a value falls in this range, we say the value has a Z-score of 2.0
- 3-standard deviation means the range between µ + 3σ and µ – 3σ; when a value falls in this range, we say the value has a Z-score of 3.0
Standard Error
Now how to calculate standard error? You will find the standard error value dividing the standard deviation by the square root of the sample size.
For our above example, the sample size is 25, the square root of 25 is 5 and the standard deviation is 8.02. So the standard error is 8.02/5 = 1.604.
Bell Curve/ Gaussian distribution/ Normal distribution
In this post, I will not discuss how to get a bell curve in Excel using some sample data. I have a plan to write a blog post discussing different ways to get bell curves in Excel.
When you take a sample of data accurately from a population, you should get a bell curve if you make a frequency distribution chart in Excel using the sample data. Read this Mathisfun.com post on the bell curve, you will get a good grasp on this topic.
Confidence Level
Starting with a real life example.
Your friend comes to you and says: he saw your wife in the market (if you are married. Not? Then replace wife with a girlfriend; no girlfriend? Get one soon :)).
You are in doubt, as you left your wife at home.
So you ask your friend: Are you sure?
Your friend replies: Yes, I am 90% sure.
So, your friend’s confidence level is 90%.
When you take a sample of some data from the whole population, your observation should have some confidence level attached to your result. The more data you will collect your sample, your confidence level will get higher.
When you check 100 bags from total 1000 bags for your observations, you can say my confidence level is 95% that the average of the bags is this xxx value. But if you check only 10 bags from total 1000, then your confidence level will not be 95%. It might be 60% or 70%. So, there are no hard and fast rules to attach a confidence level with a result from a sample. It just depends on your confidence level you feel.
Read More: One and Two Ways (Variables) Sensitivity Analysis in Excel!
Confidence intervals
Xxx% confidence interval is a range of values that you can be xxx% certain contains the true mean of the population. Say when we say, I am 95% sure that the average of some numbers lies between 40 and 50, then our 95% confidence interval is between 40 and 50.
According to graphpad.com’s this article [the image below also collected from this link], when we work with lower sample size [left part of the image below], our confidence interval is larger. When we start gathering more data, with the same confidence level (in the image 95% confidence level is set for all the samples), your confidence interval starts decreasing. The right image shows the sample size as 150 and you see the confidence interval has become very small.
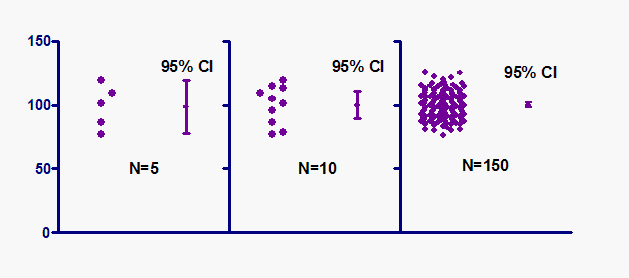
Different scenarios of confidence intervals. Image credit.
But what about when your confidence level is higher with the same sample? Look at the table below. You will find the confidence level and relevant Z-score or confidence interval in the table. From the table, it is clear that the higher the confidence level, the higher the confidence interval or Z-score value.
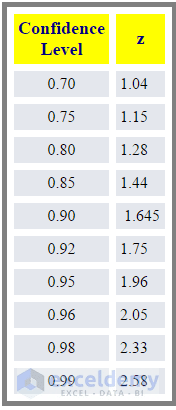
Confidence level and Z-score relationship.
People are often surprised to know that 95% confidence intervals are higher than 80% confidence intervals, and 70% confidence intervals are narrower. But if you think deeply, you will get the sense behind this scene. When you will talk in higher confidence about a range that will contain the true result, you will talk about wider interval because you will not want to be wrong in your assumption.
Read More: How to Use Scenario Manager in Excel [with Examples]
Margin of error
The margin of error is how extremely you are wrong from your desired value. Let’s get back to your little grocery shop. You now take a sample of 10 bags. Your desired value for every bag is 250 grams but you get values like these: {248, 255, 260, 245, 220, 280, 255, 265, 270, and 252}. The values range from 220 to 280. So your margin of error is ±30 from the desired value.
This is a practical example. But when you will work with statistics, you will use the following equation to calculate the Margin of Error.
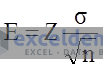
Equation to find out the Margin of Error
E is for Margin of Error, Z is for Z score, sigma (σ) is for Standard Deviation, and n is for sample size.
Let’s face a problem with Margin of Error.
Your company is going to provide ISP services to households. Your duty is to find out the average usages (in minutes) of the internet by a household in your target locality. You take your survey in 100 households and get standard deviation (σ) as 8.25 minutes. You are 95% confidence about your survey.
From the above data find out the Margin of Error.
Solution:
You are 95% confidence about your data, so your Z-score will be (from the table above) 1.96.
Sample size, n = 100 as you surveyed 100 households in the target locality.
Standard deviation, σ = 8.25.
So, E = 1.96*(8.25/SQRT(100) = 1.62.
I think you are now clear how to calculate the margin of error.
Take my course on Excel Data Analysis
Excel is a widely used software for analyzing data. In my course: Data Analysis in Excel with Statistics: Get the Meaning of Data, I have started from how to calculate the mean value of some numbers. Slowly I entered into the hard parts of data analysis but in A B C D language. If you are not a statistician, just don’t worry. You will get good command over data analysis from the course.
Just a quick review on what I have covered in my course:
- Overview of Data analysis: I will start with an overview of the data analysis. I will describe how you will calculate common measures of your data, I will introduce you to the central limit theory and then I will provide my advice for minimizing error in your calculations.
- Visualizing Data: Then I will teach you how to visualize your data using histograms, how to identify relationships among data by creating XY Scatter charts and forecast future results based on Existing data.
- Building Hypothesis: Then I will show you how to formulate a null and alternative hypothesis, how to interpret the results of your analysis and how to use the normal, binomial and Poisson distributions to model your data.
- Relationships between data sets: Finally I will show you how to analyze relationships between data sets using covariance, how to identify the strength of those relationships through correlation and then I will introduce you to Bayesian analysis.
- Case Study 1: Summarizing Data by Using Histograms
- Case Study 2: Summarizing Data by Using Descriptive Statistics
- Case Study 3: Estimating Straight-line Relationships
- Case Study 4: Modeling Exponential Growth
- Case Study 5: Using Correlations to Summarize Relationships
- Case Study 6: Using Moving Averages to Understand Time Series
This course will be highly essential to the people who are in the fields of surveying data, marketing, and CEO.
If you have any questions on the topics that I have discussed above or about the above course, just put it in the comments below.
Get FREE Advanced Excel Exercises with Solutions!

Thank you! We need more conversations like this. The how-to tutorials are extremely valuable, but these topics help fill in the what, why, when and offer the user greater facility.
MORE MORE MORE!
OZ thanks for your feedback. I am going to write these types of posts like a series. Your comments made me more inspired 🙂
EXCELLENT.
I will say I have learned important topics since I subscribed to your website.
Your step by step tutorials is helping and inspiring.
Thanks.
Uche.