In Statistics, Frequency means the number of occurrences in a particular range or interval, and the Frequency Distribution displays the frequency counts. We can calculate the Mean of the Frequency Distribution in multiple ways depending on the dataset. In this article, we’ll demonstrate 4 effective ways to do so.
Method 1 – Finding the Mean of Frequency Distribution Manually with a Simple Formula
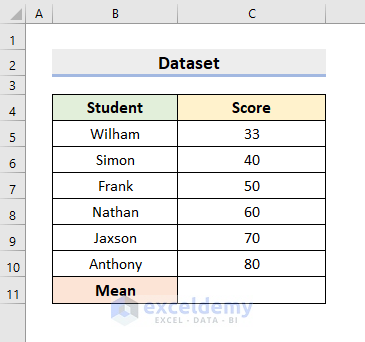
In our first method, we’ll create a simple formula for finding the Mean of Frequency Distribution. The arithmetic mean is the Average of some given numbers, and we can calculate the average by dividing the sum of the numbers by the amount of numbers.
1.1 – Arithmetic Mean
To find the Arithmetic Mean, we’ll simply add the numbers manually, then divide the sum by the total numbers. This method is appropriate only when the dataset is small. Applying this process to a large worksheet will become tiresome and time-consuming, and likely to result in errors.
Steps:
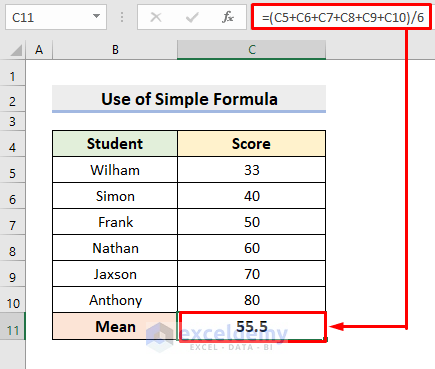
- Select cell C11.
- Enter the following formula:
=(C5+C6+C7+C8+C9+C10)/6- Press Enter to return the result.
The Mean (55.5) of the Scores is returned.
1.2 – Use of Frequency
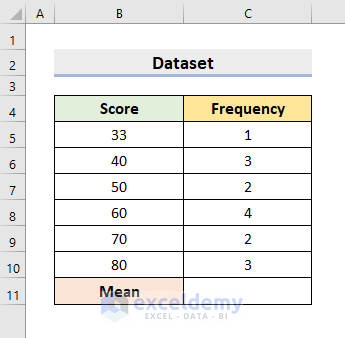
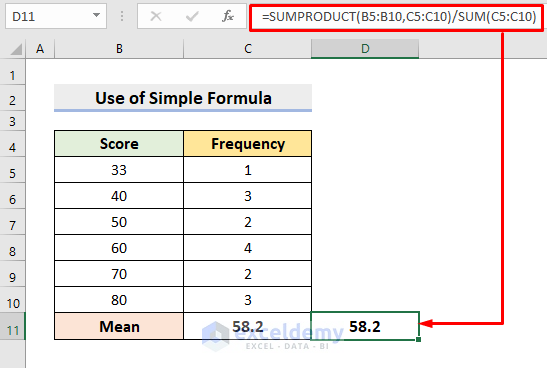
In the following dataset, we have the Scores and the Frequency. We’ll modify the formula to multiply the Scores by their respective Frequencies. Then, we’ll add the product outputs and divide them by the total Frequency.
We can use the SUMPRODUCT function to multiply the Scores by the Frequencies to reduce some load. This function will multiply the arrays we input in the argument section, then it’ll determine the sum.
Steps:
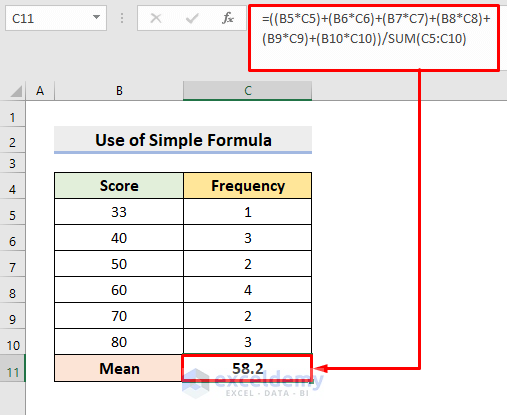
- In cell C11, insert the following formula:
=((B5*C5)+(B6*C6)+(B7*C7)+(B8*C8)+(B9*C9)+(B10*C10))/SUM(C5:C10)- Press Enter.
The Mean will be returned.
- To use the SUMPRODUCT function, select cell D11 and enter the following formula:
=SUMPRODUCT(B5:B10,C5:C10)/SUM(C5:C10)- Press Enter.
The same result is returned (58.2).
Read More: How to Create a Grouped Frequency Distribution in Excel
Method 2 – Using the Average Command from the Home Tab to Calculate the Mean
In this method, we’ll make use of the Average feature, which as the name suggests computes the average.
Steps:
- Select cell C11.
- Go to the Editing section under the Home tab.
- Click the drop-down icon beside the AutoSum.
- Select Average.
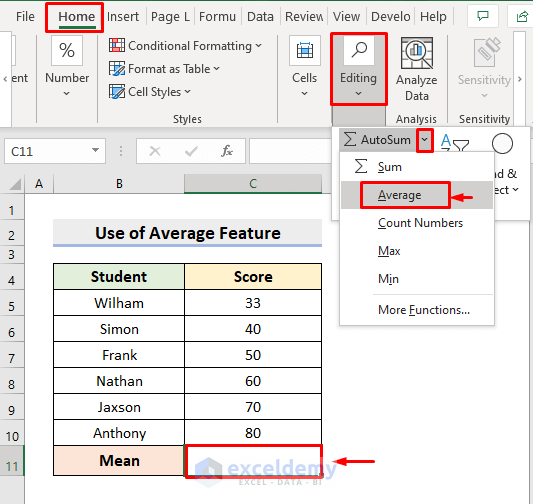
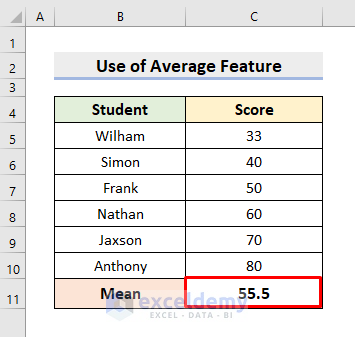
The Mean of the Scores will be returned in cell C11.
Read More: How to Make Frequency Distribution Table in Excel
Method 3 – Using the AVERAGE Function to Get the Mean in Excel
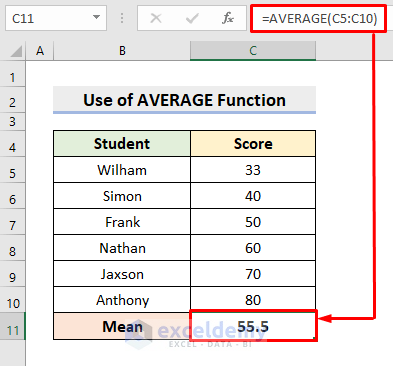
We can similarly apply the AVERAGE function to find the Mean.
Steps:
- In cell C11, enter the following formula:
=AVERAGE(C5:C10)- Press Enter.
The precise Mean value will be returned.
Read More: How to Make a Relative Frequency Histogram in Excel
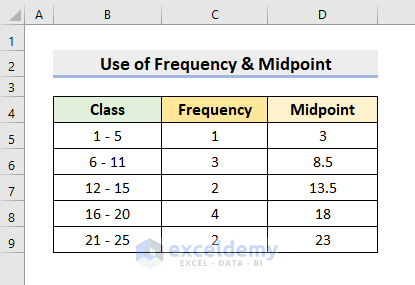
Method 4 – Finding the Mean of Frequency Distribution with Frequency & Midpoint
In this last method, we’ll use a different dataset which has no specific numbers from which to find the average. Instead, we have Class Intervals and the number of occurrences (Frequency) in those intervals. In such cases, we also need to have the Midpoint of the interval. Let’s Find the Mean of the Frequency Distribution for this kind of dataset.
Steps:
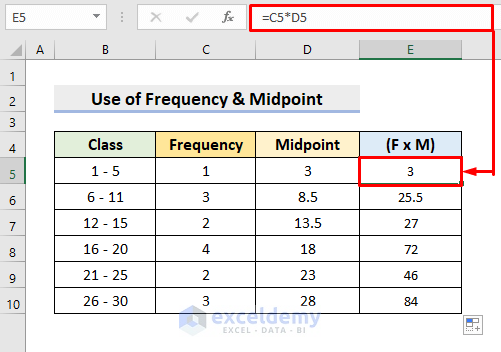
- In cell E5, input the following formula:
=C5*D5- Press Enter.
- Use the AutoFill tool to complete the rest of the calculations.
In this way, we obtain the products of Frequency & Midpoint.
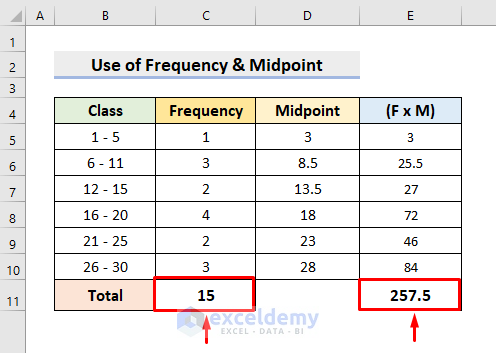
- Apply the AutoSum feature in cells C11 and E11.
The sum of the frequencies and the sum of the frequency & midpoint multiplication will be returned in the respective cells.
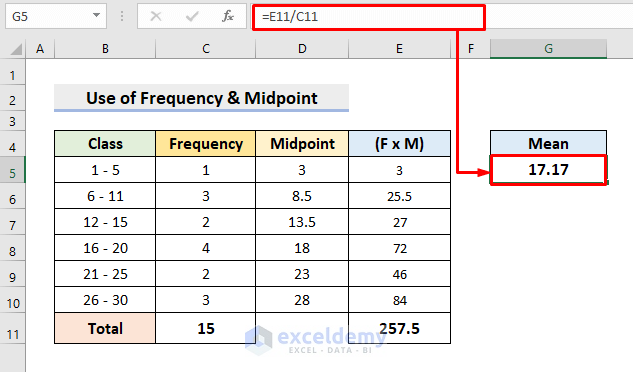
- In cell G5, enter the following formula:
=E11/C11- Press Enter.
The desired Mean will be returned.
Download Practice Workbook
Related Articles
- How to Calculate Upper and Lower Limits in Excel
- How to Calculate Relative Frequency Distribution in Excel
- How to Calculate Cumulative Relative Frequency in Excel
<< Go Back to Frequency Distribution in Excel | Excel for Statistics | Learn Excel
Get FREE Advanced Excel Exercises with Solutions!
