In this article, we will learn how to calculate upper and lower limits in Excel using 2 different methods.
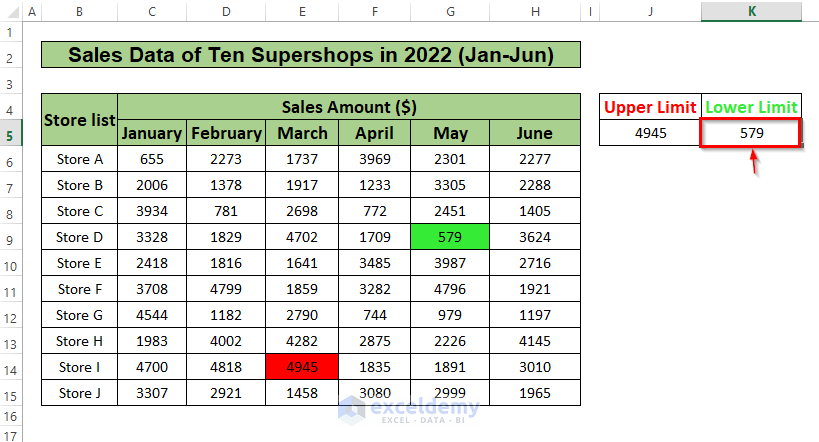
We will use the sales data of ten different super shops during the first six months of the year 2022 as a sample dataset. Let’s first have a look at the final output you are going to get.
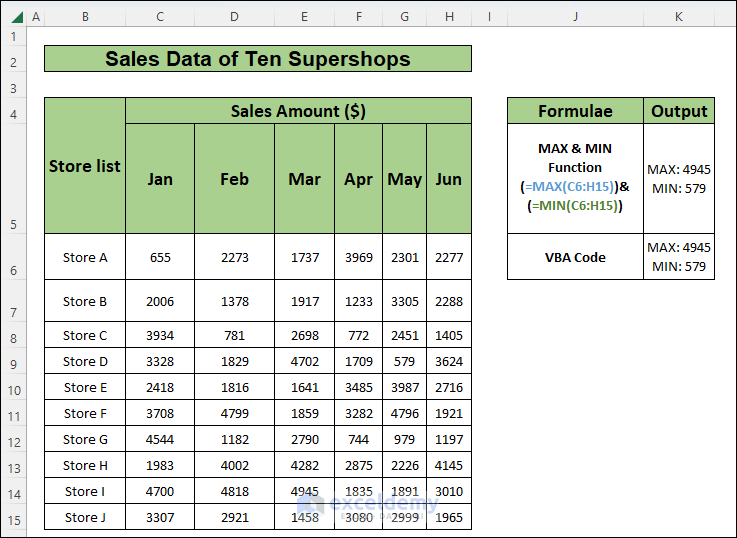
Method 1 – Calculate Upper and Lower Limits in Excel by Using the MAX and MIN Functions
Steps:
- Select cell J5 and enter the following formula:
=MAX(C6:H15)
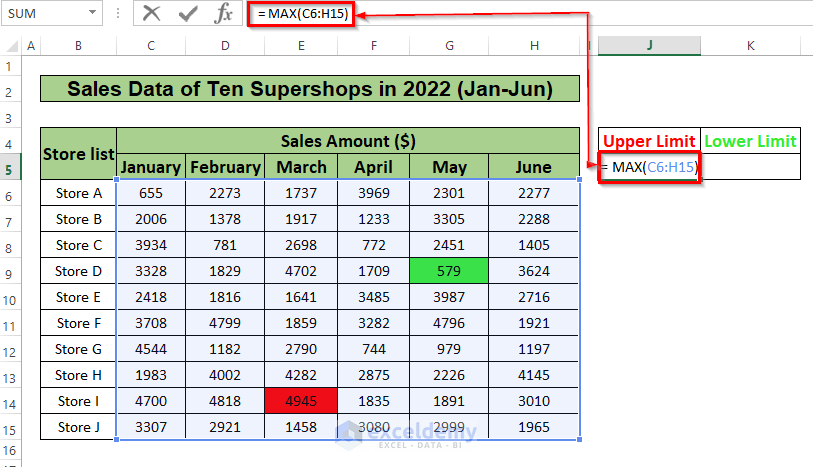
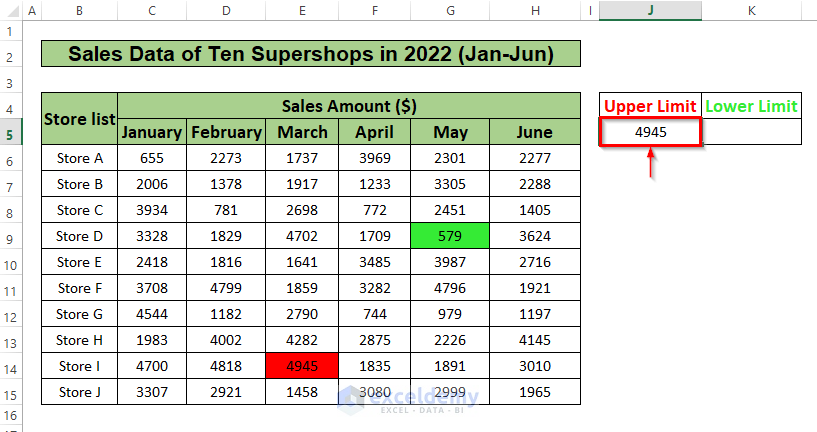
- Press ENTER to get the Upper Limit result.
- Select cell K5 and enter the following formula:
=MIN(C6:H15)
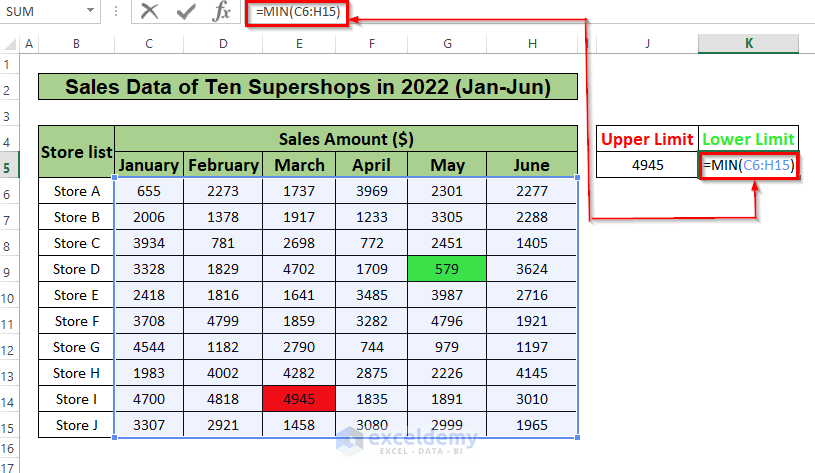
- Press ENTER to get the Lower Limit result.
Read More: How to Create a Grouped Frequency Distribution in Excel
Method 2 – Use VBA Code to Calculate Upper and Lower Limits
This VBA code will highlight the maximum and minimum limits. We’ll also create a command button to recalculate the new upper and lower limits if some data in the dataset changes.
Steps:
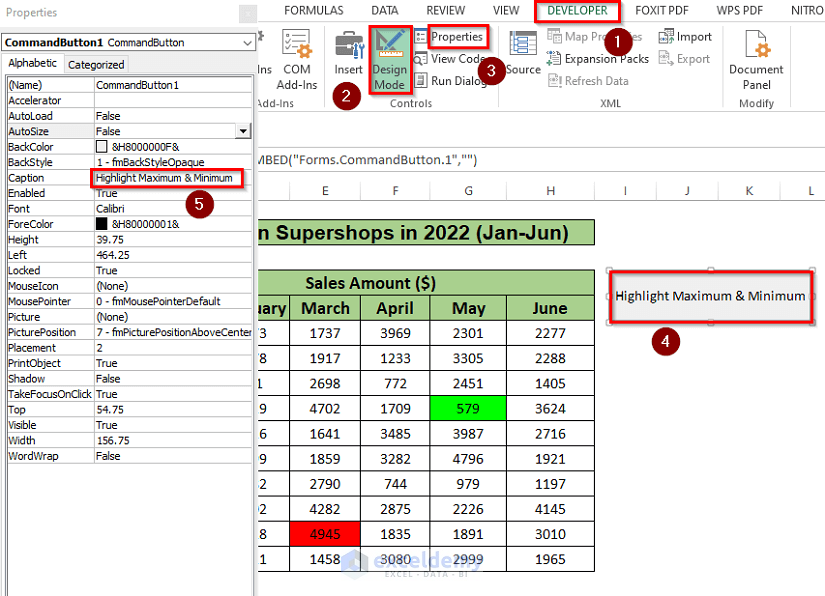
- Go to the Developer tab in the title bar (if you have not used this tab before, it may not be inside the title bar at first.
- Click on Insert.
- From the drop-down menu, under ActiveX Controls, select the rectangular box.
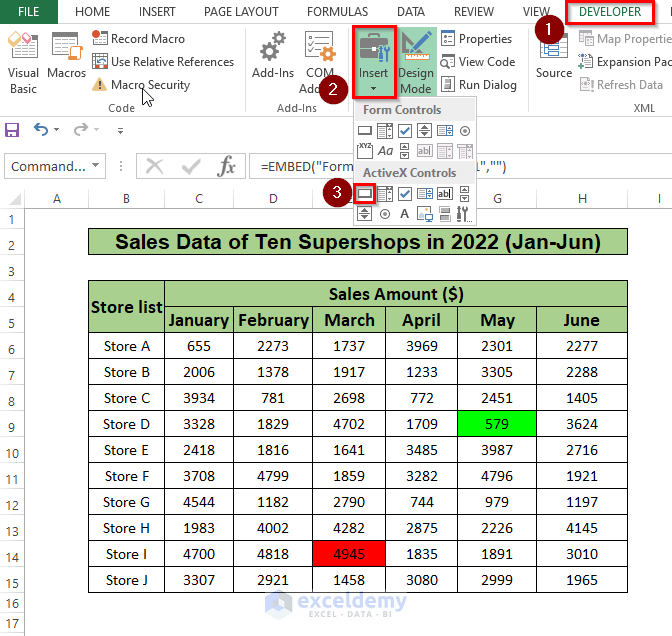
- Draw a rectangular box named CommandButton1.
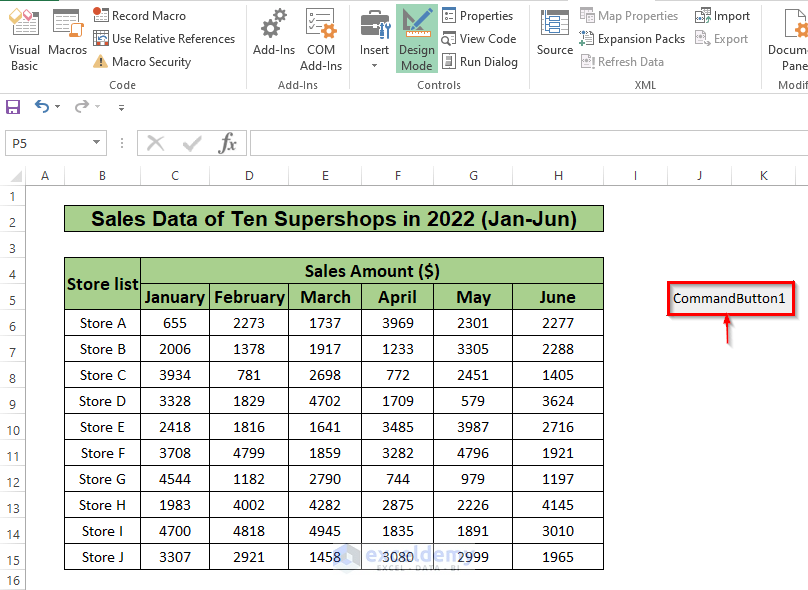
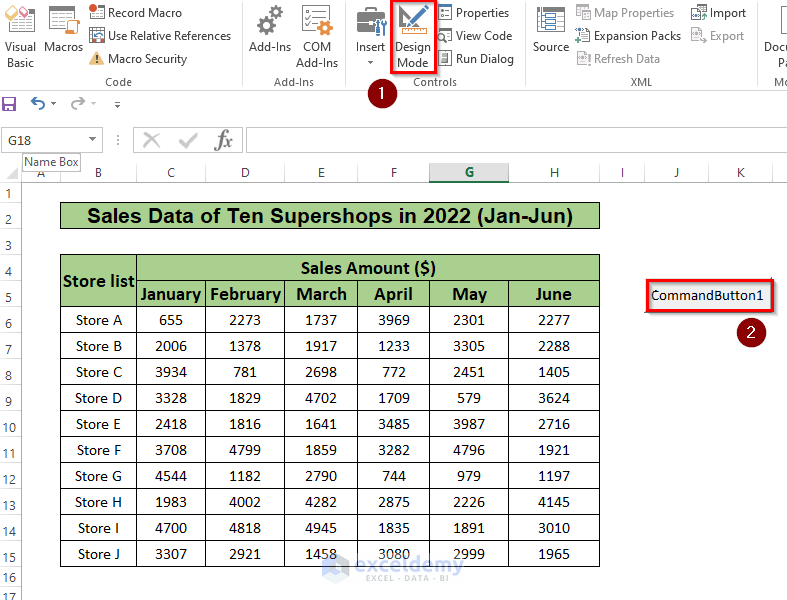
- Click on the Design Mode tab and double-click on CommandButton1.
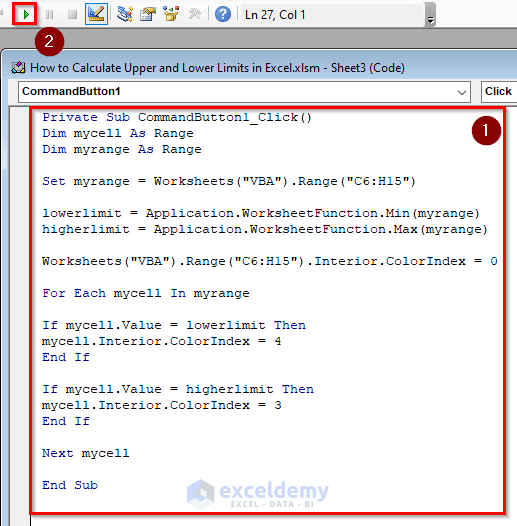
- Enter the following VBA code in the window that pops up.
VBA CodePrivate Sub CommandButton1_Click() Dim mycell As Range Dim myrange As Range Set myrange = Worksheets("VBA").Range("C6:H15") lowerlimit = Application.WorksheetFunction.Min(myrange) higherlimit = Application.WorksheetFunction.Max(myrange) Worksheets("VBA").Range("C6:H15").Interior.ColorIndex = 0 For Each mycell In myrange If mycell.Value = lowerlimit Then mycell.Interior.ColorIndex = 4 End If If mycell.Value = higherlimit Then mycell.Interior.ColorIndex = 3 End If Next mycell End SubCode Mechanism
- We declared two variables named “myrange” and “mycell”.
- We fixed the range of cells C6:H15 from which we need to find the maximum and minimum values.
- We set two more variables, lowerlimit and higherlimit, to store the primary values of the maximum and minimum sales using Excel’s predefined MAX and MIN
- We added another line of code to make all the boxes colorless before adding color to the new maximum and minimum cells after data manipulation.
- We created two For loops to go through the cells within the defined range sequentially and replace the stored data inside the lowerlimit and higherlimit variables, if the next cell’s data is smaller or bigger than the previously stored one.
- After generating the code, click on the “play” button to run the code.
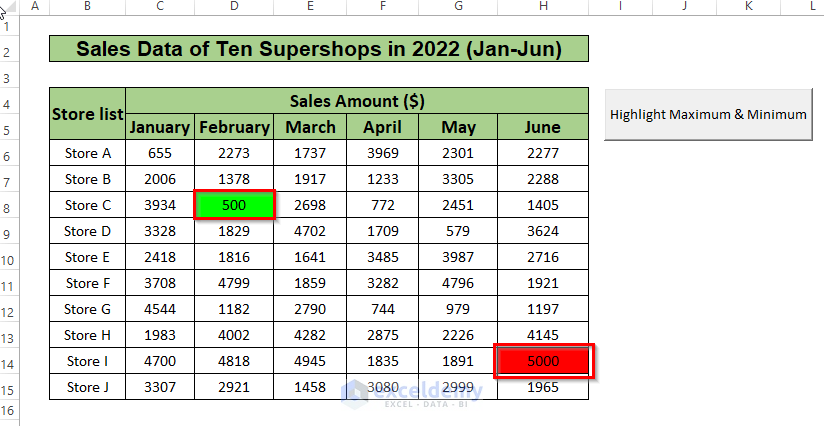
- Return to the previous window of Excel and observe that it has highlighted the maximum and minimum limit values in the dataset.
- If you want to change the name of the command button, go to the Developer tab, and click on Design Mode, Properties, and CommandButton1.
- Rewrite the Caption according to your choice.
- To test if your code works properly, manipulate some data in the dataset to set new upper and lower limits.
- Then, click on the command button.
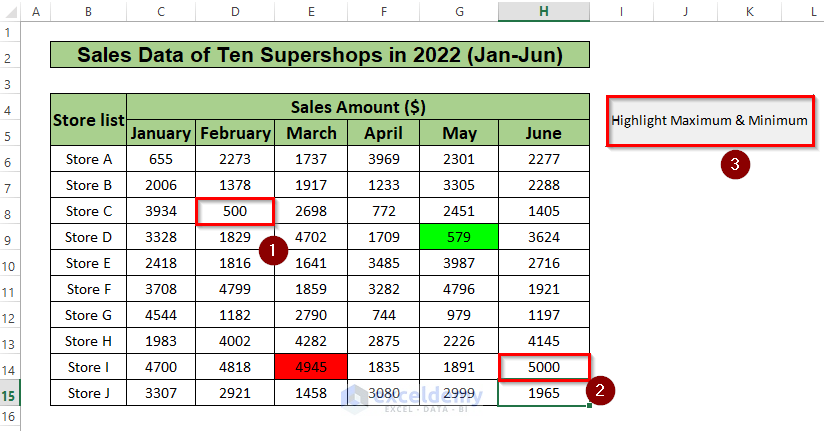
You can see that the new values that you have set just now are highlighted instead of the previous values. This indicates that your code works just fine. (you can test the code in the same way, as many times as you want).
Read More: How to Make a Relative Frequency Histogram in Excel
Download Practice Workbook
Related Articles
- How to Make Frequency Distribution Table in Excel
- How to Find Mean of Frequency Distribution in Excel
- How to Calculate Relative Frequency Distribution in Excel
- How to Calculate Cumulative Relative Frequency in Excel
<< Go Back to Frequency Distribution in Excel | Excel for Statistics | Learn Excel
Get FREE Advanced Excel Exercises with Solutions!
