What Is Cumulative Relative Frequency?
The relative frequency is expressed as a percentage of the overall number of data. By dividing the frequency by the whole number of items, you can determine the relative frequency distribution in Excel of each value. By adding all the frequencies from the preceding row to the relative frequency of the subsequent row, you can determine the cumulative frequency.
How to Calculate the Cumulative Relative Frequency in Excel: 4 Suitable Examples
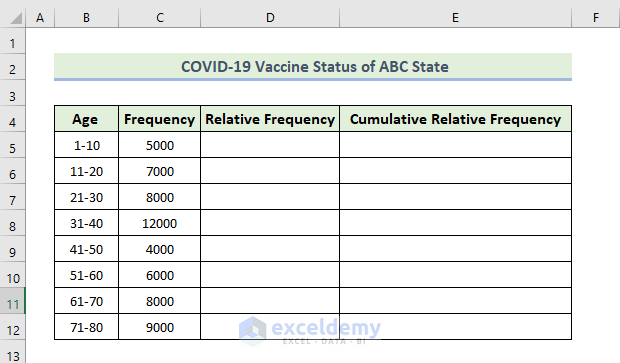
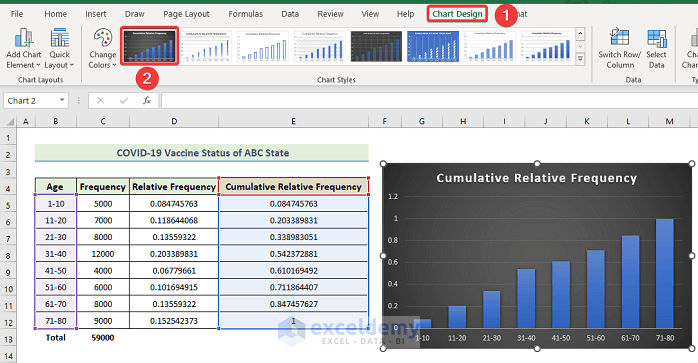
Example 1 – Cumulative Relative Frequency of COVID-19 Vaccine Status
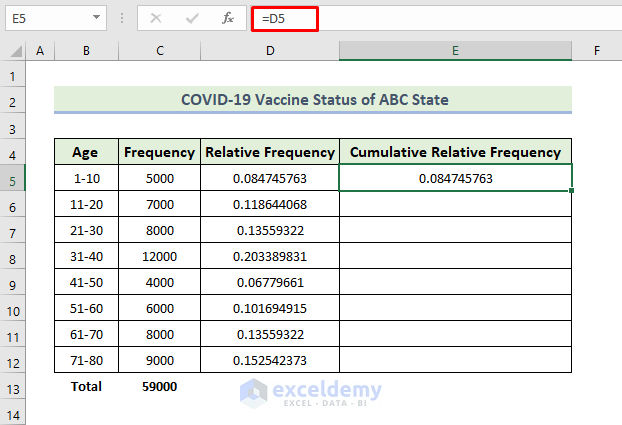
The following dataset contains the age and frequency of COVID-19 vaccine status in a state. We are going to calculate the cumulative relative frequency.
Steps:
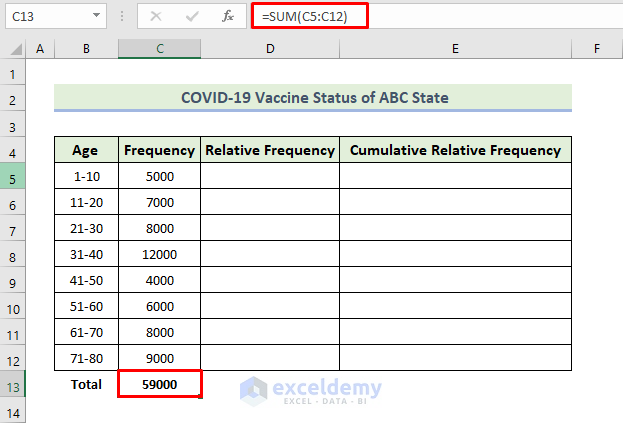
- To calculate the total frequency, use the following formula in the cell C13:
=SUM(C5:C12)
- Press Enter.
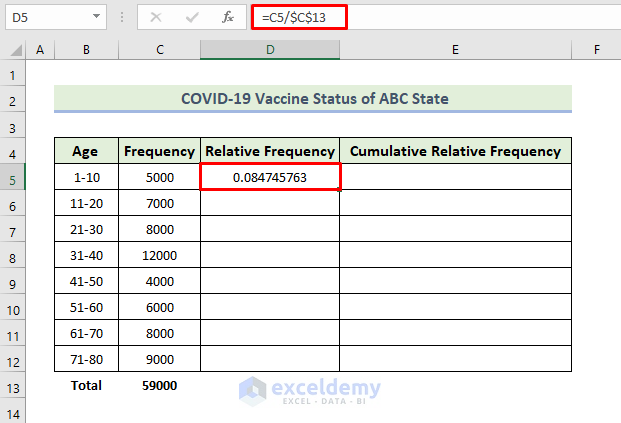
- To calculate the relative frequency, use the following formula in the cell D5:
=C5/$C$13
- Press Enter.
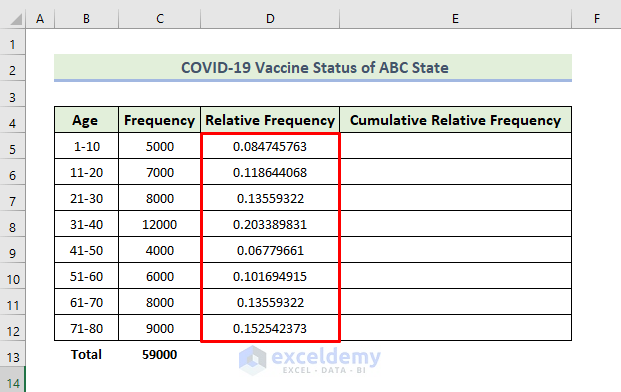
- Drag the Fill Handle icon down.
- Copy the data from cell D5 and paste it onto cell E5.
- To calculate cumulative relative frequency, use the following formula in cell E6:
=E5+D6
- Press Enter.
- Select cell E6 and drag its Fill Handle icon down.
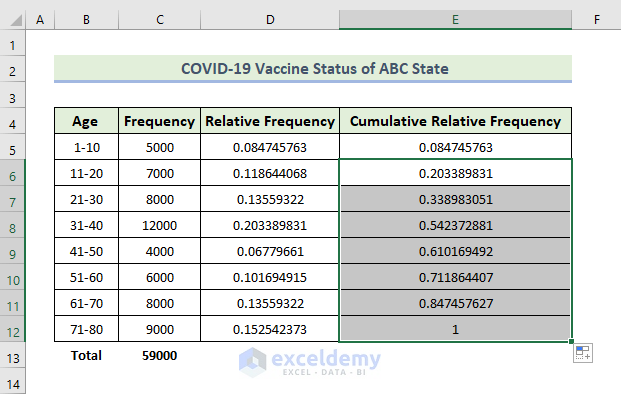
This is how we will be able to create the cumulative relative frequency of the above dataset of the COVID-19 Vaccine Status of ABC State.
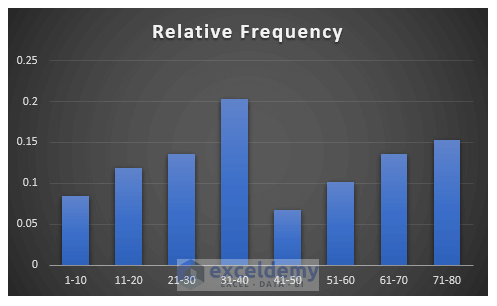
- To create a chart for relative frequency, select the range of data and go to the Insert tab.
- Select the Clustered Column chart.
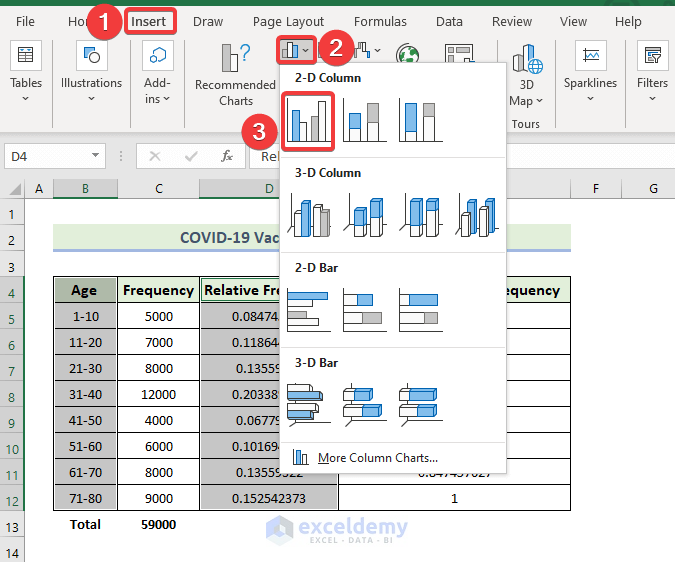
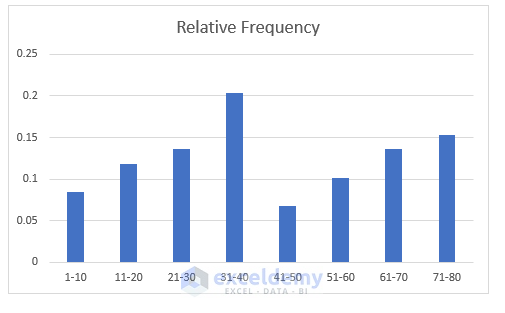
- You will get the following chart.
- To modify the chart style, select Chart Design and then select an option from the Chart Styles group.
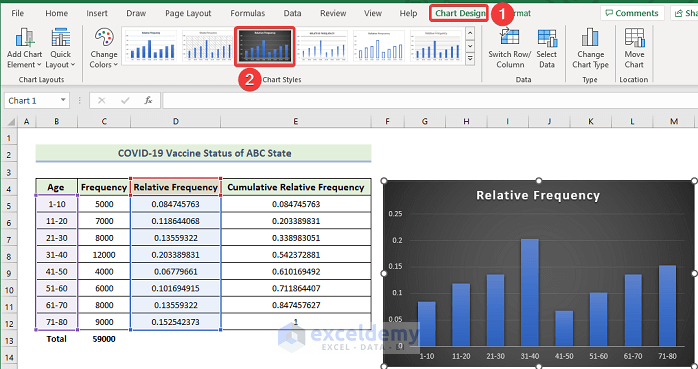
- Here’s the Style 9 look.
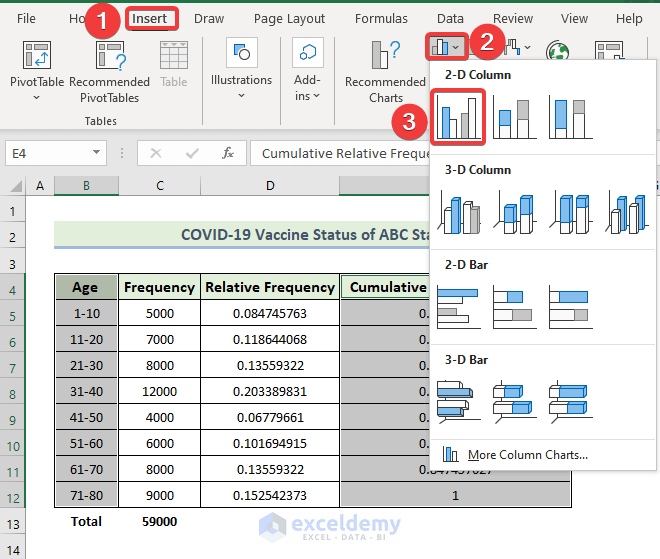
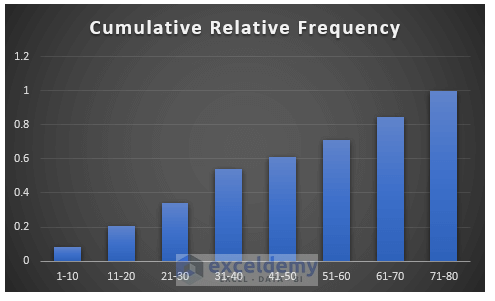
- To create a chart for cumulative relative frequency, select the range of data and go to the Insert tab. Select the Clustered Column chart.
- You will get the following chart.
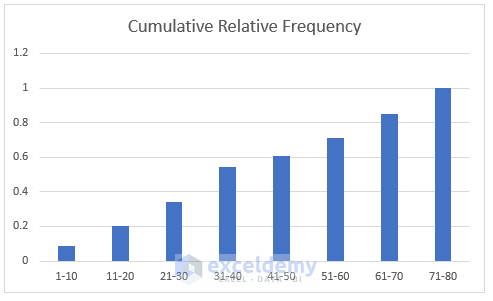
- To modify the chart style, select Chart Design and then select an option from the Chart Styles group.
- Here’s the look with Style 9 chosen.
Note:
Following the above method, you can calculate Cumulative frequency distribution and able to make a relative frequency histogram in Excel. To make a Relative frequency histogram, select the data in columns B and C, then go to the Insert tab and select the Histogram chart.
Read More: How to Make Frequency Distribution Table in Excel
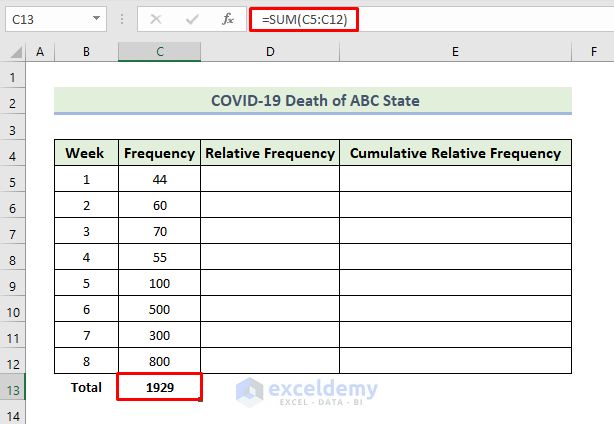
Example 2 – Cumulative Relative Frequency of COVID-19 Deaths
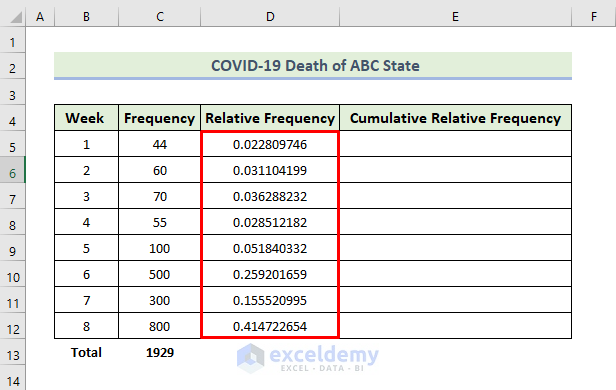
The following dataset contains the week and frequency of COVID-19 death in a state. We are going to calculate cumulative relative frequency.
Steps:
- To calculate the total frequency, use the following formula in the cell C13:
=SUM(C5:C12)
- Press Enter.
- To calculate the relative frequency, use the following formula in the cell D5:
=C5/$C$13
- Press Enter.
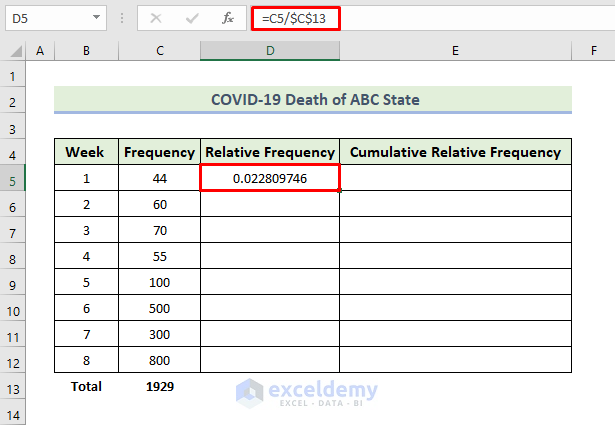
- Drag the Fill Handle icon down.
- You will get the following Relative Frequency column.
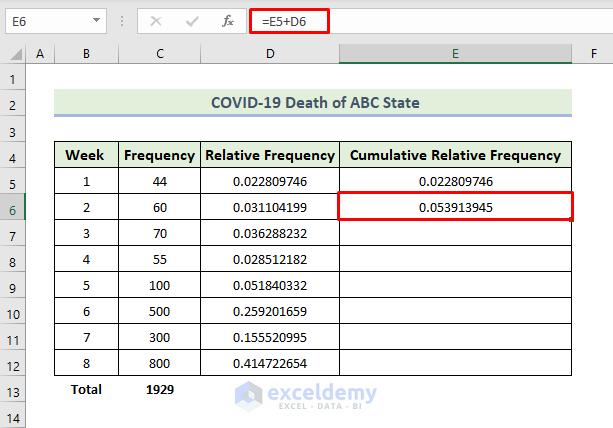
- Copy the data from cell D5 and paste it onto cell E5.
- To calculate the cumulative relative frequency, use the following formula in cell E6:
=E5+D6
- Press Enter.
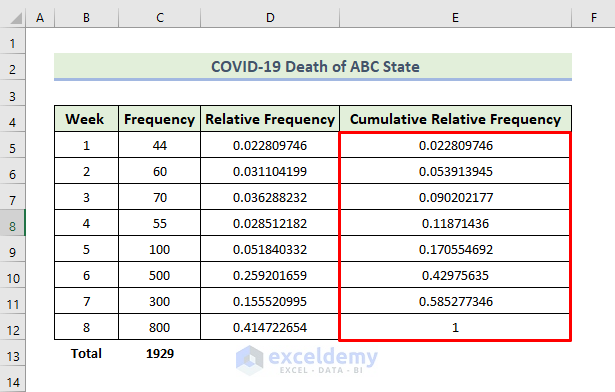
- Drag its Fill Handle icon.
- You will get the following Cumulative Relative Frequency column.
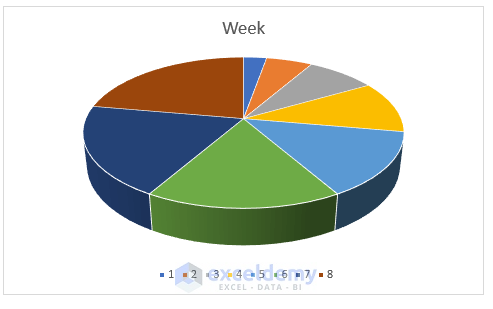
- To create a chart for relative frequency, select the range of data and go to the Insert tab, then select the 3-D Pie chart.
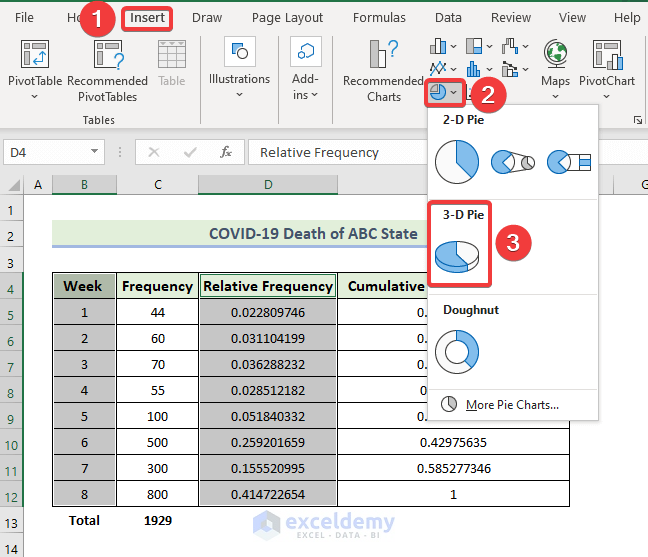
- You will get the following chart.
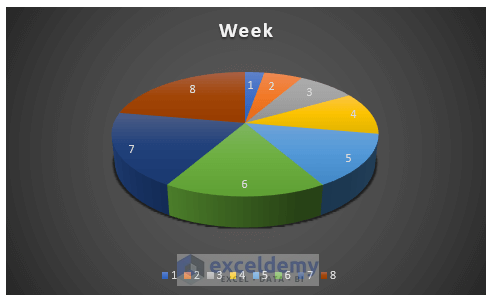
- To modify the chart style, select Chart Design and then select your desired option from the Chart Styles group.
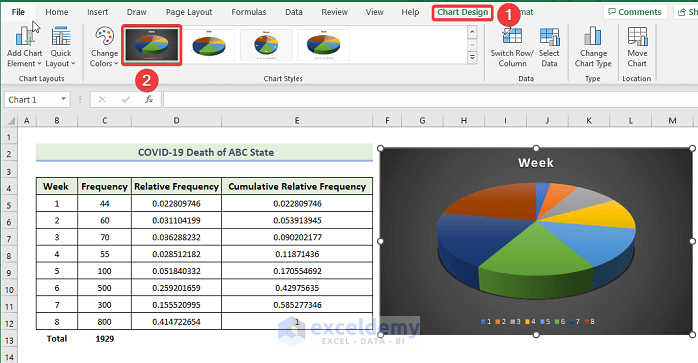
- Here’s the output with Style 9 chosen.
Read More: How to Create a Grouped Frequency Distribution in Excel
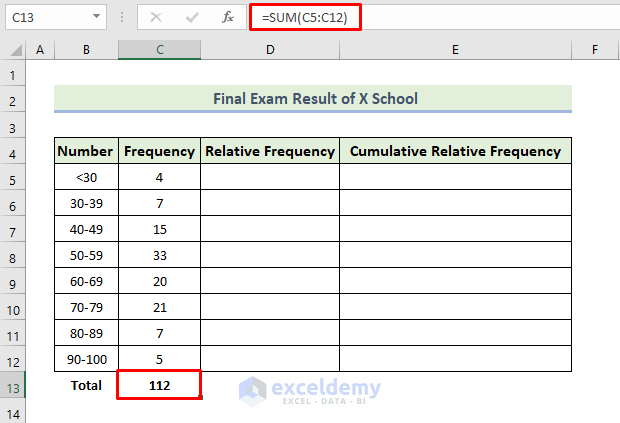
Example 3 – Cumulative Relative Frequency of Final Exam Results
The following dataset contains the number and frequency of final exam results of a school.
Steps:
- To calculate the total frequency, use the following formula in the cell C13:
=SUM(C5:C12)
- Press Enter.
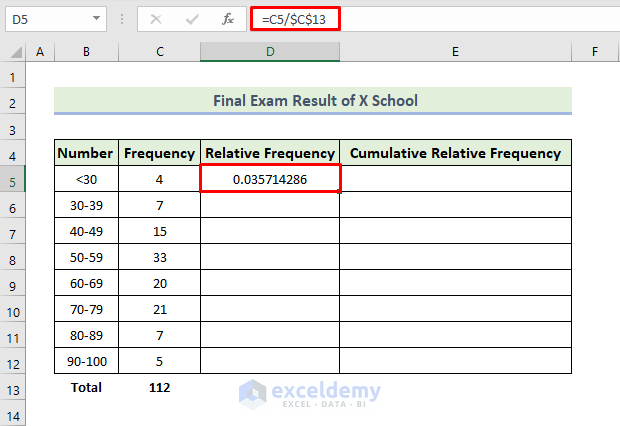
- To calculate the relative frequency, use the following formula in cell D5:
=C5/$C$13
- Then, press Enter.
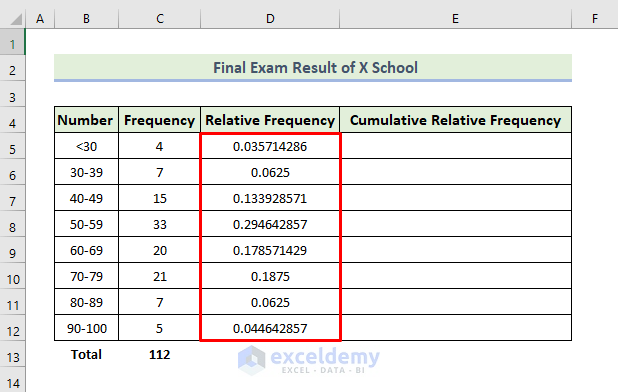
- Drag the Fill Handle icon down to get the Relative Frequency column.
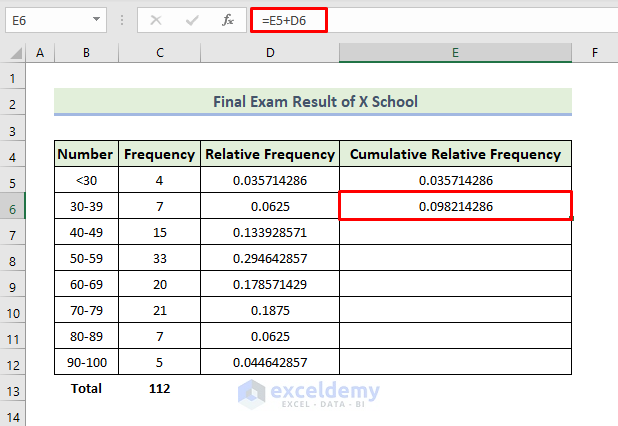
- Copy the data from cell D5 and paste it onto cell E5.
- To calculate the cumulative relative frequency, use the following formula in cell E6:
=E5+D6
- Press Enter.
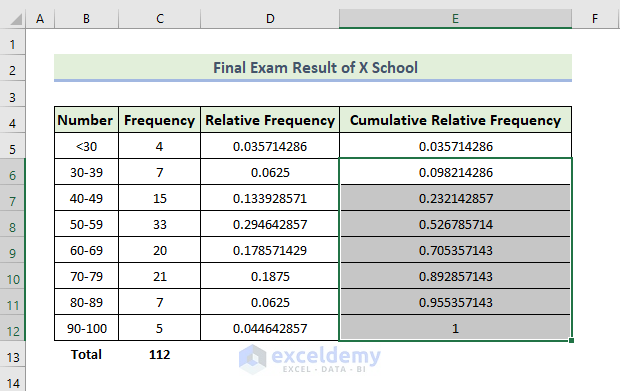
- Drag its Fill Handle icon down to get the following Cumulative Relative Frequency column.
- To create a chart for relative frequency, select the range of data and go to the Insert tab, then select the Clustered Column chart.
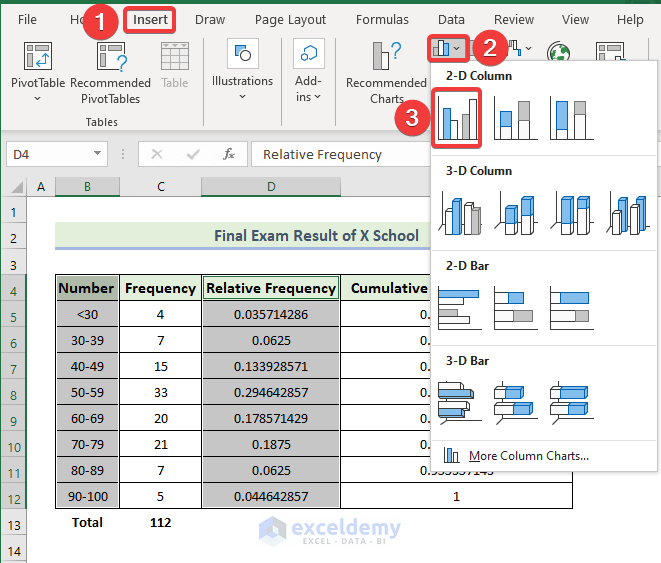
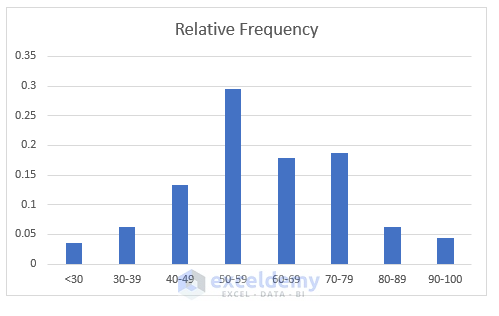
- You will get the following chart.
- To modify the chart style, select Chart Design and then select an option from the Chart Styles group.
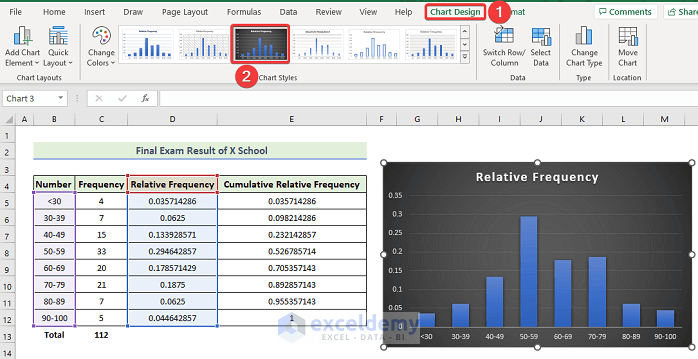
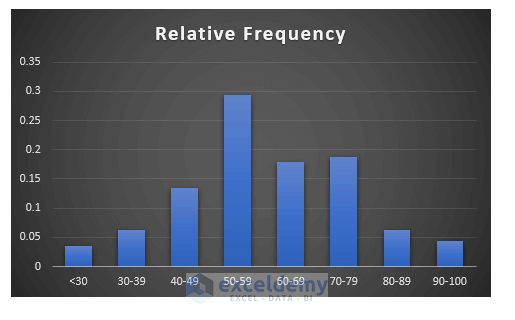
- Here’s a sample output
Example 4 – Cumulative Relative Frequency of Products for a Shop
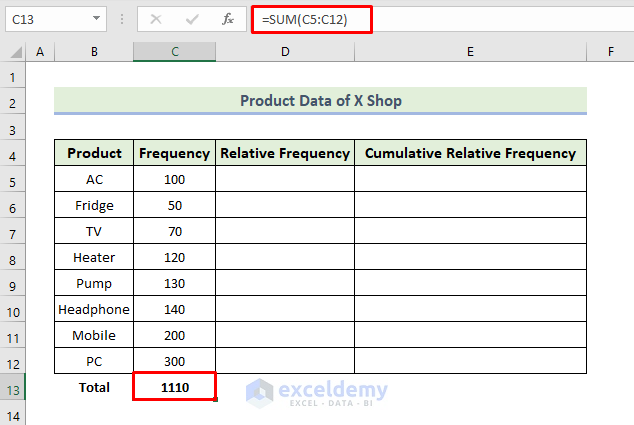
The following dataset contains the week and frequency of product data of a shop.
Steps:
- To calculate the total frequency, use the following formula in the cell C13:
=SUM(C5:C12)
- Press Enter.
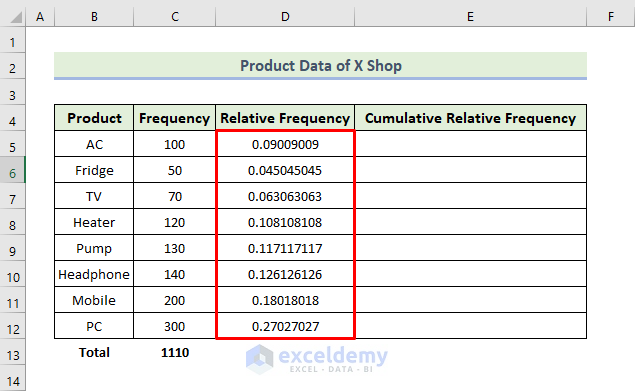
- To calculate the relative frequency, use the following formula in the cell D5:
=C5/$C$13
- Press Enter.

- Drag the Fill Handle icon down to get the following Relative Frequency column.
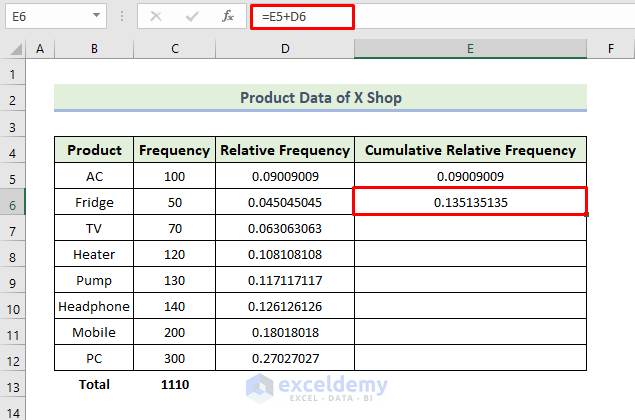
- Copy the data from cell D5 and paste it onto cell E5.
- To calculate the cumulative relative frequency, use the following formula in cell E6:
=E5+D6
- Press Enter.
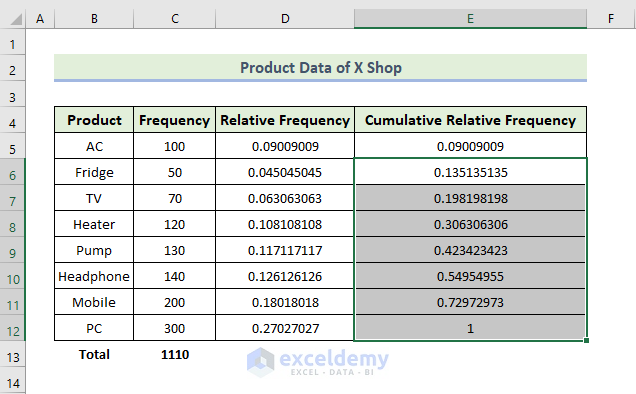
- Drag its Fill Handle icon down to get the following Cumulative Relative Frequency column.
- To create a chart for relative frequency, select the range of data and go to the Insert tab, then select the Clustered Column chart.
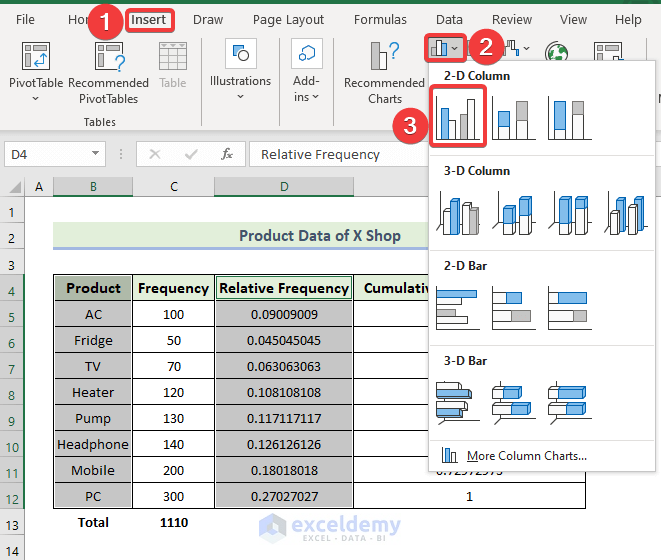
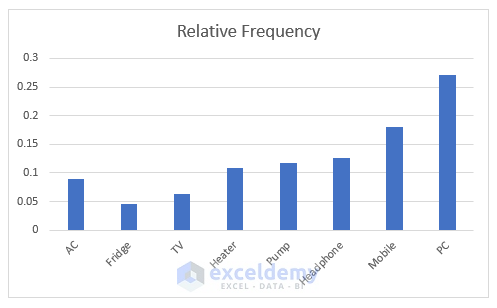
- You will get the following chart.
- To modify the chart style, select Chart Design and select an option from the Chart Styles group.
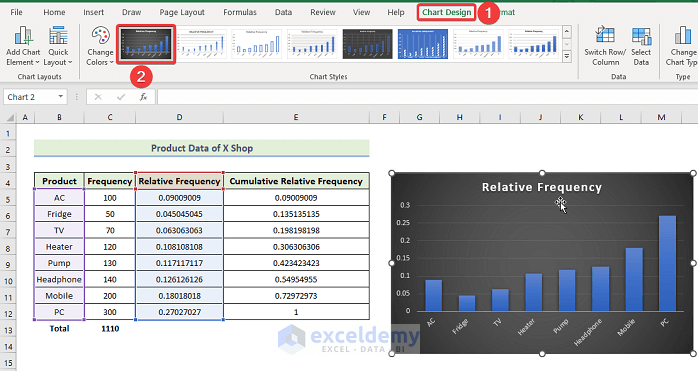
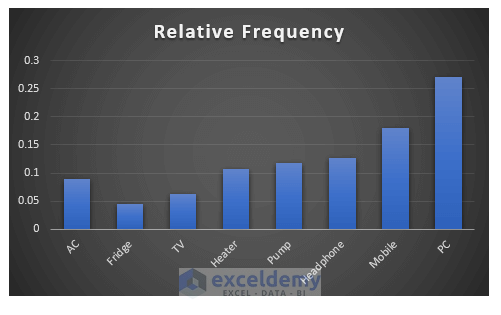
- Here’s a sample output.
Things to Remember
- When you divide each frequency by total frequency to calculate relative frequency, you need to make the total frequency cell an absolute cell reference.
- You need to enter a formula for the cumulative frequency in the second result cell since the first is copying the starting value. Then, copy the formula from the second cell onward.
Download the Practice Workbook
Related Articles
- How to Calculate Upper and Lower Limits in Excel
- How to Find Mean of Frequency Distribution in Excel
- How to Make a Relative Frequency Histogram in Excel
- How to Calculate Relative Frequency Distribution in Excel
<< Go Back to Frequency Distribution in Excel | Excel for Statistics | Learn Excel
Get FREE Advanced Excel Exercises with Solutions!
