Frequently, we work with numerical data in our Excel worksheet. And so, we may need to Calculate the Cumulative Frequency Percentage. The Cumulative Percentage gives us a better understanding of various datasets. Such as Sales, class performance Scores, etc. There are multiple ways to perform the task. In this article, we’ll show you all the effective and easy methods to Calculate the Cumulative Frequency Percentage in Excel.
Introduction to Cumulative Frequency Percentage
Usually, frequency means the number of occurrences in a certain distribution or interval. The sum of a frequency and all the frequencies in a frequency distribution until a definite class interval is known as Cumulative Frequency. We can also name it the Running Total of the frequencies. The percentage of this frequency is called the Cumulative Frequency Percentage. This percentage will remain the same or increase across a set of responses and will reach 100% as the highest value.
How to Calculate Cumulative Frequency Percentage in Excel: 6 Effective Ways
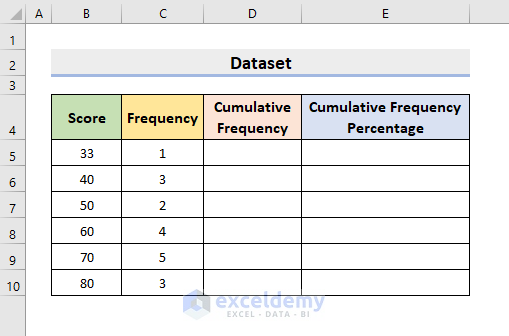
To illustrate, we’ll use a sample dataset as an example. For instance, we have performance Scores obtained by some students in a subject in Column B. The Frequency of the scores in Column C. Here, we’ll determine the Cumulative Frequency first. And then, we’ll compute the Cumulative Frequency Percentage.
1. Manually Calculate Cumulative Frequency Percentage in Excel with Simple Formula
In our first method, we’ll create a simple formula to get the frequency and the percentage. Therefore, follow the steps below to carry out the operation.
STEPS:
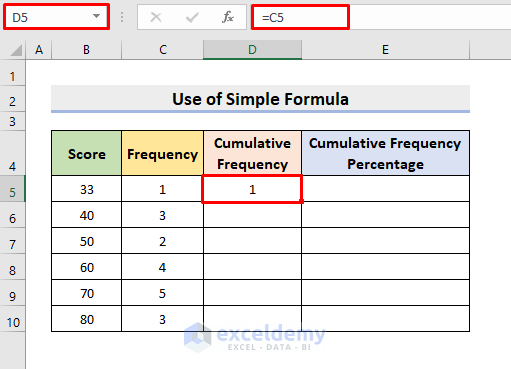
- First, select cell D5. Here, type the formula:
=C5- Then, press Enter. It’ll insert the C5 cell value (1) in D5.
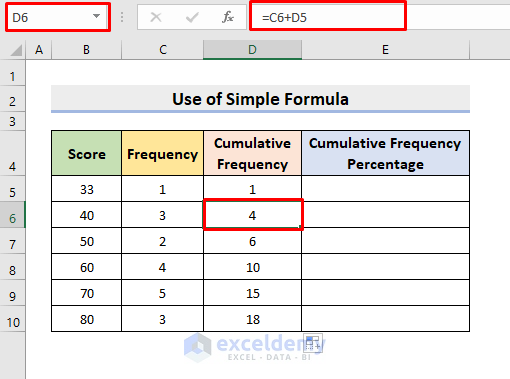
- Now, choose cell D6 to type the formula:
=C6+D5- Next, press Enter to get the sum.
- After that, use the AutoFill tool to complete the series. This will simply produce the Running Total of the frequencies.
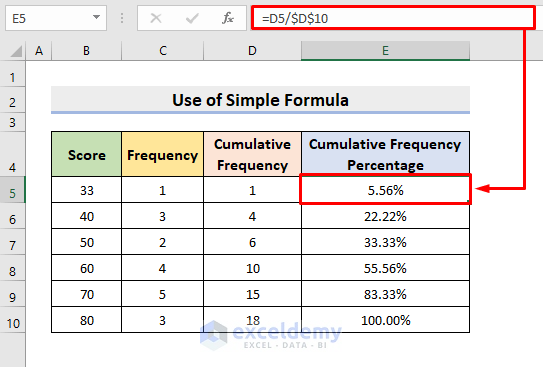
- Subsequently, select the range E5:E10. Choose Percentage from the Number section.

- Afterward, in cell E5, type the formula:
=D5/$D$10- Lastly, press Enter and use AutoFill to yield Cumulative Frequency Percentage as the output.
- In this way, you can get your desired result.
Read More: How to Do a Frequency Distribution on Excel
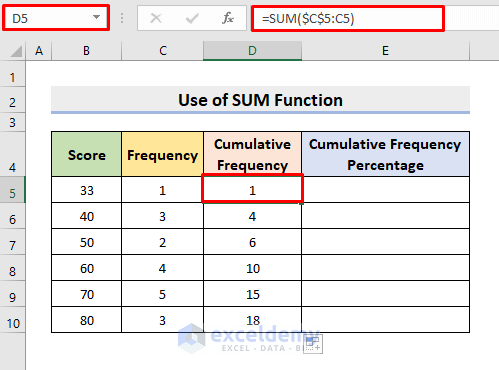
2. Insert Excel SUM Function for Computing Running Total Percentage
To avoid the manual addition as we did in the first method, we can use the SUM function. So, learn the following steps to perform the task.
STEPS:
- Firstly, select cell D5 and type the formula:
=SUM($C$5:C5)- Next, press Enter.
- Use AutoFill to fill the series.
- Consequently, in cell E5, type the below formula:
=D5/$D$10- Then, press Enter.
- After that, get the other Running Total Percentages using AutoFill.

Read More: How to Make Frequency Distribution Table in Excel
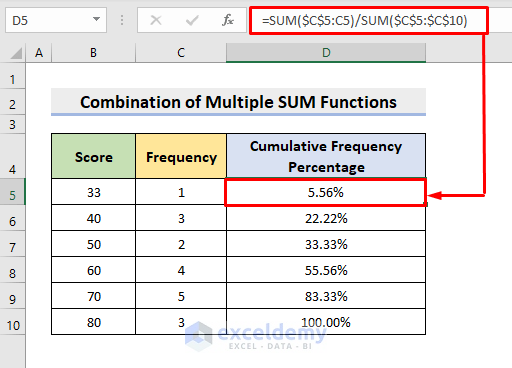
3. Combine Multiple SUM Functions to Get Cumulative Percentage
However, if we want to get the Cumulative Percentage in just one step by skipping the multiple steps, go through the process below.
STEPS:
- First of all, select cell D5 and type the formula:
=SUM($C$5:C5)/SUM($C$5:$C$10)- At last, press Enter. Use AutoFill to complete the rest of the series.
4. Determine Cumulative Frequency Percentage Through Histogram
Additionally, we can see the Frequency Percentages over a definite range or intervals through Histogram. In this process, we won’t exactly get the result, but we can see other important things. In the following dataset, we have set the Interval as 2. Now, follow the process.

STEPS:
- Select Data ➤ Data Analysis at first.
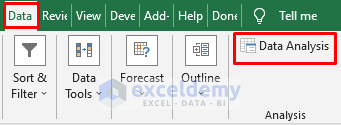
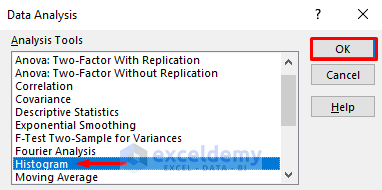
- As a result, the Data Analysis dialog box will pop out.
- There, choose Histogram from the list and press OK.
- Consequently, the Histogram dialog box will appear.
- Then, select C5:C10 as the Input Range, and D5:D10 as the Bin Range.
- After that, check the circle for Output Range. Type $E$4 in the box beside it.
- Again, check the box for Cumulative Percentage and Chart Output.

- Finally, press OK.
- Thus, it’ll return the Histogram and also the Cumulative Percentage.

Read More: How to Make a Relative Frequency Histogram in Excel
5. Apply Pivot Table Feature to Calculate Cumulative Percentage
Excel provides different functions and features for performing various tasks. Pivot Table is one of such very useful features. In this method, we’ll insert a Pivot Table for calculating the Cumulative Frequency Percentage. Therefore, learn the process.
STEPS:
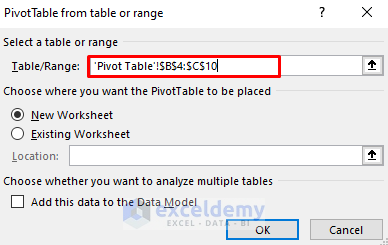
- In the beginning, go to Insert ➤ Pivot Table.

- As a result, a dialog box will emerge.
- Select B4:C10 as the Table/Range and press OK.
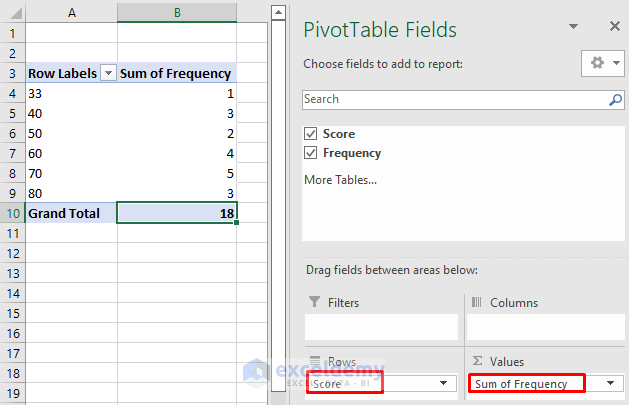
- Accordingly, a new worksheet will appear and you’ll see the PivotTable Fields on the side pane.
- There, place Score in the Rows section. Place Sum of Frequency in the Values.
- Thus, you’ll get the dataset as shown below.
- Now, select cell B3 (Sum of Frequency) and double-click on the mouse.
- The Value Field Settings dialog box will pop out.
- Type Cumulative Percentage in the Custom Name.
- Under the Show Values As tab, choose % Running Total In from the drop-down list of Show values as.
- Press OK.

- Eventually, you’ll get the precise Cumulative Percentage values.

Read More: How to Create a Grouped Frequency Distribution in Excel
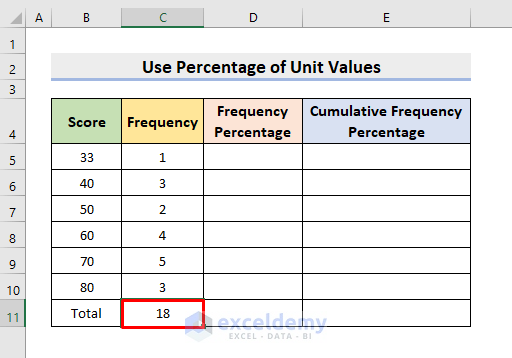
6. Find Running Total from Percentage of Unit Values
Moreover, we can find the percentage of each Frequency value first. And then, add the percentages to obtain the Cumulative Percentage. So, see the steps below to carry out the operation.
STEPS:
- Firstly, select cell C11. Use the AutoSum feature to determine the Total of the Frequencies.
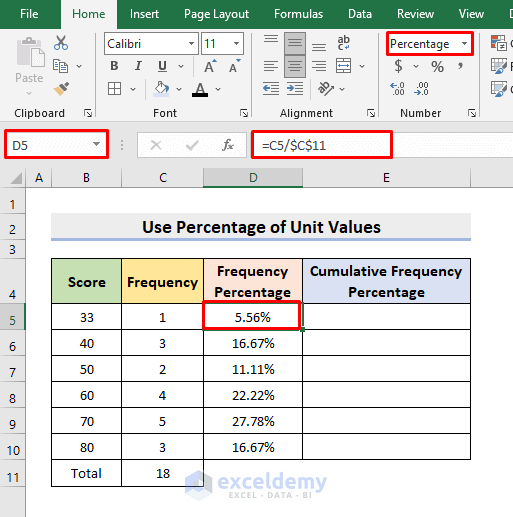
- Then, in cell D5 type the below formula:
=C5/$C$11- Return the value by pressing Enter.
- Don’t forget to choose Percentage as the Number format.
- Subsequently, use AutoFill to return the rest of the percentage values.
- Now, in cell E5, input:
=D5- Press Enter.

- Next, in cell E6, insert the formula:
=E5+D6- Complete the series by applying AutoFill.
- Hence, you’ll get the Running Total Percentage.

Download Practice Workbook
Conclusion
Henceforth, follow the above-described methods. Thus, you will be able to Calculate the Cumulative Frequency Percentage in Excel. Keep using them. Let us know if you have more ways to do the task. Don’t forget to drop comments, suggestions, or queries if you have any in the comment section below.
Related Articles
- How to Calculate Upper and Lower Limits in Excel
- How to Find Mean of Frequency Distribution in Excel
- How to Calculate Relative Frequency Distribution in Excel
- How to Calculate Cumulative Relative Frequency in Excel
<< Go Back to Frequency Distribution in Excel | Excel for Statistics | Learn Excel
Get FREE Advanced Excel Exercises with Solutions!
