Relative Frequency Distribution is an effective and time-saving statistical tool to have a broad idea about the dataset and its entries. If you are facing difficulty while calculating the relative frequency distribution of the dataset, this article is the right one to help you. In this article, we are going to calculate the relative frequency distribution in Excel with elaborate explanations.
Overview of Relative Frequency Distribution
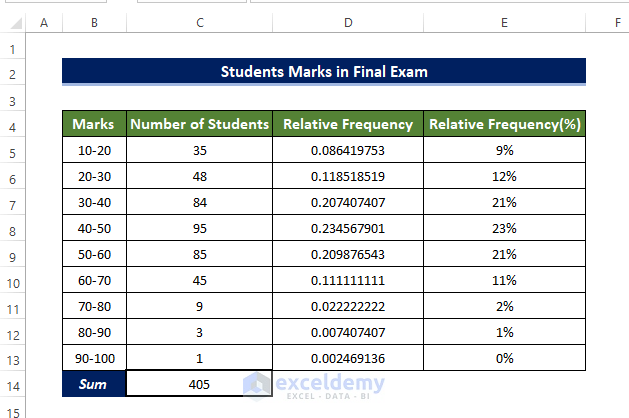
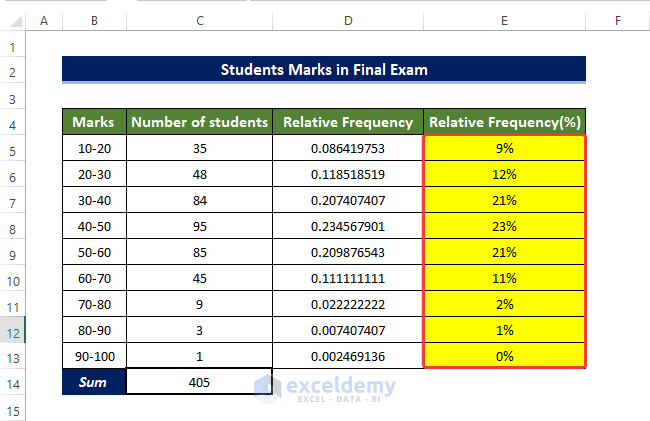
Normally with frequency, we know the number or the count of some entries. But with the relative reference distribution, we know their percentage or relative significance on the whole dataset. In other words, we determine the relative percentage of the entries. It basically calculated by dividing entries by the total summation of the dataset, like the example image below.
We basically divided each entry by the summation in cell C14. Which is difficult to understand, so also showed the relative percentage frequency distribution of the dataset.
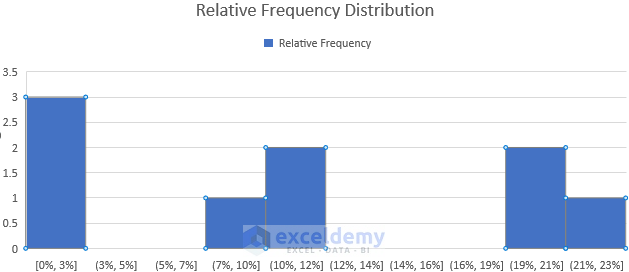
We can also prepare a histogram for better understanding. In the histogram below, we plotted to make the frequency distribution table of the dataset given above.
How to Calculate Relative Frequency Distribution in Excel: 2 Easy Methods
In this article, we are going to calculate the relative frequency distribution of different types of datasets starting from students’ final marks to the COVID weekly cases count. We opt for two methods, one is using basic formulas and the other one is using the Pivot Table.
1. Using Conventional Formula to Calculate Relative Frequency Distribution
Using simple basic formulas like the SUM function division cell referencing, we can efficiently calculate the relative frequency distribution.
Example 1: Relative Frequency Distribution of Weekly Covid-19 Cases
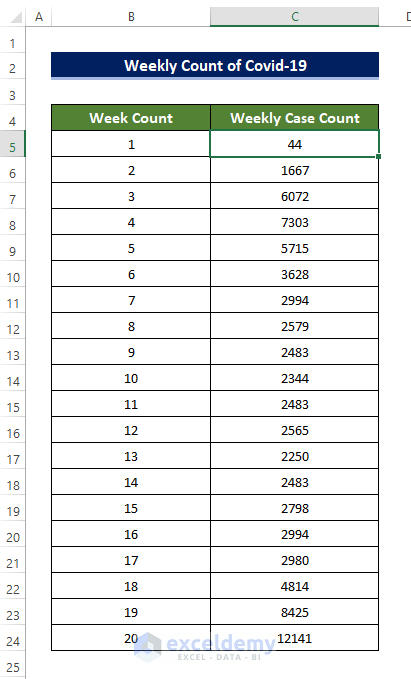
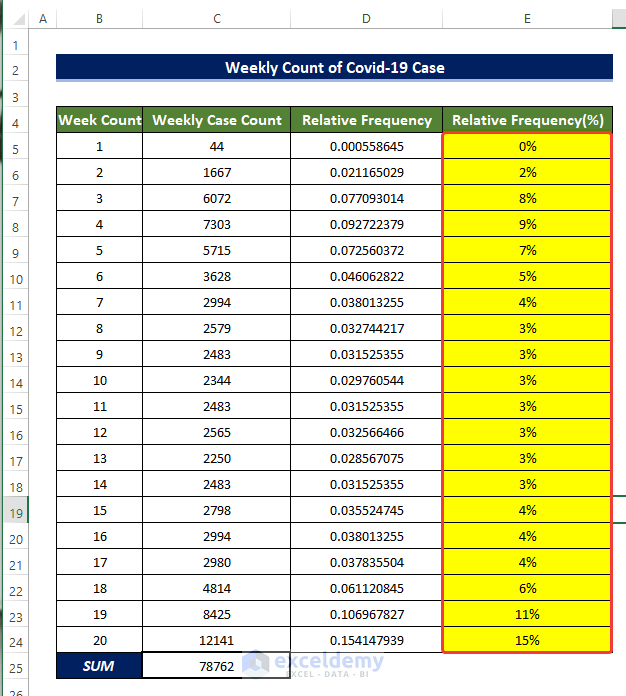
In this example, we will calculate the relative frequency distribution of weekly COVID cases in Louisiana state in the USA.
Steps
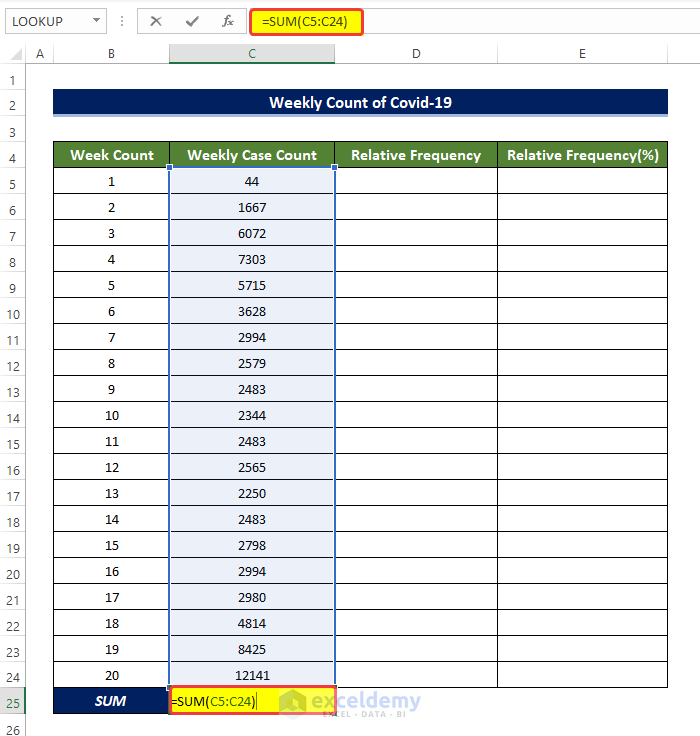
- In the beginning, click on cell C5 and enter the following formula,
=SUM(C5:C24)- Doing this will calculate the sum of contents in the range of cells C5:C24.
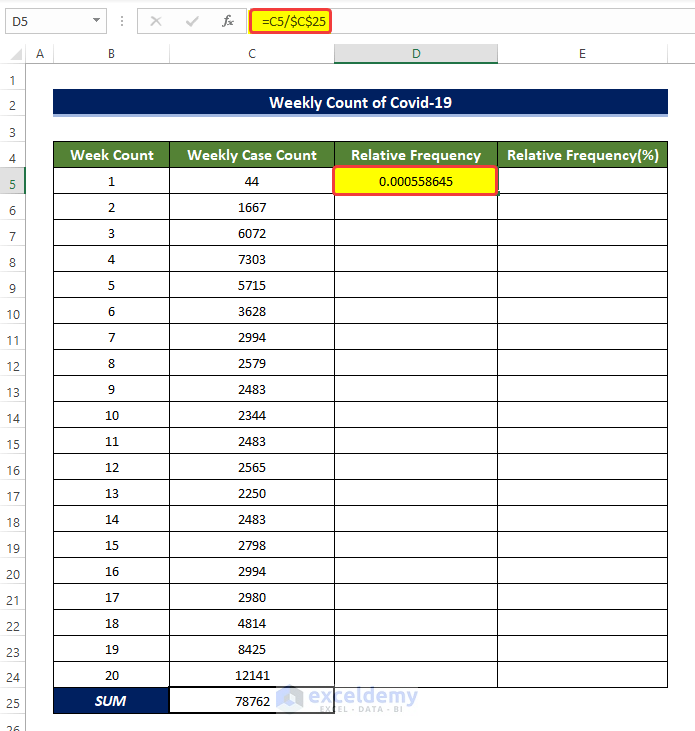
- Then select cell D5, and enter the following formula.
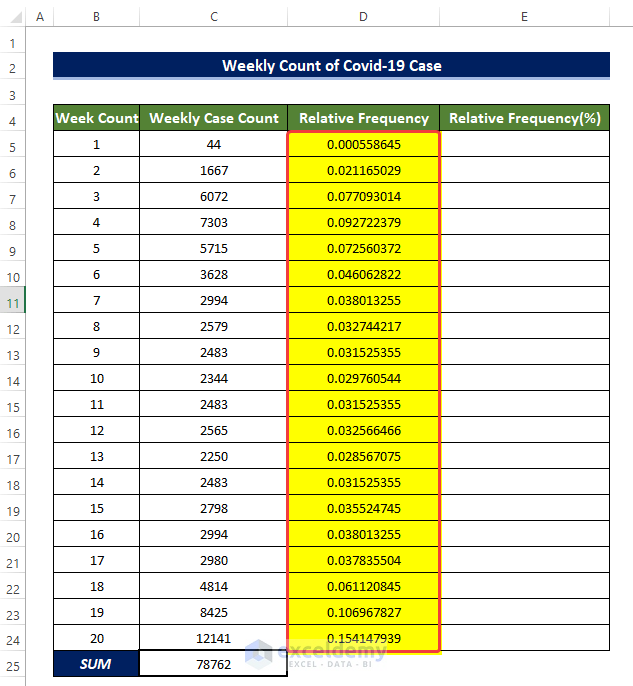
=C5/$C$25- Then drag the Fill Handle to cell D24.
- Doing this will populate the range of cells D5 to D24 with the division of cell content in the range of cells C5 to C24 with the cell value in C25.
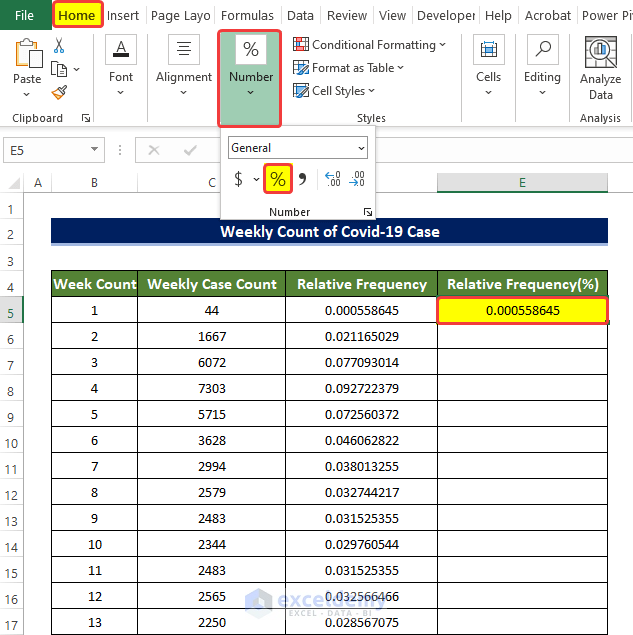
- Then copy the cell D5 and copy the content of this cell to cell E5.
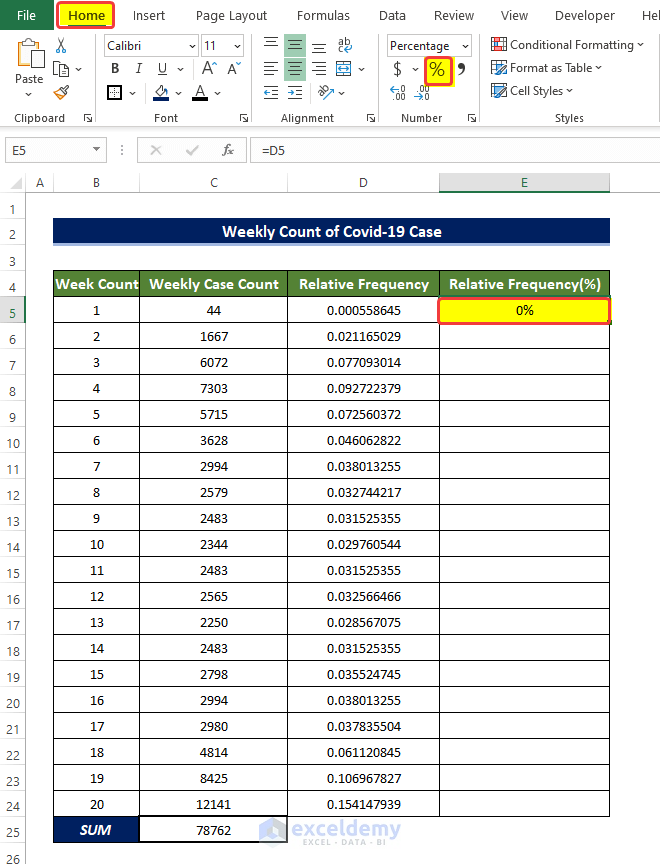
- Then from the Number group in the Home tab, click on the Percentage sign to convert the decimal to percentage.
- Then drag the Fill Handle to cell E24.
- Doing this will populate the range of cells E5:E24 with the relative percentage of the Weekly count of COVID cases.
Example 2: Relative Frequency Distribution of Students’ Marks
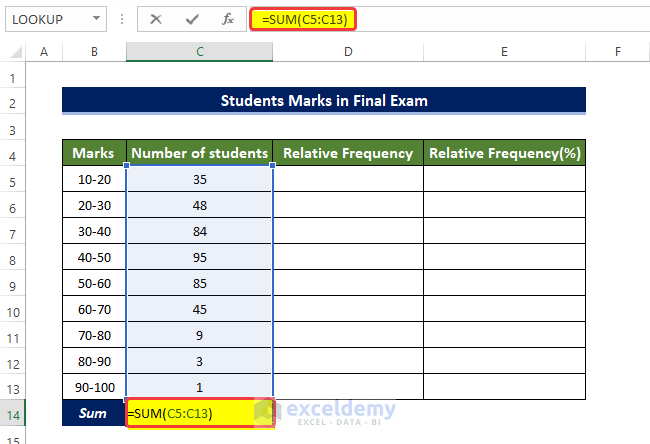
Here, we are going to determine the Relative Frequency Distribution of the marks of the students in the final exam using basic formulas.
Steps
- In the beginning, click on cell C5 and enter the following formula,
=SUM(C5:C13)- Doing this will calculate the sum of contents in the range of cells C5:C13.
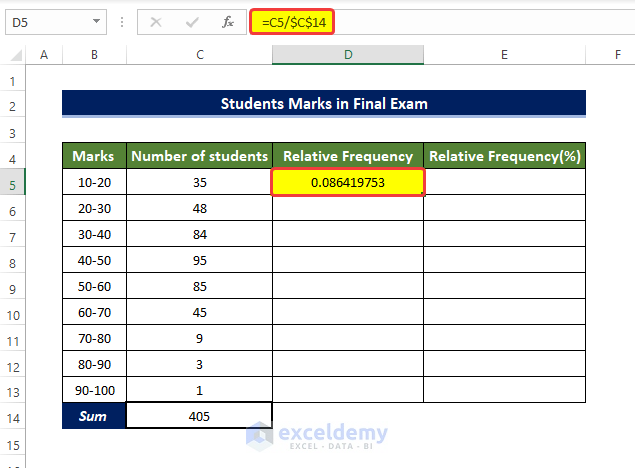
- Then select cell D5, and enter the following formula.
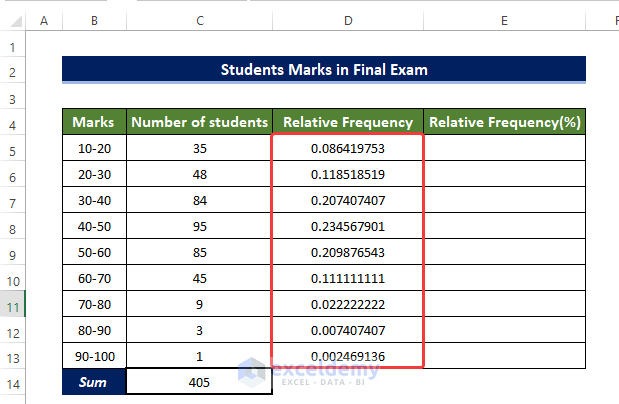
=C5/$C$14- Then drag the Fill Handle to cell D13.
- Doing this will populate the range of cells D5 to D13 with the division of cell content in the range of cells C5 to C13 with the cell value in C14.
- Then copy the range of cells D5:D13 to the range of cells E5:E13.
- Then select the range of cells E5:E13 and then from the Number group in the Home tab, click on the Percentage Sign (%).
- Doing this will convert all the relative frequency distribution values in the range of cells E5:E13 to percentage relative frequency distribution.
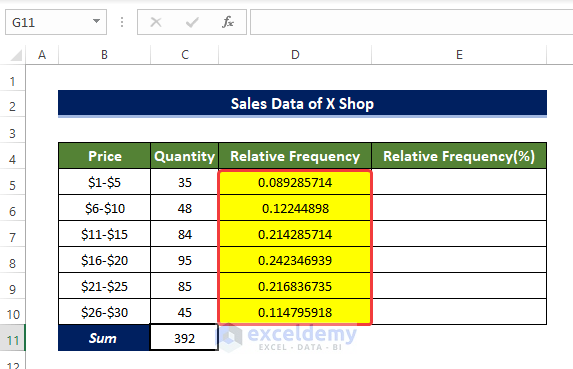
Example 3: Relative Frequency Distribution of Sales Data
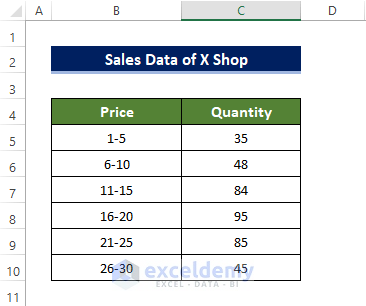
The Relative Frequency Distribution of the sales data of a daily shop is going to be determined in this example.
Steps
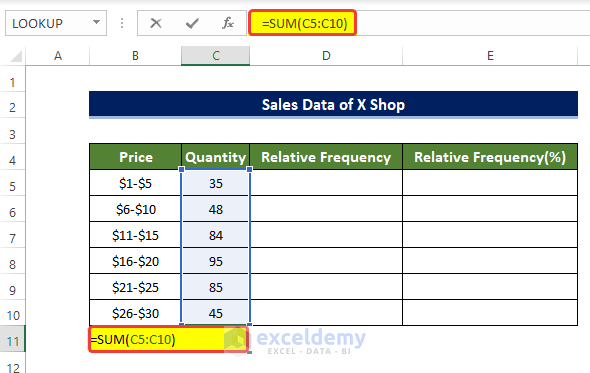
- In the beginning, click on cell C5 and enter the following formula,
=SUM(C5:C10)- Doing this will calculate the sum of contents in the range of cells C5:C10.
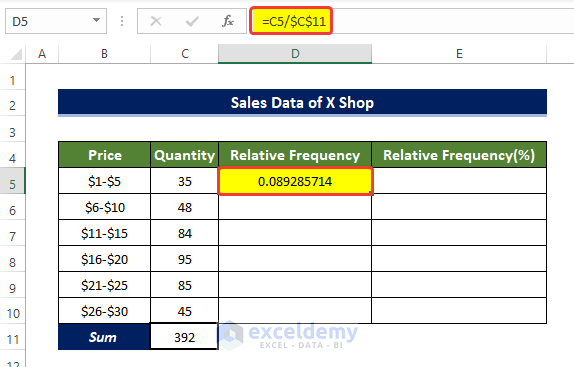
- Then select cell D5, and enter the following formula.
=C5/$C$11- Then drag the Fill Handle to cell D10.
- Doing this will populate the range of cells D5 to D10 with the division of cell content in the range of cells C5 to C10 with the cell value in C11.
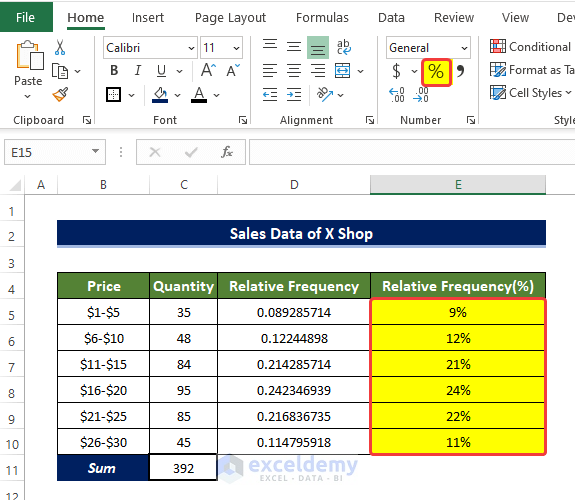
- Then copy the range of cells D5:D10 to the range of cells E5:E10.
- Then select the range of cells E5:E10 and then from the Number group in the Home tab, click on the Percentage Sign.
- Doing this will convert all the relative frequency distribution values in the range of cells E5:E10 to percentage relative frequency distribution.
This is how we can calculate relative frequency distribution in Excel using three separate examples using simple formulas.
Read More: How to Make Frequency Distribution Table in Excel
2. Use of Pivot Table to Calculate Relative Frequency Distribution
Pivot table is extremely powerful to manipulate the tables in Excel.
We can use and manipulate the dataset the extract the relative frequency distribution values quite efficiently.
Example 1: Relative Frequency Distribution of Weekly Covid-19 Cases
Utilizing the Pivot Table, in this example, we will calculate the relative frequency distribution of weekly COVID cases in Louisiana state in the USA.
Steps
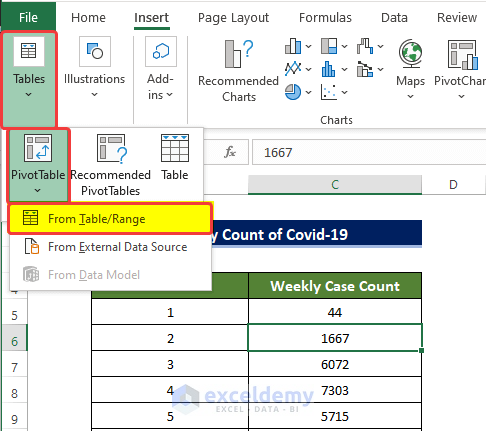
- From the Insert tab, go to Tables > Pivot Table > From Table/Range.
- A small window will spawn, where you need to specify the location of the new table and the range of our data. We select the range of cell B4:C24 in the first range box.
- We choose New Worksheet under the Choose where you want the Pivot table to be placed the option.
- Click OK after this.
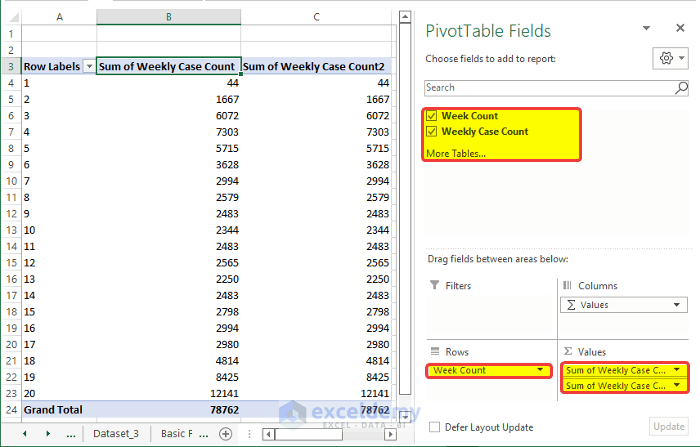
- A new window with the PivotTable Fields side panel will open.
- In that panel, drag the Weekly Case Count to the Values field two times.
- Furthermore, drag the Week Count to the Rows field.
- After dragging those columns, there will be a Pivot Table on the left side based on our selection.
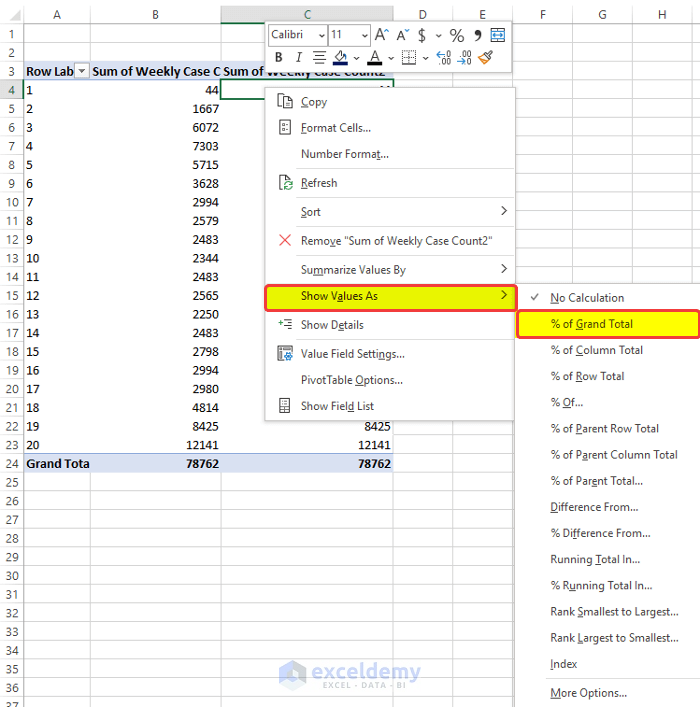
- Then click on the rightmost column and right-click on it.
- Then from the context menu, go to Show Values As > % of Grand Total.
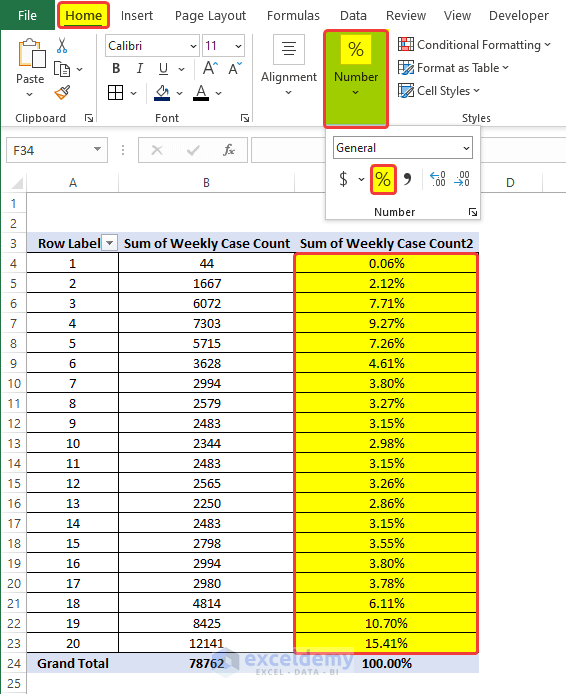
- After clicking on the % of Grand Total, you will observe that the range of cells C4 to C24 now has their relative frequency distribution in the percentage format.
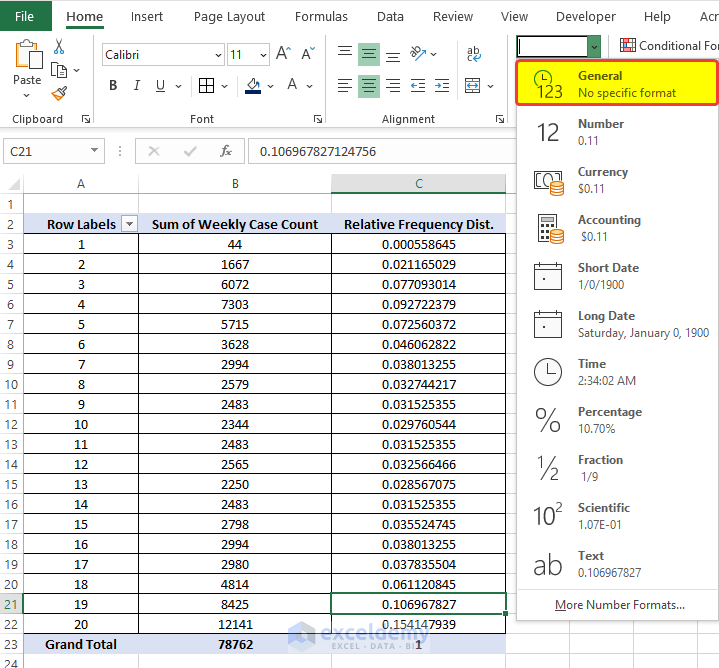
- Then again select the range of cells C4:C24, and then from the Number group in the Home tab, click on the Number Properties then from the drop-down menu, click on the General.
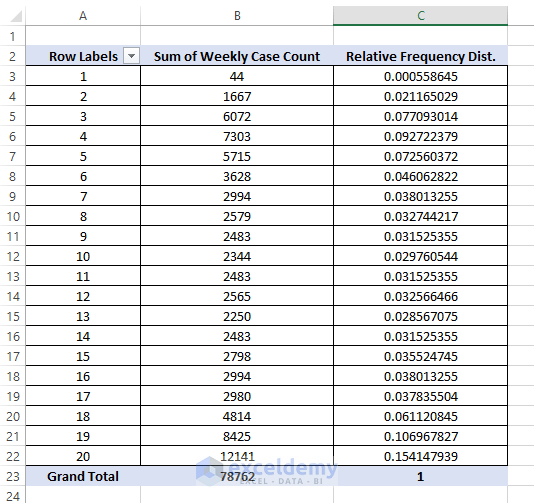
- Then you will notice that the range of cells C5 to C24 is now filled with the relative frequency distribution of the student’s marks.
Example 2: Relative Frequency Distribution of Students’ Marks
Utilizing the Pivot Table, here, we are going to determine the Relative Frequency Distribution of the marks of the students in the final exam using basic formulas.
Steps
- From the Insert tab, go to Tables > Pivot Table > From Table/Range.
- A small window will spawn, where you need to specify the location of the new table and the range of our data. We select the range of cell B4:C13 in the first range box.
- We choose New Worksheet under the Choose where you want the Pivot table to be placed the option.
- Click OK after this.
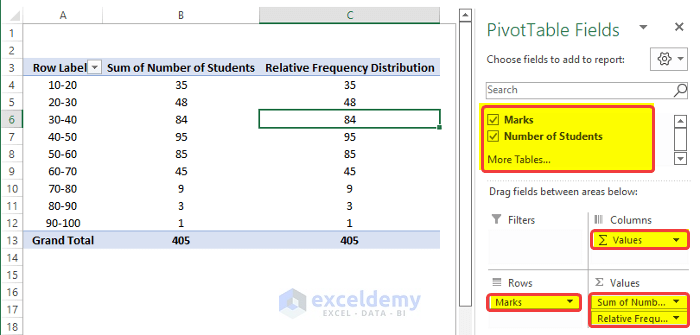
- A new window with the PivotTable Fields side panel will open.
- In that panel, drag the Weekly Case Count to the Values field two times.
- Furthermore, drag the Week Count to the Rows field
- After dragging those columns, there will be a Pivot Table on the left side based on our selection.
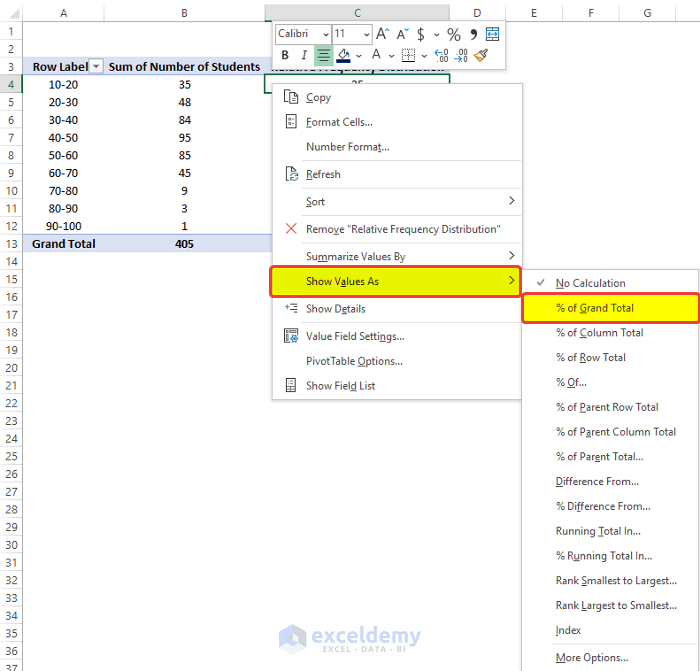
- Then click on the rightmost column and then right-click on it.
- Then from the context menu, go to Show Value As > % of Grand Total.
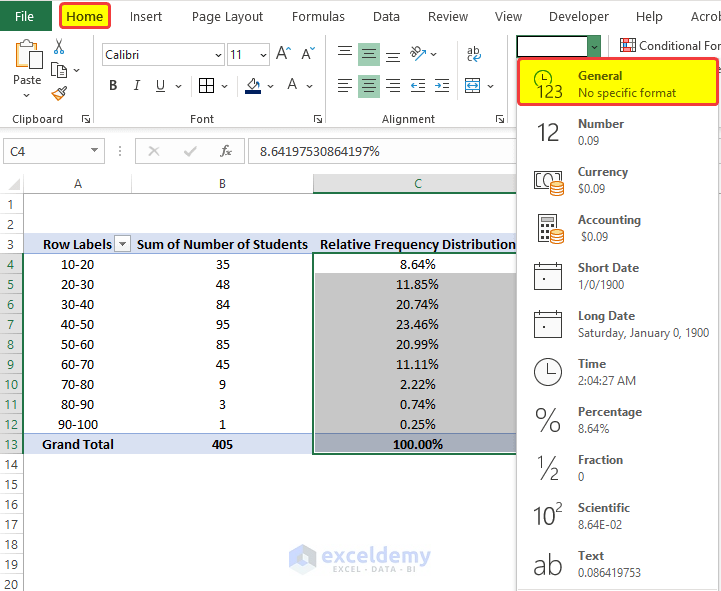
- Then again select the range of cells C4:C13, and then from the Number group in the Home tab, click on the Number Properties, then from the drop-down menu, click on the General.
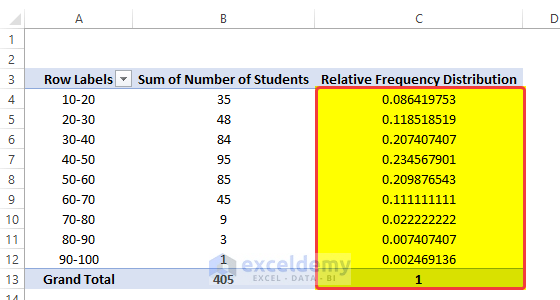
- Then you will notice that the range of cells C4 to C24 is now filled with the relative frequency distribution of the students’ marks.
In this way, you can calculate relative frequency distribution in Excel.
Example 3: Relative Frequency Distribution of Sales Data
Using the Pivot Table, the Relative Frequency distribution of the sales data of a daily shop is going to be determined in this example.
Steps
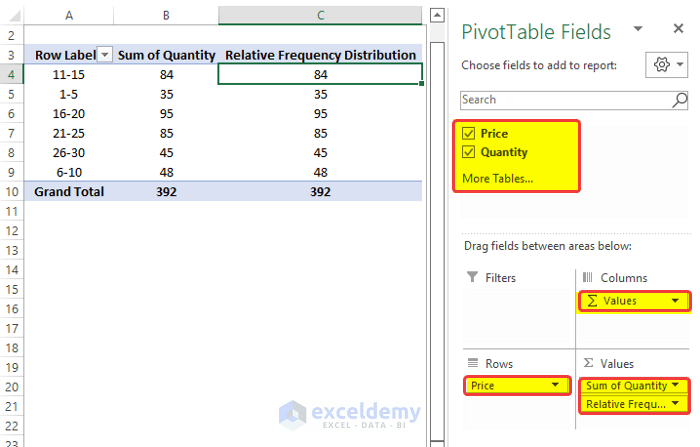
- From the Insert tab, go to Tables > Pivot Table > From Table/Range.
- A small window will spawn, where you need to specify the location of the new table and the range of our data. We select the range of cell B4:C10 in the first range box.
- We choose New Worksheet under the Choose where you want the Pivot table to be placed the option.
- Click OK after this.
- A new window with the PivotTable Fields side panel will open.
- In that panel, drag the Weekly Case Count to the Values field two times.
- Furthermore, drag the Week Count to the Rows field.
- After dragging those columns, there will be a Pivot Table on the left side based on our selection.
- Then click on the rightmost column and right-click on it.
- Next from the context menu, go to Show Values As > % of Grand Total.
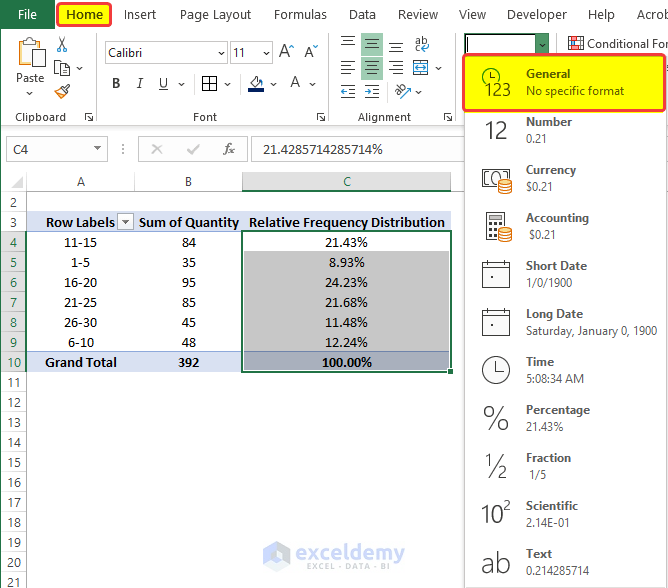
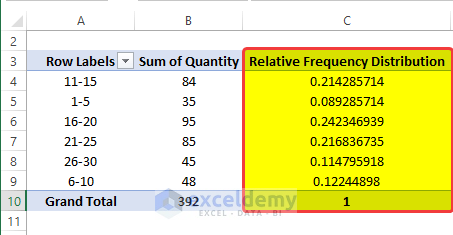
- Then again select the range of cells C4:C10, and then from the Number group in the Home tab, click on the Number Properties, then from the drop-down menu, click on the General.
- Then you will notice that the range of cells C4 to C10 is now filled with the relative frequency distribution of the students’ marks.
This is how we can calculate relative frequency distribution in Excel using three separate examples using the Pivot table.
Read More: How to Create a Grouped Frequency Distribution in Excel
Download Practice Workbook
Conclusion
To sum it up, the question “how to calculate relative frequency distribution in Excel” is answered here in 2 different ways. Starting from using the Basic formulas continued to use Pivot Table. Among all of the methods used here, using Basic formulas is the easier to understand and simple one.
For this problem, a workbook is attached where you can practice and get used to these methods.
Feel free to ask any questions or feedback through the comment section. Any suggestion for the betterment of our community will be highly appreciated.
Related Articles
- How to Calculate Upper and Lower Limits in Excel
- How to Find Mean of Frequency Distribution in Excel
- How to Make a Relative Frequency Histogram in Excel
- How to Do a Frequency Distribution on Excel
- How to Calculate Cumulative Relative Frequency in Excel
- How to Calculate Cumulative Frequency Percentage in Excel
<< Go Back to Frequency Distribution in Excel | Excel for Statistics | Learn Excel
Get FREE Advanced Excel Exercises with Solutions!