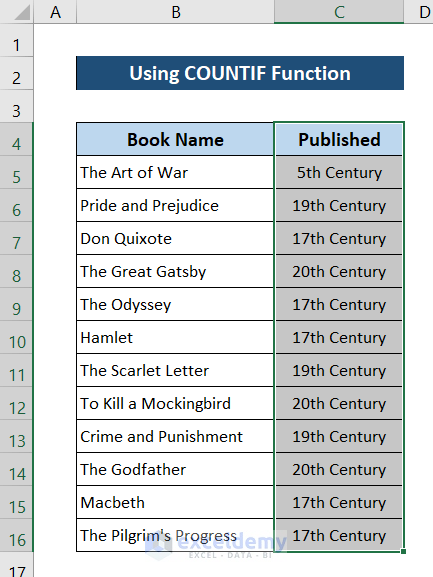
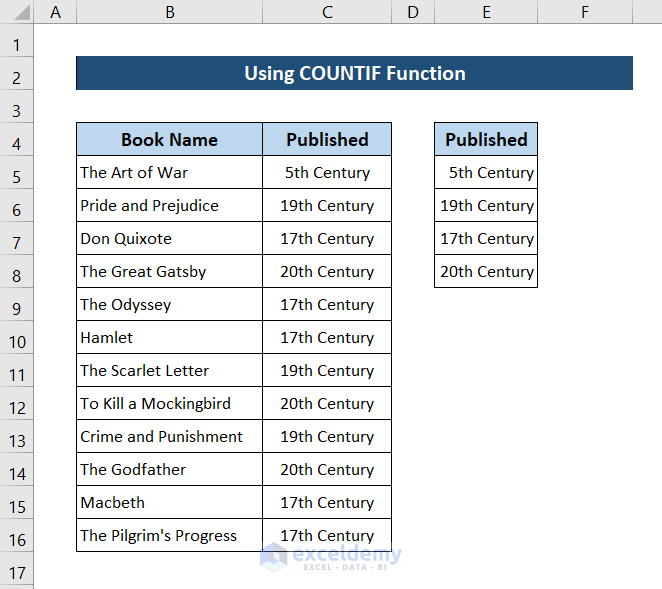
To make a categorical frequency table, we need a dataset to gather data from. We will be using the following sample dataset for illustration.
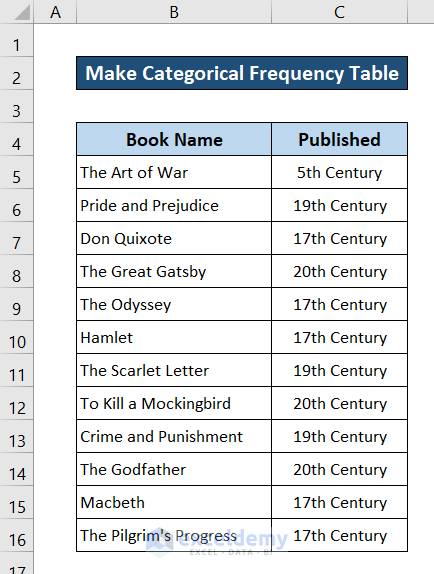
This is a list of books- a list of categorical variables listed with the published date in centuries- another set of variables. You can see some books belong to the same century. To make a categorical frequency table, we will determine how many times a book was published in a particular century.
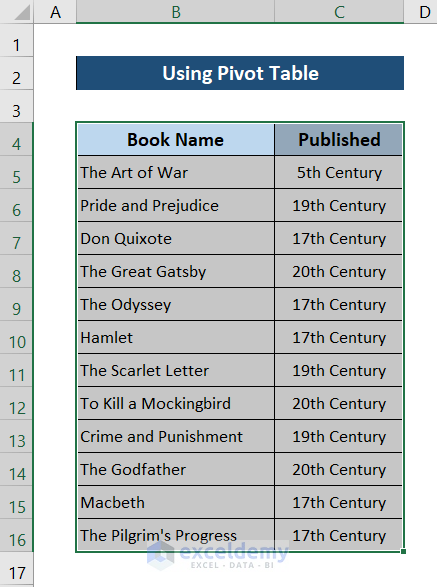
Method 1 – Using Pivot Table
Steps:
- Select the whole dataset.
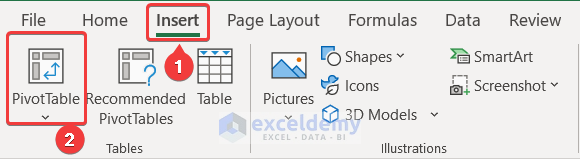
- Go to the Insert tab in your ribbon.
- Select PivotTable under the Tables group.
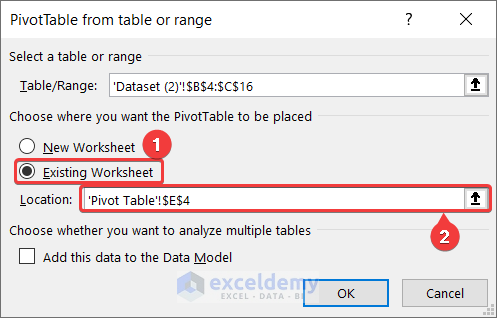
- In the box that popped up, select the place where you want to create your pivot table. In this case, you can select either a new worksheet for the table or the existing one. We are using the existing one and selecting cell E4 for the pivot table to start. After your selection, click on OK.
- In PivotTable Fields, click the Published field and drag it to both the Rows and Values.
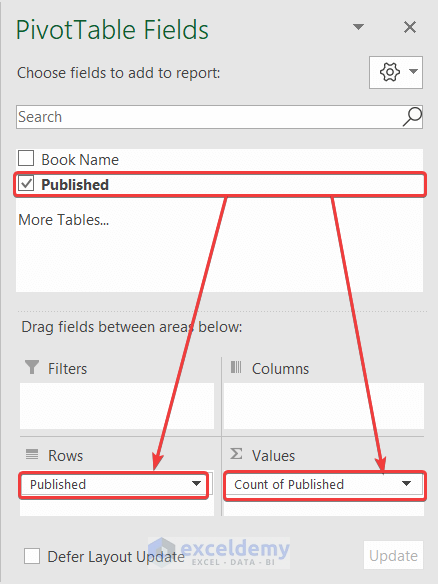
- A pivot table will appear on the spreadsheet.
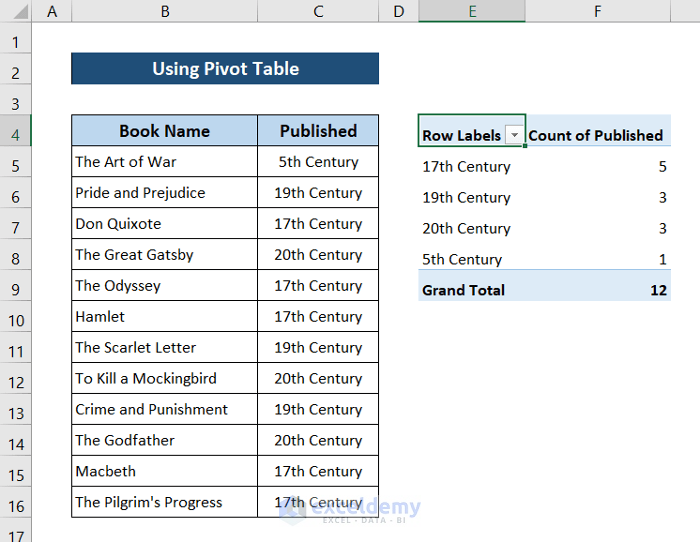
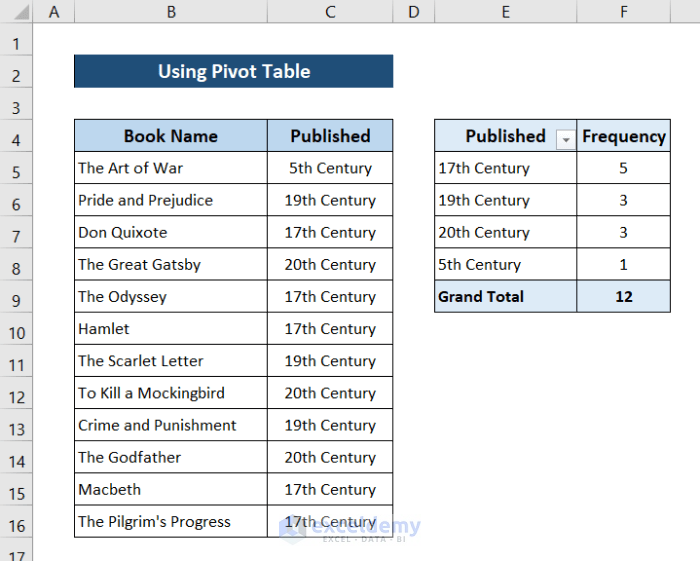
- Modify the pivot table according to your preferences.
Steps to Add Chart:
- Select a cell in the pivot table.
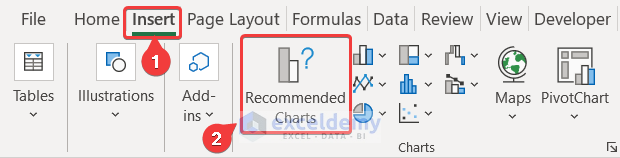
- Go to the Insert tab on your ribbon.
- Select Recommended Charts from the Charts group.
- Select the type of chart you want in the Insert Chart. We have selected the column chart from the Column tab.
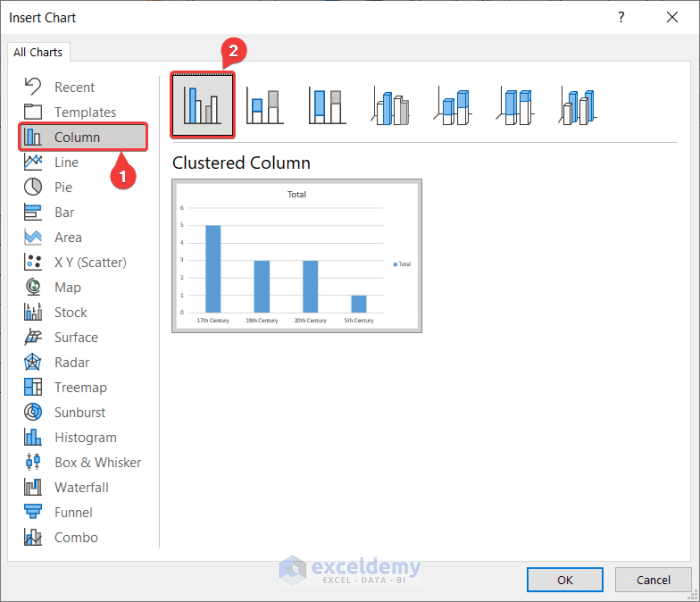
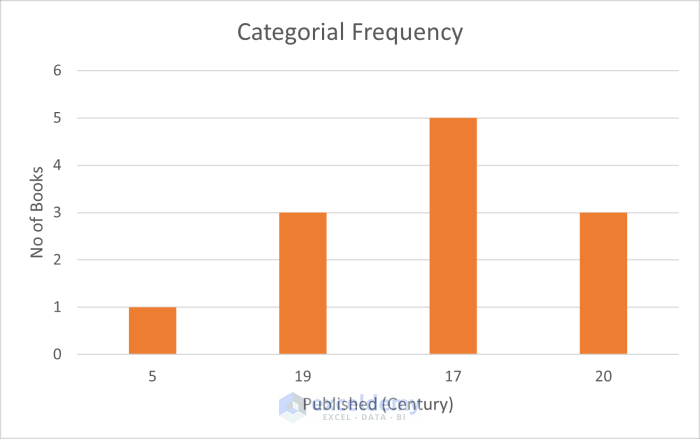
- After clicking on OK, a chart will appear depending on the values of the categorical frequency table.
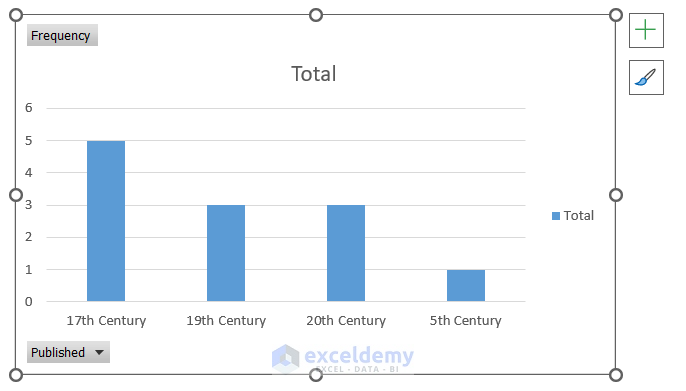
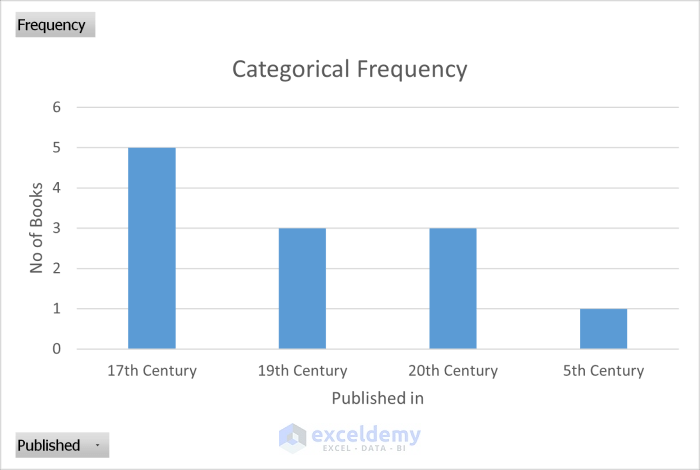
- You can modify the graph as required.
Read More: How to Calculate Percent Frequency Distribution in Excel
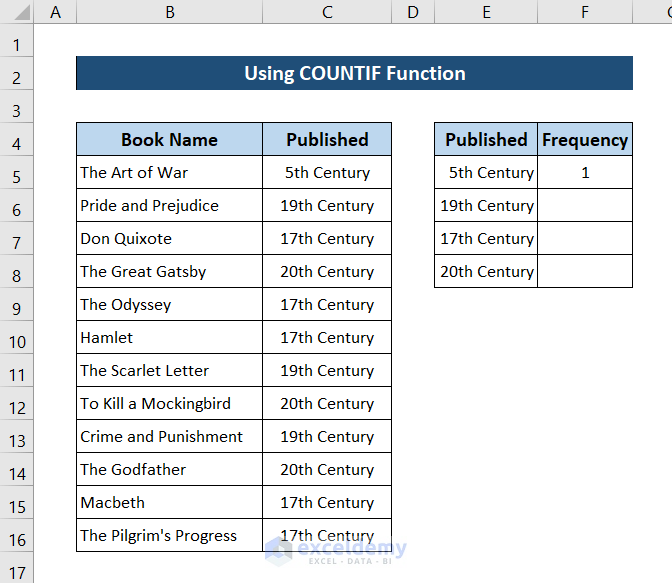
Method 2 – Applying COUNTIF Function
Steps:
- Select the column containing the variable of which you are making a categorical frequency table.
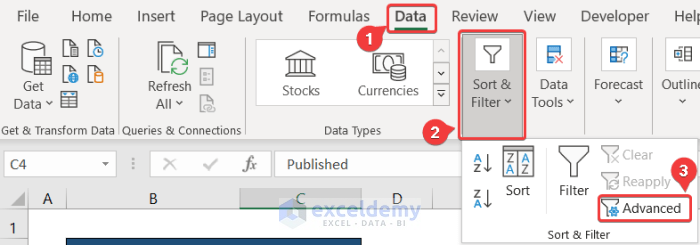
- Go to the Data tab on your ribbon.
- Select Advanced from the Sort & Filter group.
- In the Advanced Filter box, select the Copy to another location option as we are making the table in a different space.
- Select the cell you want to copy to. Make sure you check the Unique records only option.
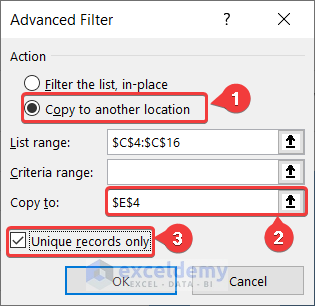
- Click on OK.
- A column with all the categorical variables will be created.
- Select cell F5 and enter the following formula.
=COUNTIF($C$5:$C$16,E5)
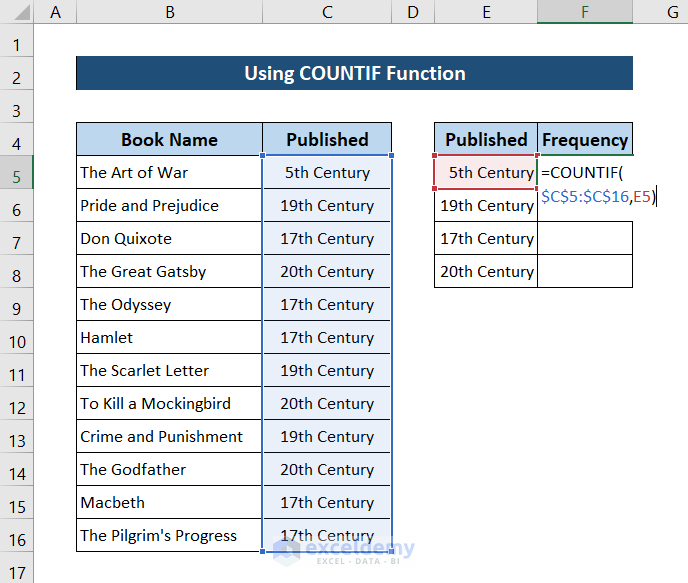
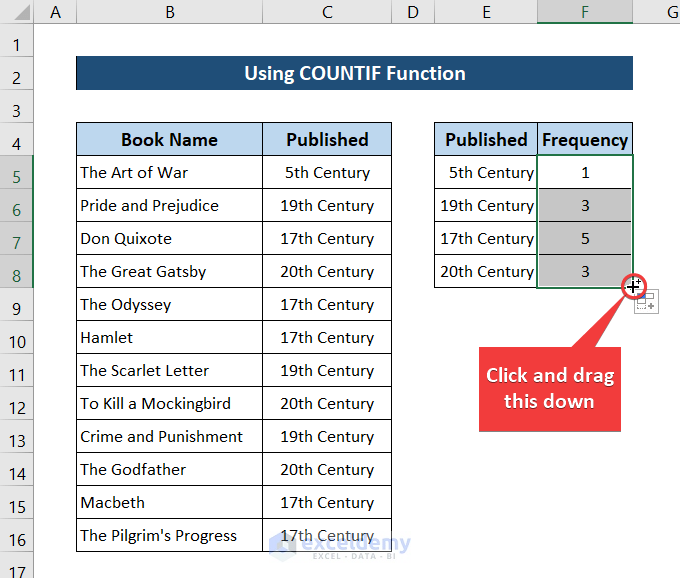
- Press Enter. You will have the frequency of the first value.
- Use the Fill Handle tool for the remaining cells.
Steps to Add Chart:
- Select the table.
- Go to the Insert tab on your ribbon.
- Select Recommended Charts from the Charts group.
- Select the type of chart you want in the Insert Chart. We have selected the column chart from the Column tab.
- After clicking on OK, a chart will be inserted depending on the values of the categorical frequency table.
- You can make modifications to the chart as preferred.
Read More: How to Make a Contingency Table in Excel
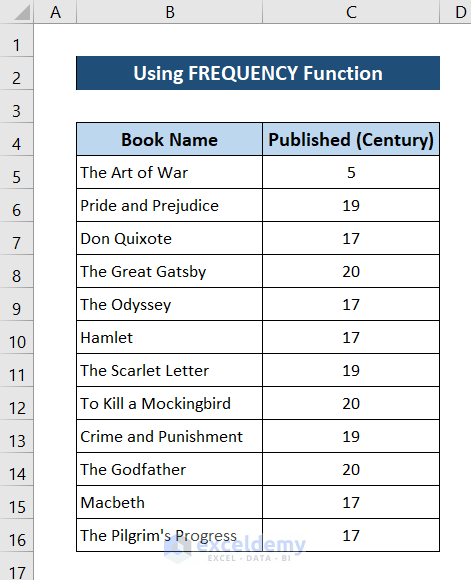
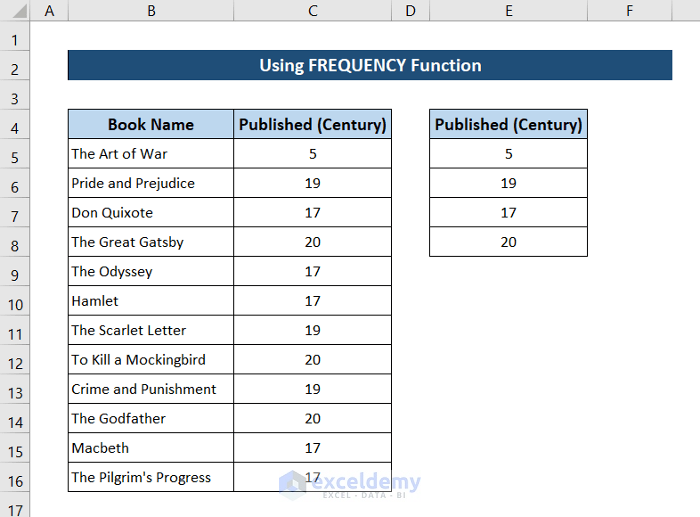
Method 3 – Use of FREQUENCY Function
The FREQUENCY function takes two arguments- data array and bins array. It searches for the bins array values in the data array range and returns an array consisting of the number of times each value of the bins array occurred in the former array.
This function is applicable only to numbers. So, we have made modifications to the sample dataset.
Steps:
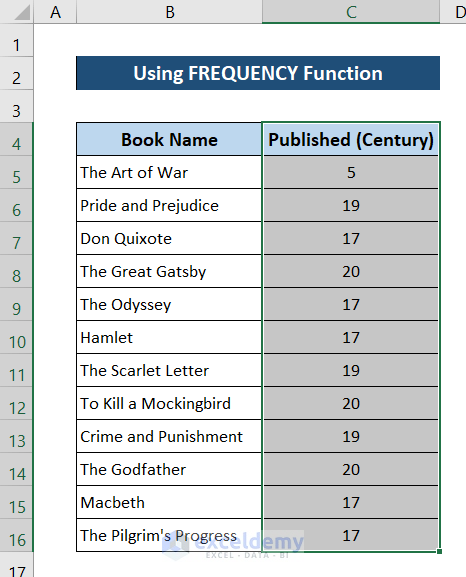
- Select the column containing the variable you are making a categorical frequency table of.
- Go to the Data tab on your ribbon.
- Select Advanced from the Sort & Filter group.
- In the Advanced Filter box, select the Copy to another location option as we are making the table in a different space.
- Select the cell you want to copy to. Make sure you check the Unique records only option.
- Click on OK.
- A column with all the categorical variables will be created.
- Select the range F5:F8 and enter the following formula.
=FREQUENCY(C5:C16,E5:E8)
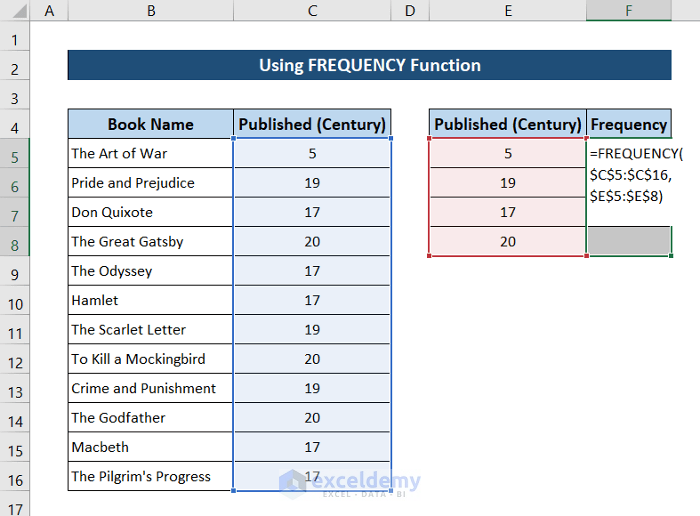
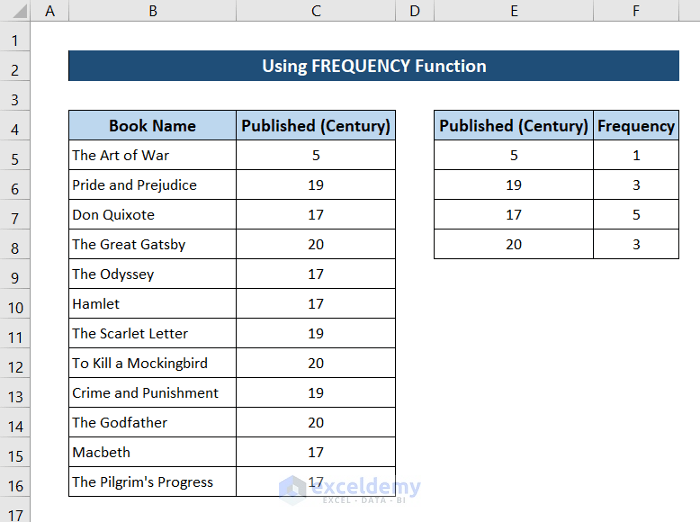
- Press Ctrl+Shift+Enter on your keyboard. This will automatically fill up the array and will give us a categorical frequency table.
Steps to Add Chart:
- Select the table.
- Go to the Insert tab on your ribbon.
- Select Recommended Charts from the Charts group.
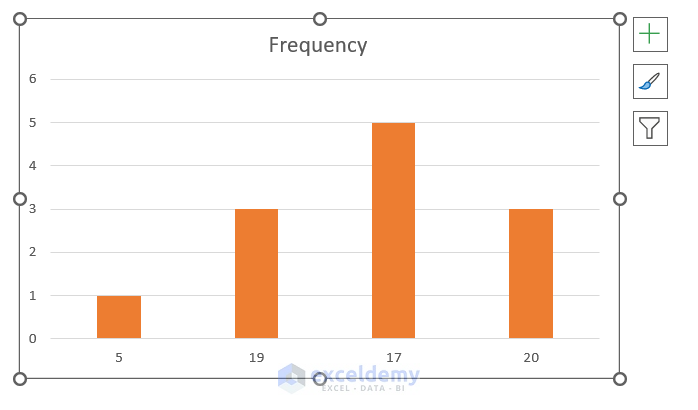
- Select the type of chart you want in the Insert Chart. We have selected the column chart from the Column tab.
- After clicking on OK, a chart will be inserted depending on the values of the categorical frequency table.
- You can modify the chart as required.
Read More: How to Make a Relative Frequency Table in Excel
Things to Remember
- While using the pivot table method, put in the same categorical variable field in both rows and values area.
- Make sure to copy the categorical variable column while using advanced filtering or it will overlap the existing dataset, and no frequency table will be possible regardless of the function you use.
- The FREQUENCY function can only be used for numerical values. So make sure your dataset from where you are taking categorical frequency is numerical.
- A range of cells should be selected before entering the FREQUENCY function. The range should be the length of the result array.
- Always use Ctrl+Shift+Enter for functions like the FREQUENCY function where the output is an array.
Download Practice Workbook
Related Articles
<< Go Back to Frequency Distribution in Excel | Excel for Statistics | Learn Excel
Get FREE Advanced Excel Exercises with Solutions!
