A percent frequency distribution can help you figure out what proportion of the distribution is made up of specific values. By grouping values together, a frequency distribution summarizes how often each value occurs. Today, In this article, we’ll get to learn how we can calculate percent frequency distribution Excel effectively with appropriate illustrations.
How to Calculate Percent Frequency Distribution in Excel: 2 Suitable Ways
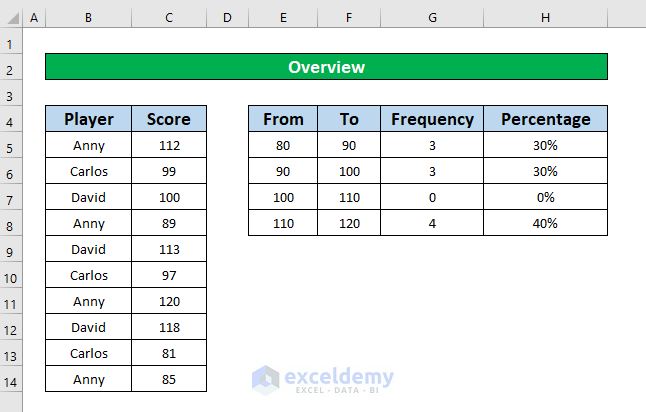
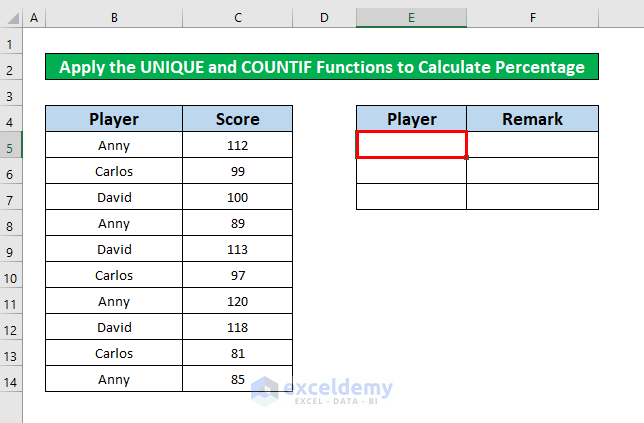
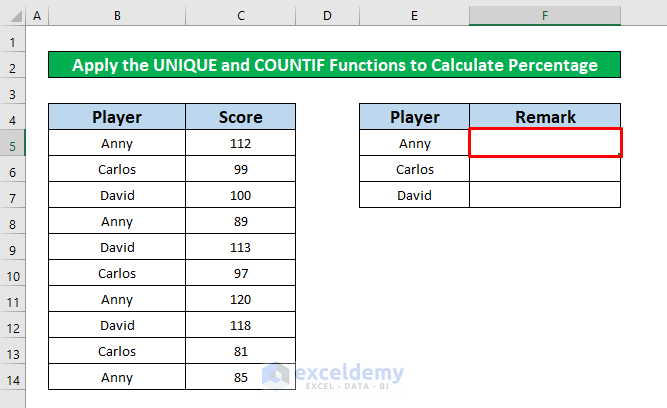
Let’s say, we have a dataset that contains information about 10 different cricket players. From our dataset, some Cricketer Names and their Score are given in column B and column C respectively. Here’s an overview of the dataset for our today’s task.
1. Apply the UNIQUE and COUNTIF Functions to Calculate Percent Frequency Distribution in Excel
In this method, from our dataset, we want to calculate the percent frequency distribution in Excel by using the UNIQUE and COUNTIF functions. To calculate the percent frequency distribution by using the UNIQUE and COUNTIF functions, follow the steps below.
- First, we calculate the number of unique cricketer names by applying the UNIQUE function to calculate the percent frequency distribution. For that, select cell E5.
- Now, write down the UNIQUE function in that cell. The UNIQUE function is,
=UNIQUE(B5:B14)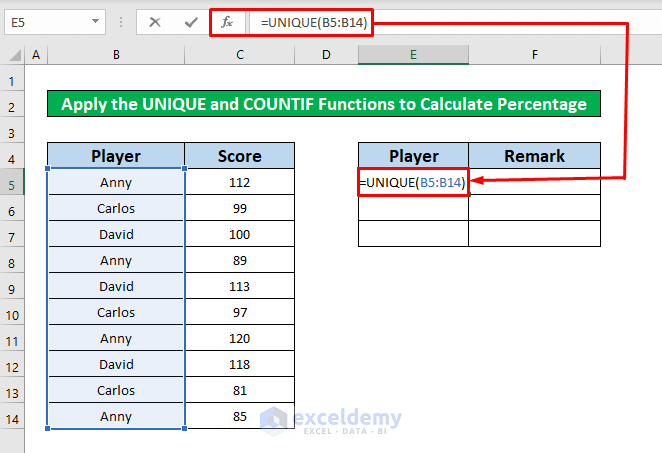
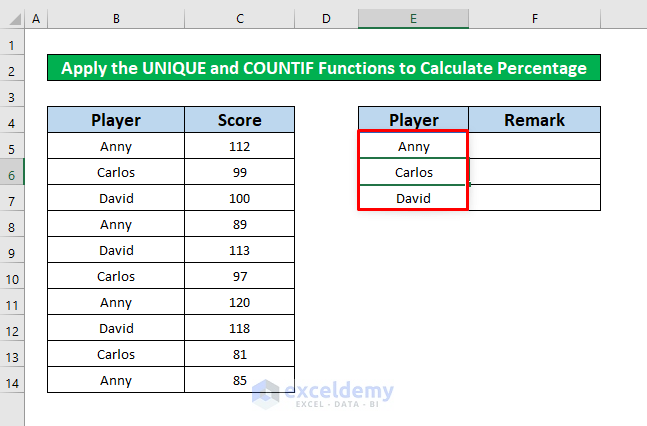
- After typing the UNIQUE Function in the Formula Bar, Press Enter on your keyboard and you will get the name of the unique Cricketer in column E.
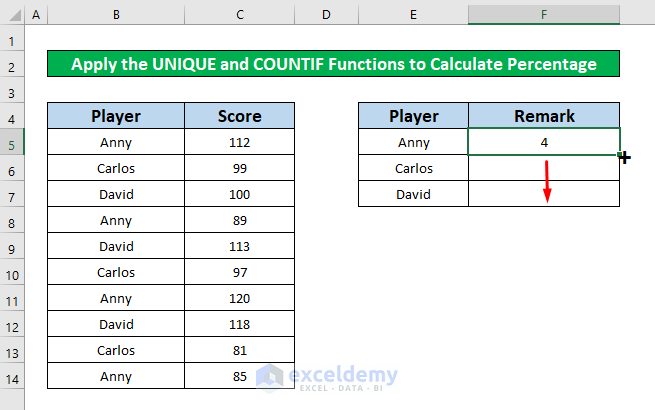
- Now, we’ll apply the COUNTIF function to find out the total number of appearances of each name. To apply the COUNTIF function select cell F5.
- In cell F5, type the COUNTIF function. The COUNTIF function is,
=COUNTIF(B5:B14,E5)
- After typing the function, simply press Enter on your keyboard and you will get 4 as the return of the COUNTIF function.

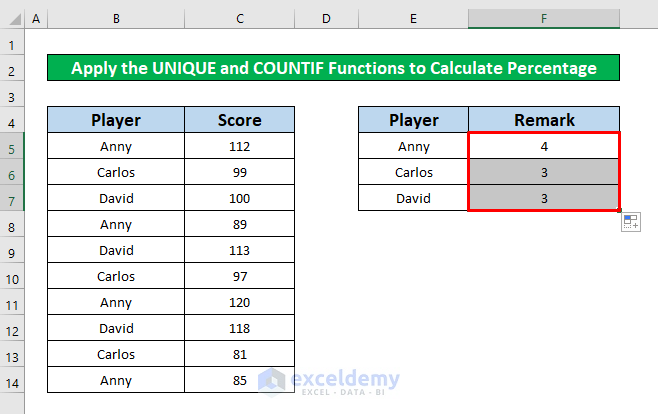
- After that, place your cursor on the bottom right side of cell F5 and an autoFill sign pops up. Now, drag the autoFill sign downward.
- While completing the above process, you will be able to get the output of the COUNTIF function.
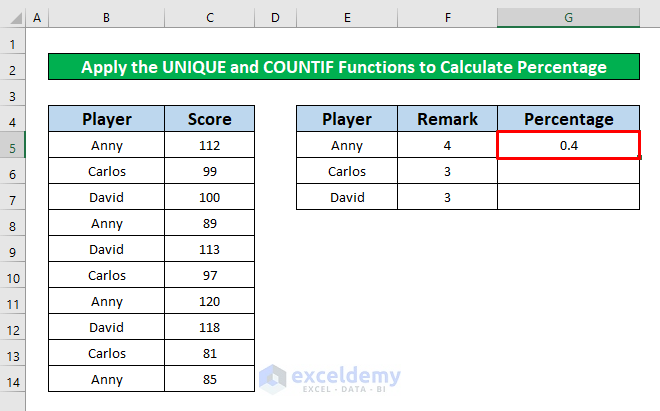
- Again, select a new cell G5 to calculate the percent frequency distribution.
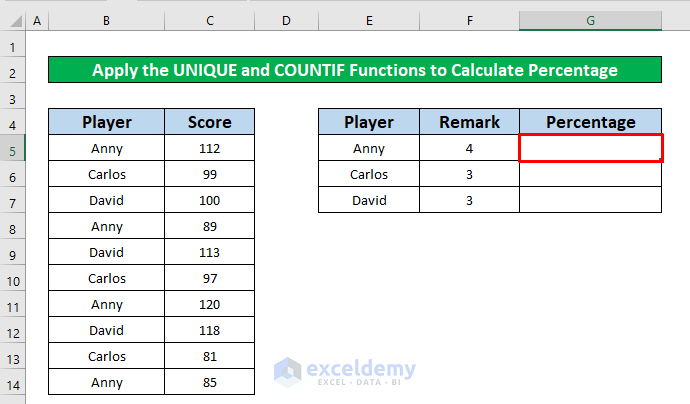
- After selecting cell G5, write down the formula that has been given below.
=F5/SUM($F$5:$F$7)
- Again, press Enter on your keyboard and you will get 4 as the output of the function.
- After that, place your cursor on the bottom right side of cell F5 and an autoFill sign pops us. Now, drag the autoFill sign downward to get your desired output.
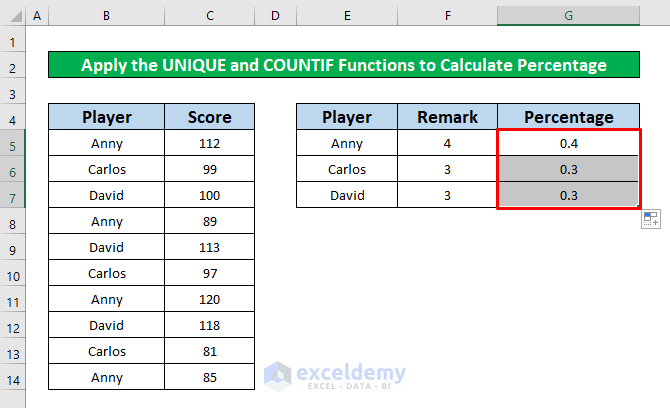
- Look at column G, you will be able to see the fraction value. Now, we’ll convert these fractions into percentages. To do that, from Home Tab, go to,
Home → Number → Percentage
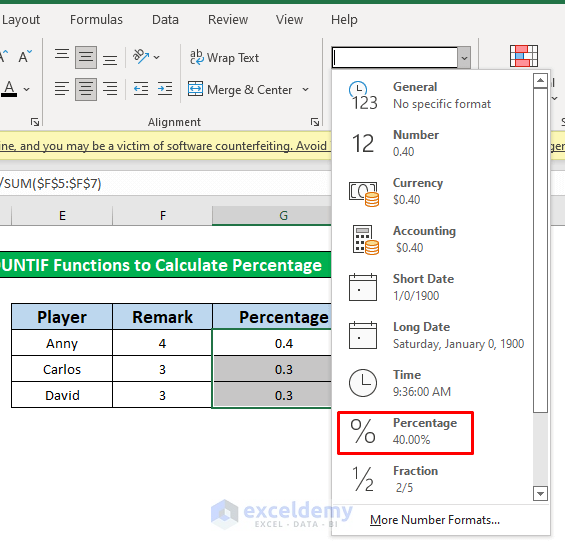
- Finally, by clicking on the Percentage option, you will be able to convert fractions into percentages which have been given in the screenshot.

Read More: How to Make a Relative Frequency Table in Excel
2. Insert the FREQUENCY Function to Calculate Percent Frequency Distribution in Excel
Here, we’ll learn how to calculate the percent frequency distribution by using the FREQUENCY function. Please follow the instructions below to learn!
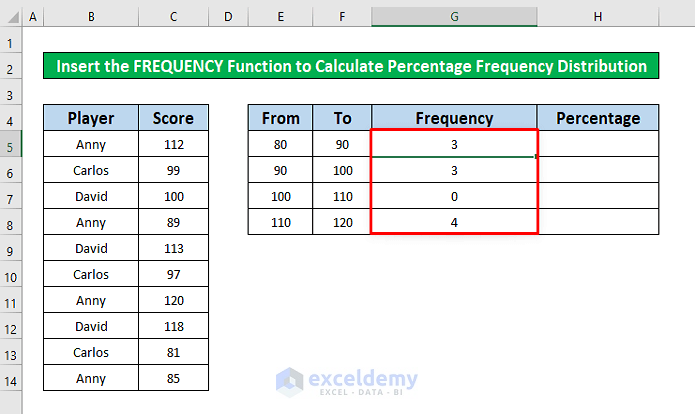
- First of all, select cell G5.
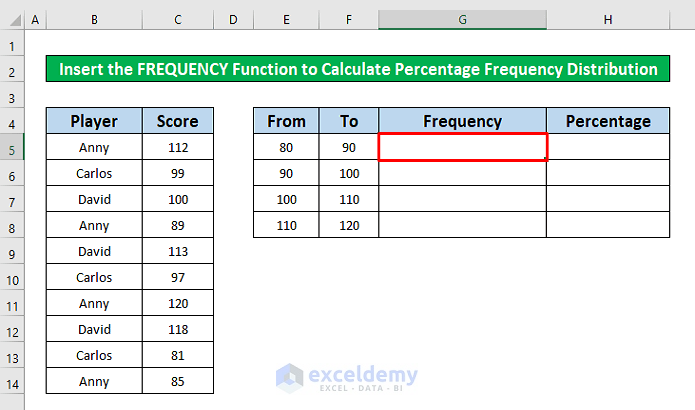
- After selecting cell G5, type the FREQUENCY Function in the Formula Bar. The FREQUENCY Function in the Formula Bar is,
=FREQUENCY(C5:C14, F5:F7)
- Now, simply press Enter on your keyboard and you will be able to get the output of the FREQUENCY function in column G.
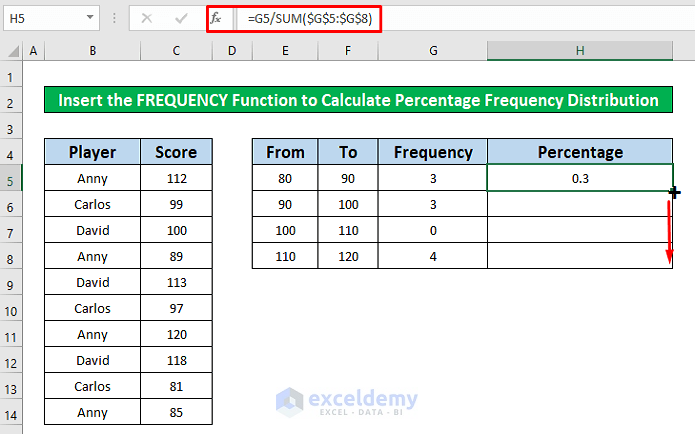
- After completing the above process, select a new cell to calculate the percent frequency distribution. From our dataset, we’ll select cell H5 and write down the below formula.
=G5/SUM($G$5:$G$8)
- Again, press Enter on your keyboard and you will be able to get 3 as the output of the formula in cell H5.
- After that, place your cursor on the bottom right side of cell F5 and an autoFill sign pops us. Now, drag the autoFill sign downward to get the return of the formula that has been given in column H.
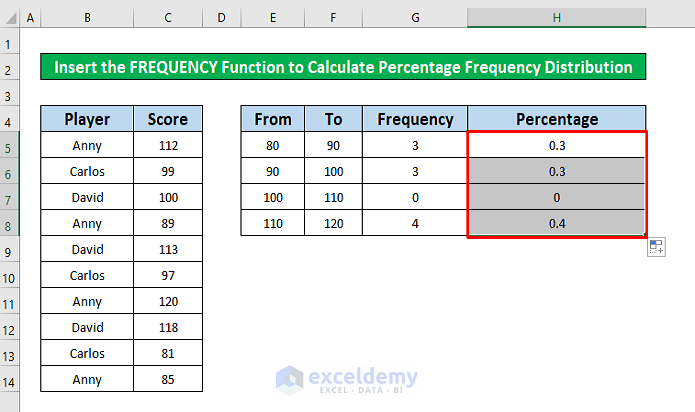
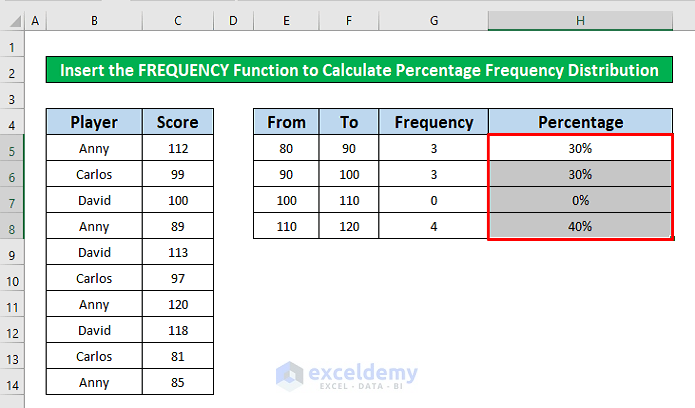
- Look at column H, you will be able to see the fraction value. Now, we’ll convert these fractions into percentages. To do that, from Home Tab, go to,
Home → Number → Percentage

- Finally, by clicking on the Percentage option, you will be able to convert fractions into percentages which have been given in the screenshot.
Read More: How to Make a Categorical Frequency Table in Excel
Things to Remember
👉 Frequency distributions can display the number of observations that fall into each range or the percentage of data that fall into each range.
👉 While calculating the percentage of the fractions, from your Home Tab, go to,
Home → Number → Percentage
Download Practice Workbook
Conclusion
I hope all of the suitable methods mentioned above to calculate percent frequency distribution will now provoke you to apply them in your Excel spreadsheets with more productivity. You are most welcome to feel free to comment if you have any questions or queries.
Related Articles
- How to Make an Ogive Graph in Excel
- How to Make a Contingency Table in Excel
- How to Do Cross Tabulation in Excel
<< Go Back to Frequency Distribution in Excel | Excel for Statistics | Learn Excel
Get FREE Advanced Excel Exercises with Solutions!
