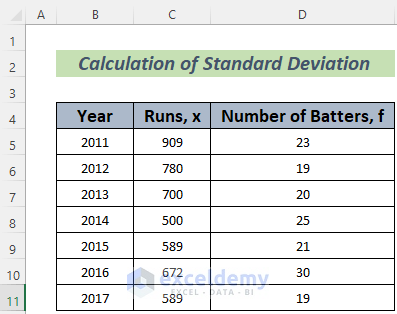
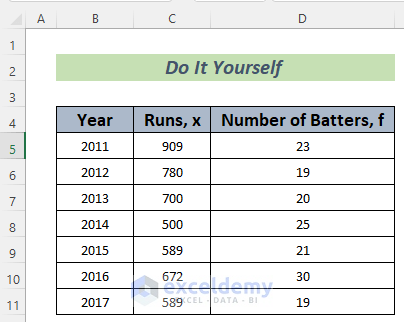
We have the batting statistics across Years. We’ll determine the deviation between years.
What Is Standard Deviation?
The term Standard Deviation is a measurement of the scattering of a set of values from their mean. If the Standard Deviation of a set of values is high, we can say that the data highly deviates from its mean or average, which implies that the values are independent. If the Standard Deviation is low, we can say that the data stays close to its mean and there is a greater possibility of them being related to each other. The mathematical formula for Standard Deviation is given below.
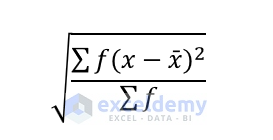
f = Frequency of the Data
x = Each Value of the Data
x̄ = Mean of the Data
How to Calculate the Standard Deviation of a Frequency Distribution in Excel: 2 Ways
Method 1 – Using a Mathematical Formula to Calculate the Standard Deviation of a Frequency Distribution
We’ll determine the Standard Deviation of the Runs that these batters scored using the mathematical formula. The Frequency of this data is the number of players that scored a certain amount of runs each year.
Steps:
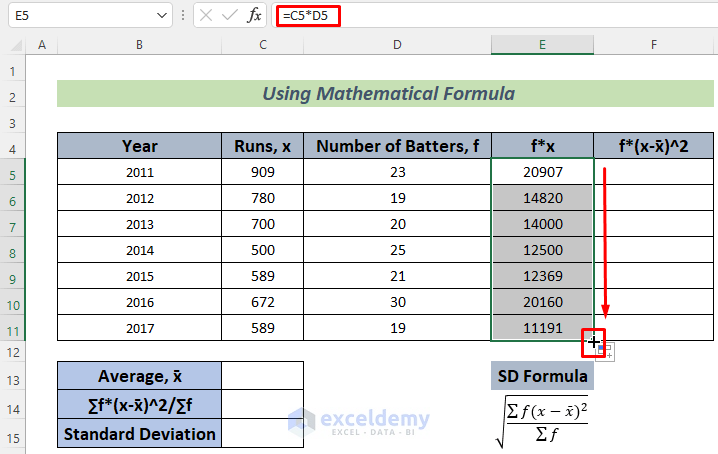
- Use the following formula in cell E5.
=C5*D5
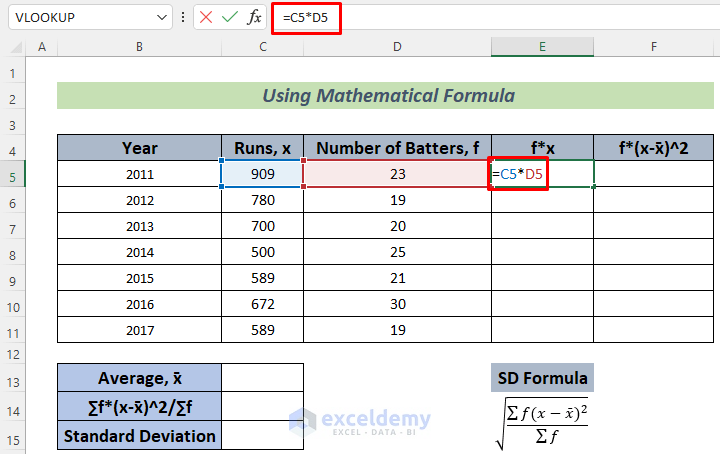
This formula will store the total runs scored by the batters in 2011.
- Hit the Enter button and you will see the total runs that these players scored together in 2011.
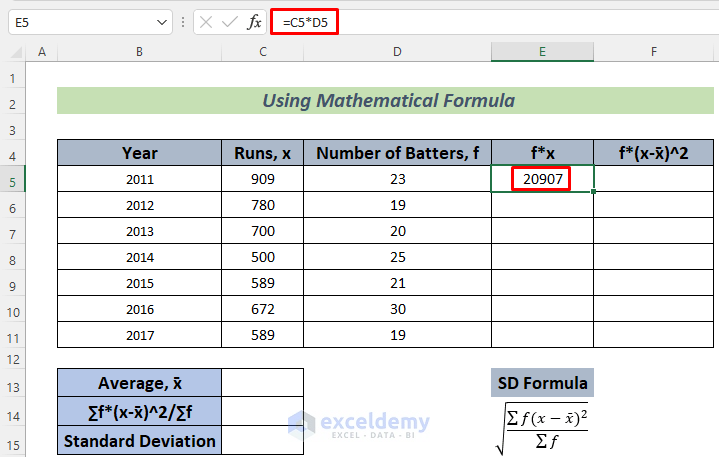
- Use the Fill Handle to AutoFill down.
- Use the formula below in cell C13 and press Enter.
=SUM(E5:E11)/SUM(D5:D11)
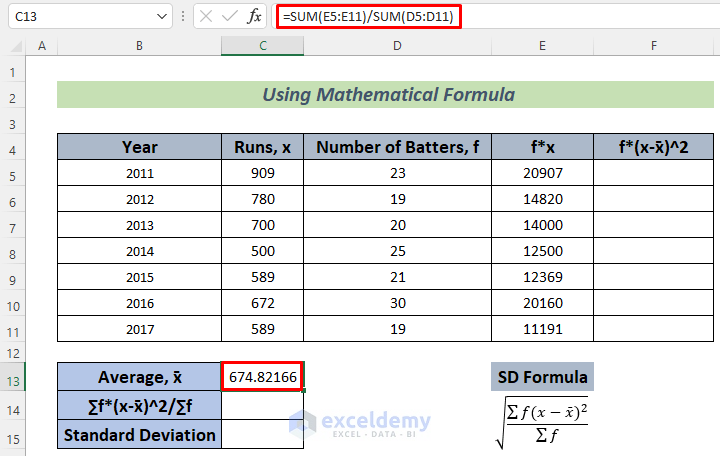
The formula will return the Average runs per year of a Batter with the help of the SUM function.
- Use the following formula in cell F5, press Enter, and use Fill Handle to AutoFill.
=D5*(C5-$C$13)^2
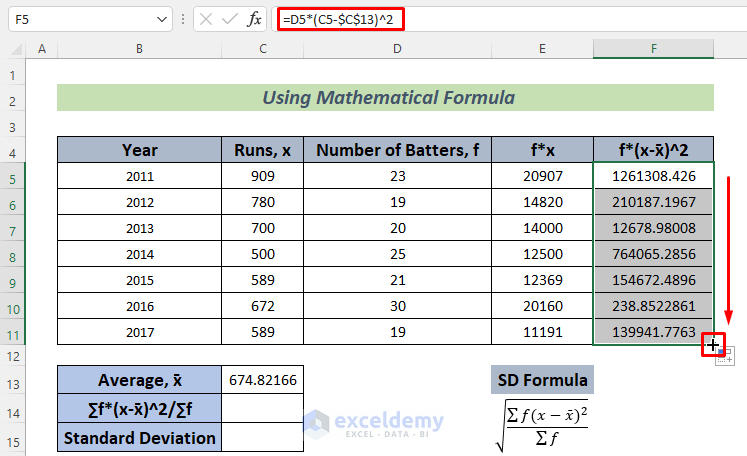
This formula will store the f*(x-x̄)^2 value for each year.
- Use the following formula in cell C14 and press Enter.
=SUM(F5:F11)/SUM(D5:D11)
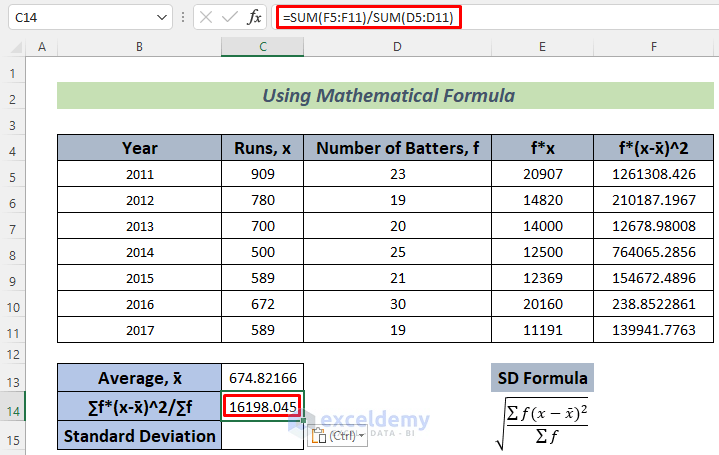
This will calculate the Variance of this data.
- Use the following formula in cell C15 and press Enter.
=SQRT(C14)
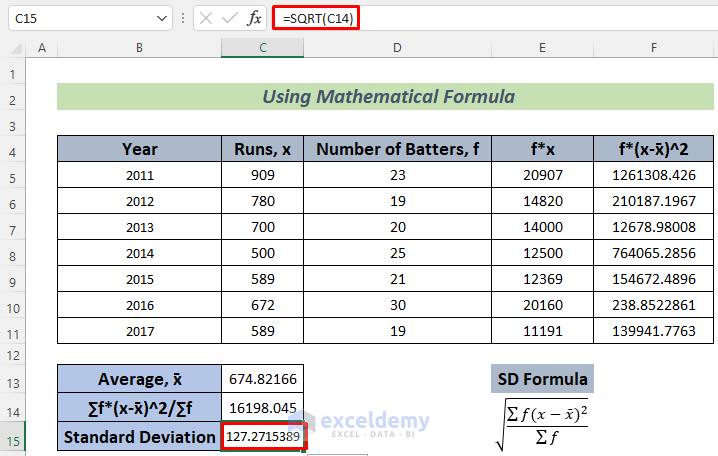
As Standard Deviation is the square root of Variance, we use the SQRT Function to determine the square root of the value in C14.
Read More: How to Calculate Population Standard Deviation in Excel
Method 2 – Applying the SUMPRODUCT Function to Calculate a Standard Deviation of a Frequency Distribution
Steps:
- Use the following formula in cell C13.
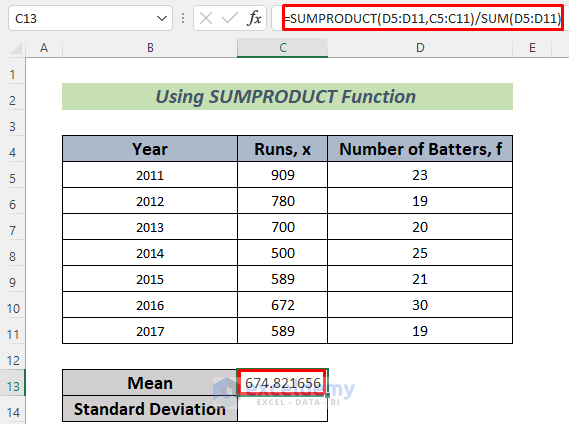
=SUMPRODUCT(D5:D11,C5:C11)/SUM(D5:D11)
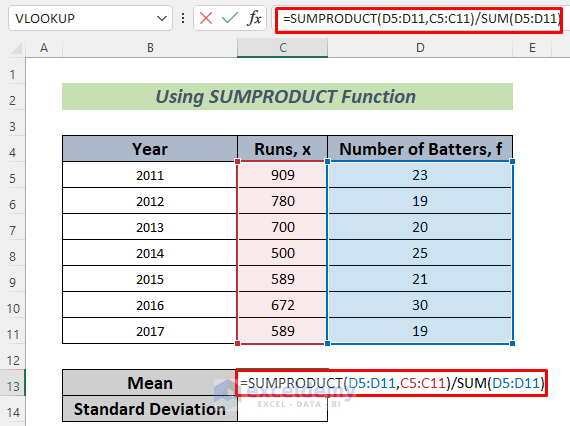
The SUMPRODUCT function will return the total runs over the 7 years. We want the average runs scored by each batter in a year, so we divided it by the total number of batters. We used the Excel SUM Function to input the number of total batters.
- Press Enter to see the result.
- Use the following formula in cell C14.
=SQRT(SUMPRODUCT((C5:C11-C13)^2,D5:D11)/SUM(D5:D11))
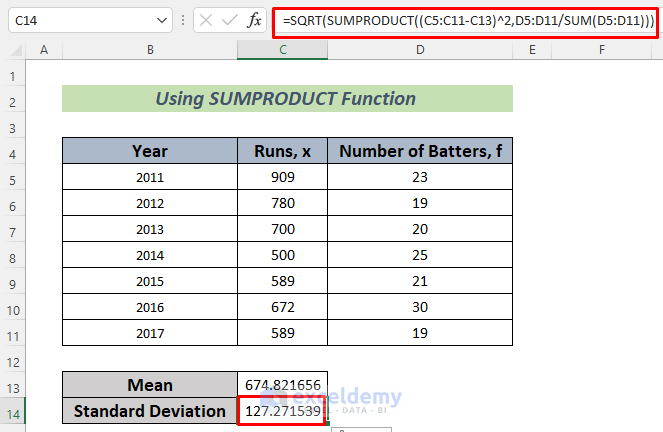
We used the SQRT Function to determine the square root of Variance and hence calculate the Standard Deviation
Formula Breakdown
- SUM(D5:D11) —-> returns the total number of batters
- Output: 157
- (C5:C11-C13)^2 —-> returns a range of values which are squares of the difference between the data (runs) and mean.
- SUMPRODUCT((C5:C11-C13)^2,D5:D11) —-> results in the summation of the products between the range (C5:C11-C13)^2 and D5:D11
- Output: 2543093.00636943
- SUMPRODUCT((C5:C11-C13)^2,D5:D11)/SUM(D5:D11) —-> becomes
- 2543093.00636943/157
- Output: 16198.0446265569
- SQRT(SUMPRODUCT((C5:C11-C13)^2,D5:D11)/SUM(D5:D11)) —-> turns into
- SQRT(16198.0446265569)
- Output: 127.271538949432
We get the Standard Deviation of our data.
Read More: How to Calculate Standard Deviation with IF Conditions in Excel
Practice Section
We’re giving you the dataset of this article so that you can make it on your own and practice these methods.
Download the Practice Workbook
Related Articles
- Calculate Percentile from Mean and Standard Deviation in Excel
- How to Calculate Standard Deviation of y Intercept in Excel
- How to Calculate Uncertainty in Excel
<< Go Back to Standard Deviation Formula in Excel | Excel for Statistics | Learn Excel
Get FREE Advanced Excel Exercises with Solutions!
