Standard Deviation Formula Excel
Nov 11, 2025
In statistical analysis, percentiles are valuable measures that help us understand the distribution and characteristics of data. Microsoft Excel ...
Jun 19, 2024
Method 1 - Calculate Standard Deviation with Single IF Condition
Steps:
Select the desired cell where we want to get the result as shown in ...
Jul 25, 2024
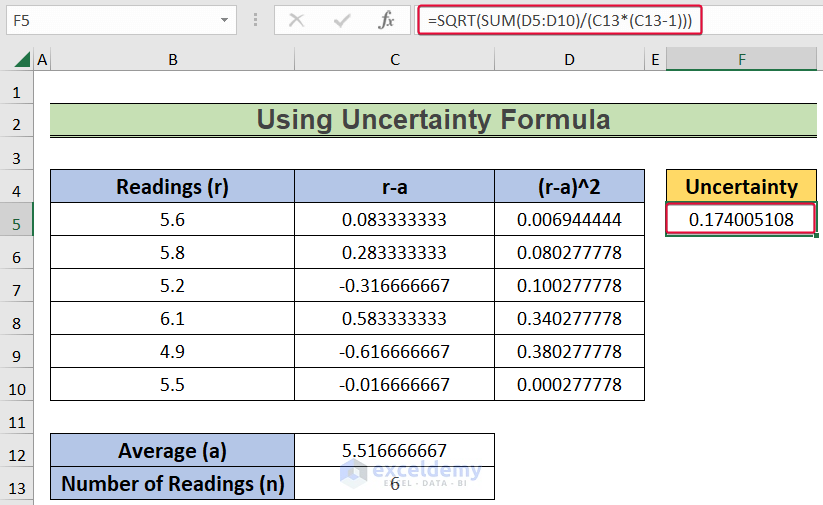
Method 1 - Using the Uncertainty Formula
We have a set of readings of a certain parameter. We are going to determine the uncertainty of the ...
Jun 25, 2024
Method 1 - Find y Intercept to Calculate Standard Deviation in Excel
Find the y-intercept of the given dataset. We can use various functions to find ...
Nov 11, 2025
In this article, we will learn to calculate population standard deviation in Excel. We can do it very quickly by following the methods discussed in ...
Jul 26, 2024
We have the batting statistics across Years. We'll determine the deviation between years.
What Is Standard Deviation?
The term Standard ...
Jul 31, 2024
What Is Mean Deviation?
Mean Deviation is a statistical measure of variability. It is calculated as the average of the absolute deviations of the ...