Method 1 – Using the Uncertainty Formula
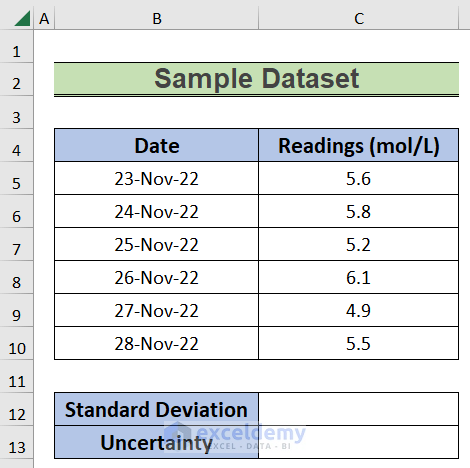
We have a set of readings of a certain parameter. We are going to determine the uncertainty of the readings.
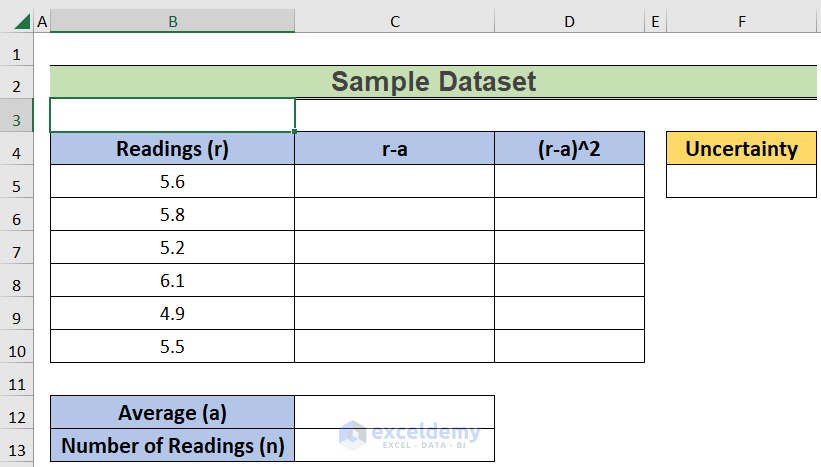
Steps:
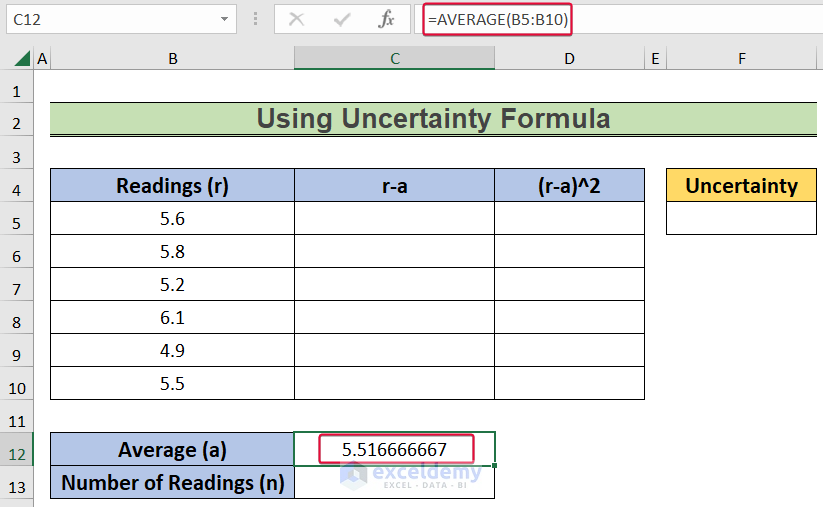
- Choose the C12 cell and enter:
=AVERAGE(B5:B10)- Hit Enter.
- We will get the average of the readings.
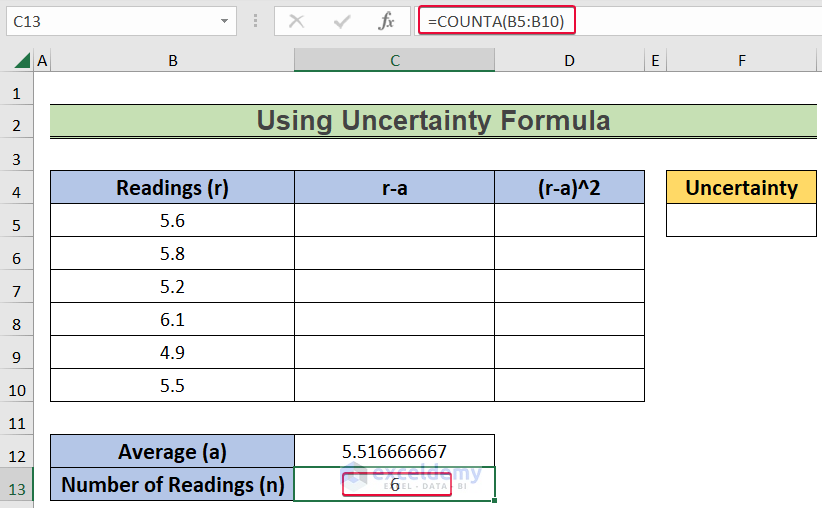
- Click on the C13 cell and insert:
=COUNTA(B5:B10)- Press Enter.
- We will get the number of readings.
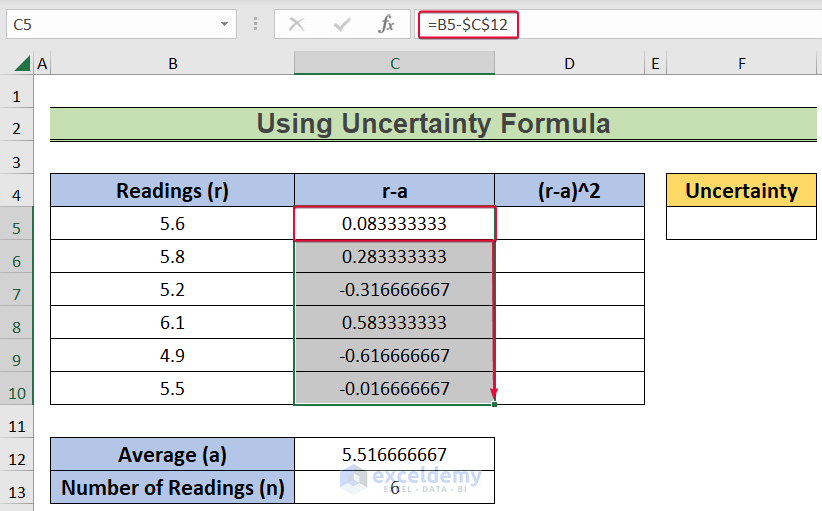
- Select the C5 cell and insert:
=B5-$C$12- Click on Enter.
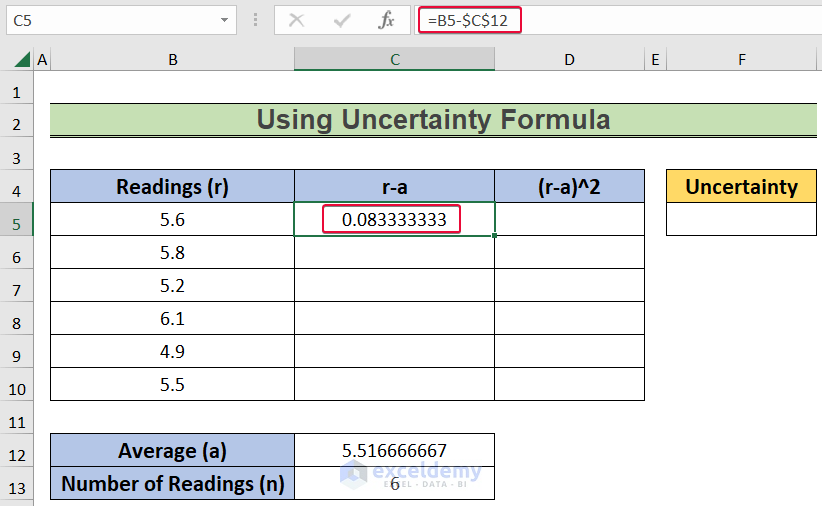
- Drag the fill handle down to Autofill.
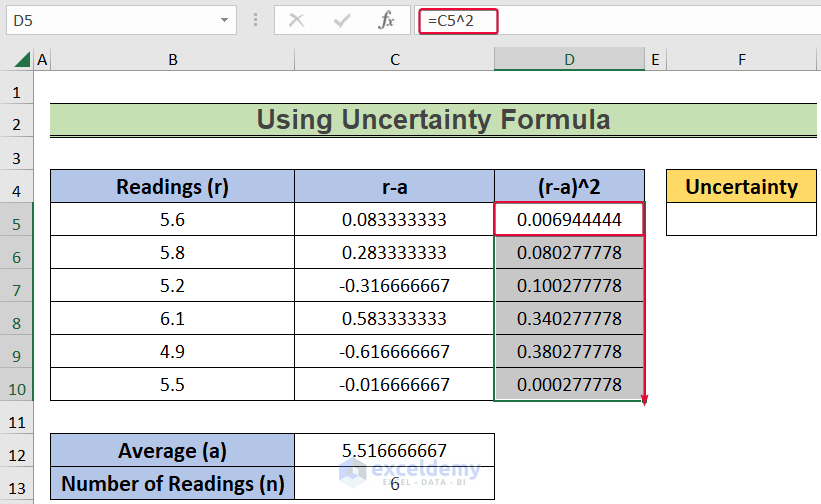
- Click on the D5 cell and insert:
=C5^2- Press the Enter button.
- We will get the square of the previously obtained value.

- Autofill down.
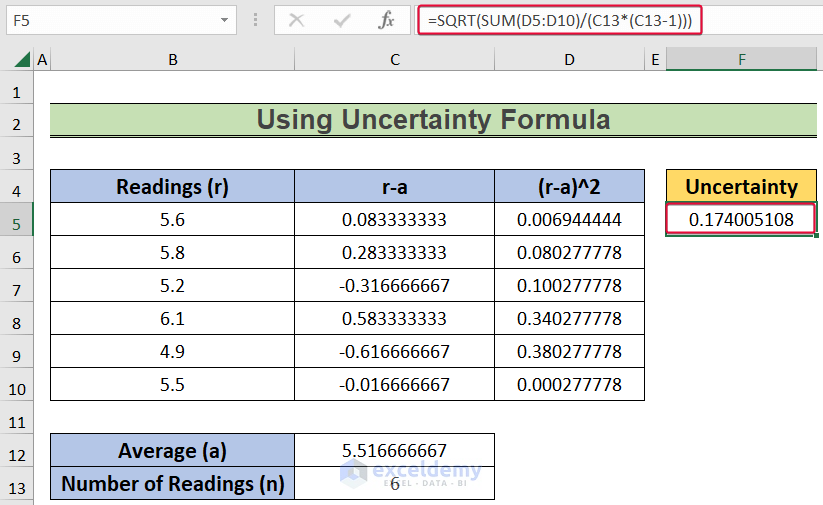
- Choose the F5 cell and enter the following formula:
=SQRT(SUM(D5:D10)/(C13*(C13-1)))- Press Enter.
- We will get the uncertainty value for the dataset.
Read More: How to Calculate Standard Deviation of y Intercept in Excel
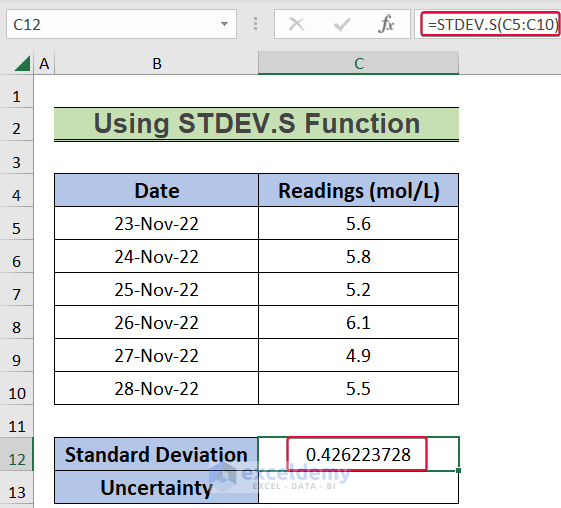
Method 2 – Using the STDEV.S Function
We will use the same dataset.
Steps:
- Choose the C12 cell and enter:
=STDEV.S(C5:C10)- Press Enter.
- We will get the Standard Deviation of the dataset.
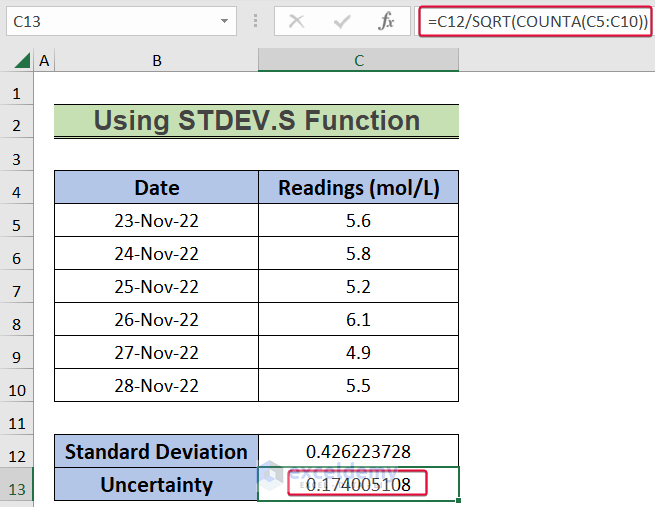
- Click on the C13 cell and insert”
=C12/SQRT(COUNTA(C5:C10))- Hit Enter.
- We will get the uncertainty of the dataset.
Read More: How to Calculate Population Standard Deviation in Excel
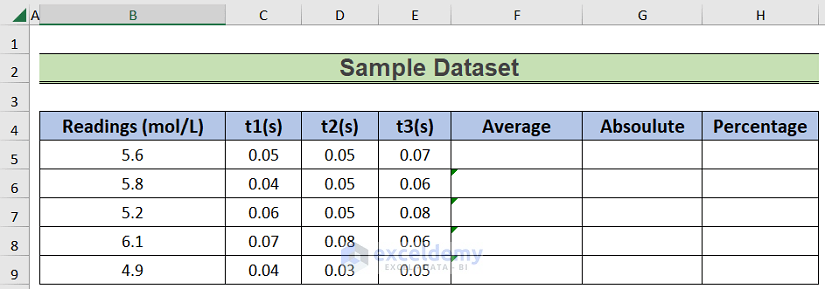
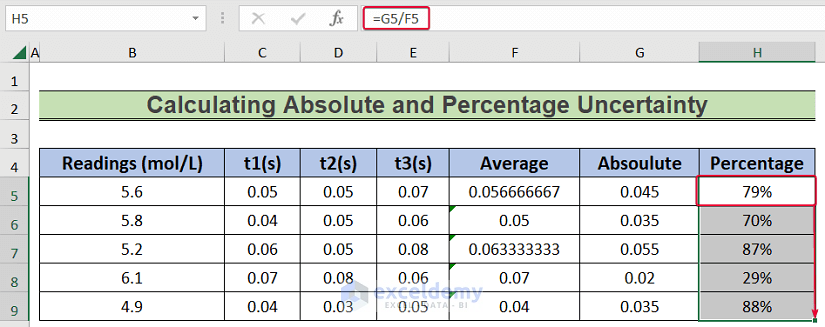
Method 3 – Calculating Absolute and Percentage Uncertainty
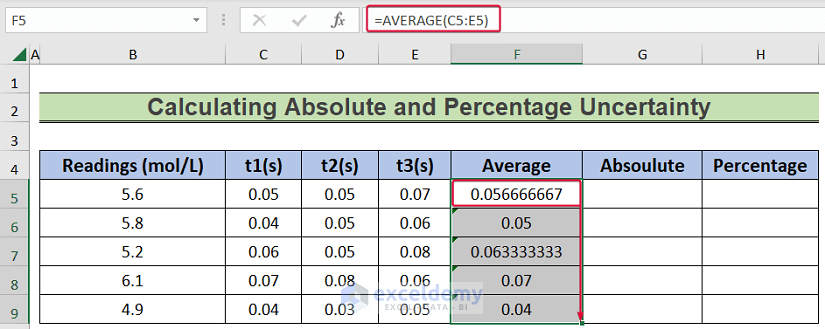
We have the readings of the concentration of a certain chemical. There are 5 readings, and each reading has been taken three times with each test time recorded. We will calculate the absolute and percentage uncertainty of the test times.
Steps:
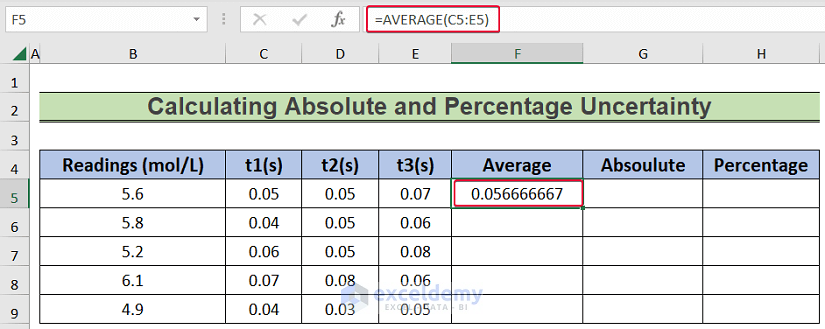
- Click on the F5 cell and insert the following:
=AVERAGE(C5:E5)- Press the Enter button.
- We will get the average of the 3 test times.
- Autofill the column.
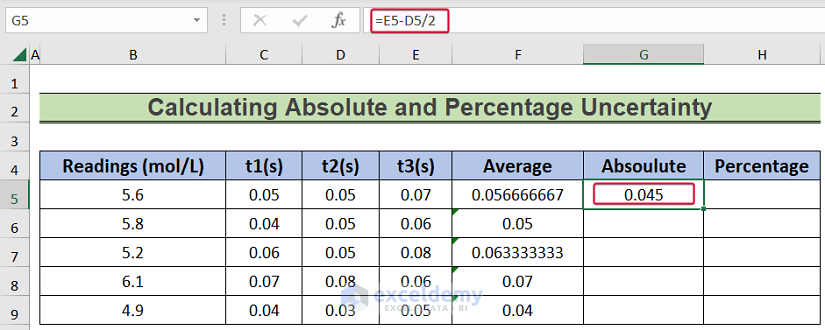
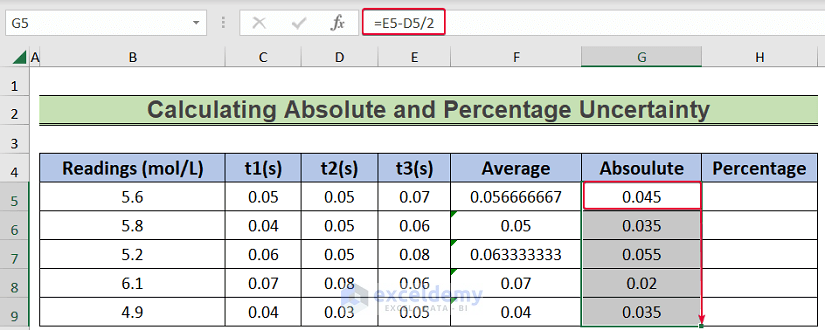
- Choose the G5 cell and insert:
=E5-D5/2- Hit the Enter button.
- We will get the absolute uncertainty of the test times.
- Autofill down.
- Select the H5 cell and enter the following formula:
=G5/F5- Press Enter.
- We will get the percentage uncertainty of the test times.
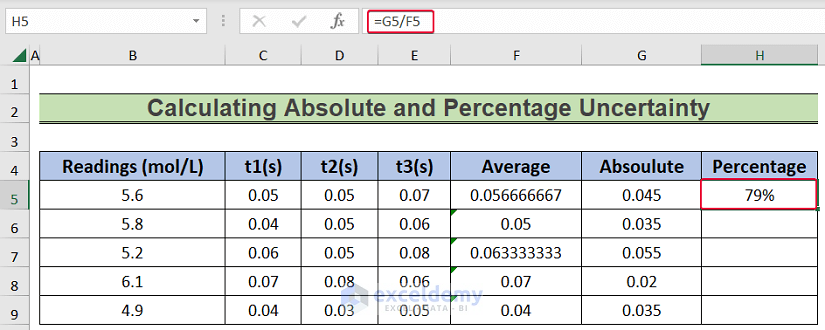
- Autofill down.
Read More: How to Calculate Standard Deviation with IF Conditions in Excel
Download the Practice Workbook
Related Articles
- How to Calculate Standard Deviation of a Frequency Distribution in Excel
- Calculate Percentile from Mean and Standard Deviation in Excel
- How to Calculate Mean and Standard Deviation in Excel
<< Go Back to Standard Deviation Formula in Excel | Excel for Statistics | Learn Excel
Get FREE Advanced Excel Exercises with Solutions!
