In statistical analysis, percentiles are valuable measures that help us understand the distribution and characteristics of data. Microsoft Excel provides some straightforward ways to calculate percentiles based on a dataset’s mean and standard deviation.
In this Excel tutorial, the methods to calculate percentiles in Excel have been explored. To calculate percentile from mean and standard deviation, this article presents the use of NORM.INV function of Excel. Additionally, to present another convenient way to the percentile calculation, this tutorial presents the PERCENTILE.INC and PERCENTILE.EXC functions that eliminate the need for prior calculation of mean and standard deviation.
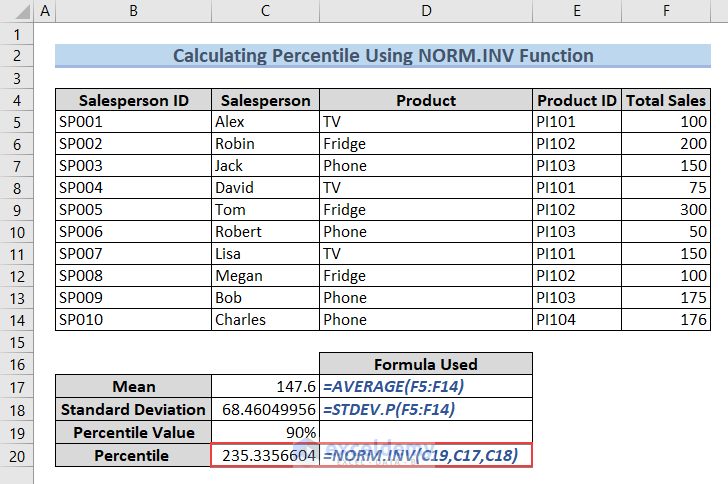
Assume, for example, the following sample data of sales. The dataset has some information on Salesperson ID, Salesperson, Product, Product ID, and Total Sales. The purpose of this tutorial is to calculate the percentile related to the Total Sales of this dataset.
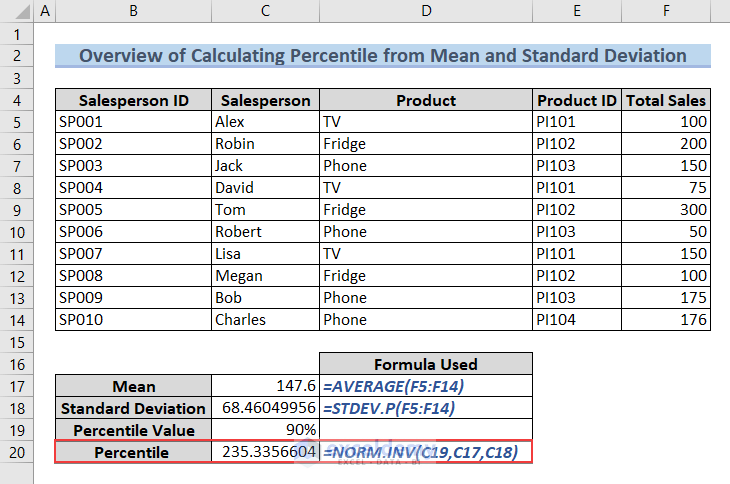
The highlighted cells of the above image show the percentile calculation in cell C20 from the mean (in cell C17) and the standard deviation (in cell C18) using NORM.INV function.
What are Percentile, Mean and Standard Deviation?
In the realm of statistics, several key measures illustrate the characteristics of a dataset, providing valuable insights for analysis and interpretation. Percentile, mean, and standard deviation are some vital key measures to offer a comprehensive view of the characteristics and distribution of a dataset in statistics.
Percentile: A percentile is a statistical measure that indicates the relative position of a particular value within a dataset. It represents the percentage of data points below or equal to a given value. For example, the 75th percentile is the value below which 75% of the data falls.
Mean (Average): The mean, often referred to as the average, is a measure of central tendency in a dataset. It is calculated by summing up all the values in a dataset and then dividing that sum by the total number of values.
Standard Deviation: Standard deviation is a measure of the amount of variation or dispersion in a set of values. It measures the degree to which individual data points deviate from the mean.
How to Calculate Percentile From Mean and Standard Deviation in Excel
This tutorial mainly focuses on the calculation of percentiles from mean and standard deviation in Excel. To calculate percentiles from mean and standard deviation, the NORM.INV function in Excel provides a straightforward approach.
Follow the steps below to calculate the percentile from the mean and standard deviation using NORM.INV function of Excel:
Step 1: Find Mean and Standard Deviation
Follow the steps below to calculate mean and standard deviation in Excel:
- Identify your range of data for mean and standard deviation calculation.
The range for mean and standard deviation calculation is F5:F14 in our sample data. - Select a blank cell (C17 here).
- Apply the formula:
=AVERAGE(F5:F14)
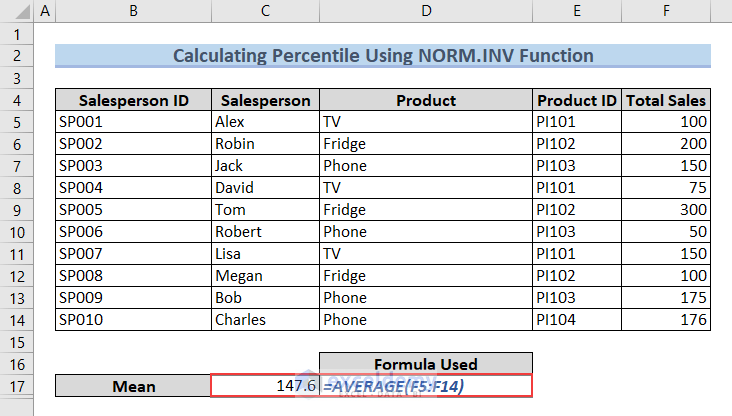 As a result, you will get the mean value of the total sales data.
 - Insert the formula in another blank cell:
=STDEV.P(F5:F14)
Here, the formula is inserted in cell C18.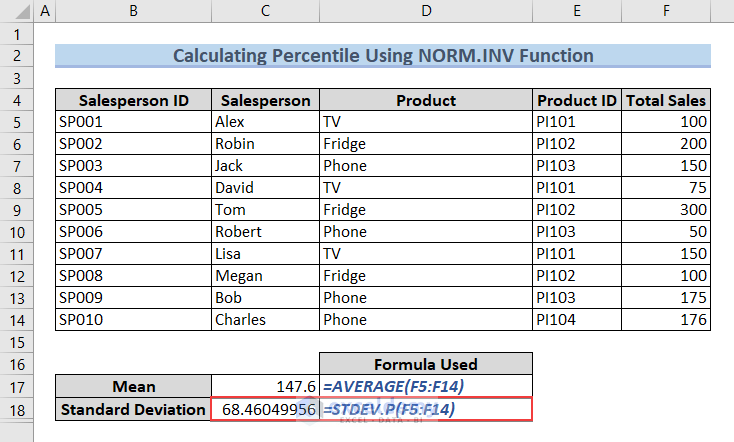 You will get the standard deviation of the total sales data.
Step 2: Calculate Percentile From Mean and Standard Deviation
Once the mean and standard deviation have been found, the subsequent step involves applying the NORM.INV function to compute the percentile value.
Follow the steps below to calculate percentile from mean and standard deviation:
- Identify your range of data for percentile calculation.
The range for percentile calculation is F5:F14 in our sample data. - Enter a percentile value in a blank cell (C19 here).
Say, 90% is our percentile value entered in cell C19.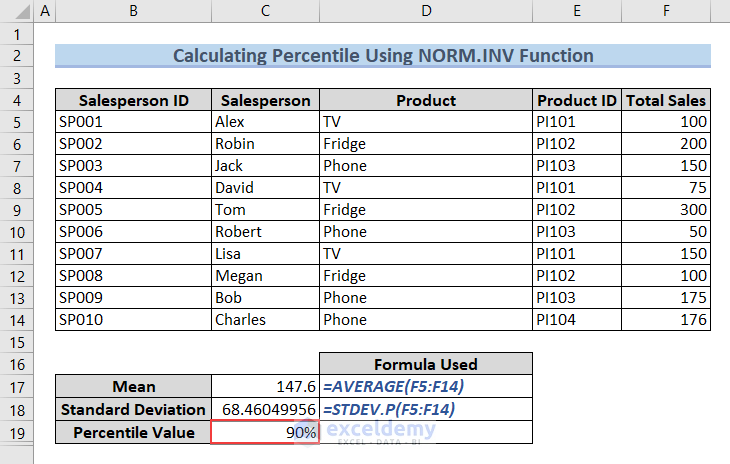
- Insert the formula in your desired result cell:
=NORM.INV(C19,C17,C18)
Modify this formula as per your cell references: =NORM.INV(percentile, mean, standard_dev)
Note: Remember to adjust cell references based on the address of your mean and standard deviation values.
The identified value, 235.3356604, in cell C20 is the result of percentile calculation. The result indicates that more than 90% of the sales values in our dataset are below this threshold.
How to Calculate Percentiles in Excel: A Simplified Approach
This Excel tutorial presents another convenient way to calculate percentiles in Excel with a direct and simplified method. This method eliminates the need for calculating mean and standard deviation, making the process of percentile calculation in Excel more accessible and efficient.
The PERCENTILE.INC or PERCENTILE.EXC functions offer simplicity in calculating percentile in Excel.
Follow these straightforward steps to calculate percentile using PERCENTILE.INC function of Excel:
- Identify your data range for percentile calculation.
The data range for percentile calculation is F5:F14 in our sample data. - Enter a percentile value in a blank cell.
Say, 0.9 is our percentile value entered in cell C17. - Insert the formula in a blank cell:
=PERCENTILE.INC(F5:F14,C17)
In cell C18, the formula is inserted.
 You will get the inclusive percentile of your sales data.
 - Or, if you need to calculate exclusive percentile, insert the formula:
=PERCENTILE.EXC(F5:F14,C17)
Replace F5:F14 with your data range and C17 with your percentile value.
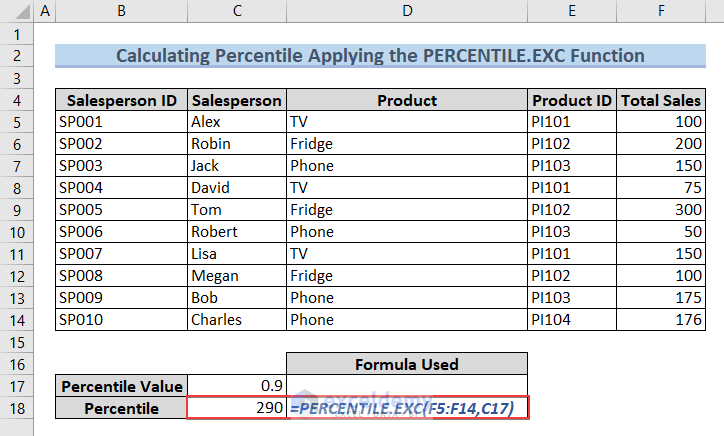
The identified value in cell C18, 290, is the result of our percentile calculation. The result indicates that more than 90% of the sales values in our dataset are below this threshold.
This straightforward process allows you to quickly calculate percentiles in Excel using the PERCENTILE.INC or PERCENTILE.EXC function, eliminating the need for calculating mean and standard deviation.
Download Practice Workbook
Download this practice sheet to exercise while you are reading this article.
Conclusion
This Excel guide has covered how to calculate percentiles in Excel using NORM.INV. These tools empower you to make informed decisions based on the nature of your dataset, whether opting for direct percentile calculations or integrating mean and standard deviation. While NORM.INV is essential when relying on mean and standard deviation, PERCENTILE.INC and PERCENTILE.EXC offers an alternative and easy route to percentile calculation. Feel free to experiment with these functions in your specific use cases and reach out to us in the comments for assistance. Happy analyzing!
Frequently Asked Questions (FAQs)
What is the Percentile Formula?
The percentile formula states that the percentile of a value from a given set of values is obtained by dividing the number of values less than the given value by the total number of values and multiplying the result by 100.
For example, if ‘x’ is a value from a given set of values, then the percentile of x is calculated by the formula below:
Are there any alternative methods for percentile calculation in Excel?
Yes, you can also explore Excel’s native PERCENTILE function or other statistical functions depending on your specific analysis requirements. For direct percentile calculations without mean and standard deviation, employ functions like PERCENTILE.INC or PERCENTILE.EXC based on your preference for inclusive or exclusive calculations.
How do I choose between PERCENTILE.INC and PERCENTILE.EXC?
Use PERCENTILE.INC if you want to include the specified percentile in the calculation and PERCENTILE.EXC if you prefer to exclude it, interpolating between adjacent data points if needed.
<< Go Back to Standard Deviation Formula Excel | Excel for Statistics | Learn Excel
Get FREE Advanced Excel Exercises with Solutions!
