
Power BI isn’t just a tool for dashboards and visual analytics. It can also work as a back-end engine for Excel reports. Centralizing data models and transformations in Power BI allows business users to access consistent, secure, and up-to-date data directly in Excel, without building data logic in every spreadsheet.
In this tutorial, we will show how to use Power BI as back-end engine for Excel Reports.
Why Use Power BI as a Back-End for Excel?
- Centralized logic: Keep all calculations, relationships, and business rules in one place.
- Data security: Enforce row-level security, permissions, and data governance centrally.
- Live, consistent data: Reports always pull from the latest version of the dataset.
- Reduced errors: Users connect to the same model, not copying/pasting data.
- Self-service analytics: Business users can analyze PivotTables, formulas, and charts using the familiar Excel interface.
Step 1: Build Your Data Model in Power BI Desktop
1.1. Import Your Data
- Open Power BI Desktop.
- Go to Home tab >> select Excel workbook.
- Browse and select your Excel file.
- In the Navigator window, select the tables/sheets you want to import.
- Click Load to load data directly.

1.2. Clean and Transform
- Click Transform Data to open Power Query Editor.
- Make necessary data transformations.
- Use Power Query Editor to clean, merge, filter, and transform raw data as needed.
- Click Close & Apply.

1.3. Create Relationship
- Go to Model View.
- Power BI automatically detects and creates relationships.
- Define relationships between tables (e.g., Sales, Customers, Products and Regions).
- Drag and drop fields to create relationships (e.g., CustomerID in Orders → CustomerID in Customers).
- Ensure the relationship is one-to-many, and the cross filter is set to both.

1.4. Add Measures/Calculations
Create business logic using DAX (Data Analysis Expressions).
- Go to Modeling >> select New measure or New column.
- Create a profit column:
Profit = Sales[NetAmount] - Sales[UnitCost]

- Create a profit margin measure:
Profit Margin % = DIVIDE(SUM(Sales[Profit]), SUM(Sales[NetAmount]), 0)

- Create an average order value measure:
Average Order Value = SUM(Sales[SalesAmount])/ DISTINCTCOUNT(Sales[OrderID])

Add these measures to your report.
1.5. Test the Model:
Use visuals to check calculations, but you don’t need to build a full dashboard unless you want to.
- Go to the Report view.
- From the Visualization pane >> select different Visuals to build a report.

Step 2: Publish the Data Model to Power BI Service
- Go to the File tab >> select Save and give your file a name (e.g., Sales_Report.pbix).
- Sign in to Power BI Service in Power BI Desktop.
- Go to the Home tab >> select Publish.
- Choose your workspace.
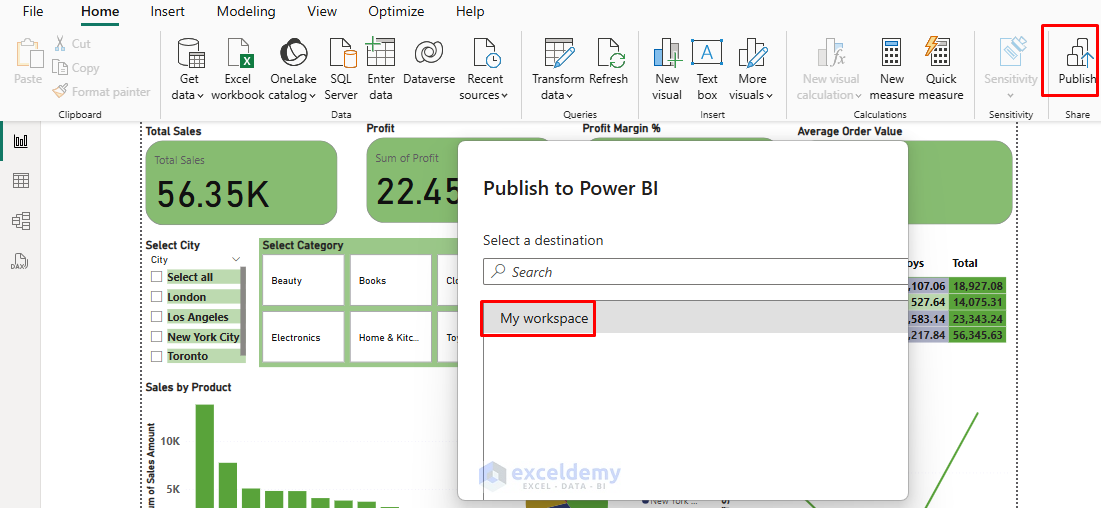
- The dataset is now hosted in the Power BI cloud and ready for connections.
Step 3: Connect Excel to the Power BI Dataset
There are two main approaches to connect Excel to a Power BI dataset.
3.1. From Power BI Service (Analyze in Excel)
- Go to Power BI Service and navigate to your workspace/dataset.
- Select “Sales Report” Semantic model.
- Hover your mouse over the desired Semantic model.
- Click on the three dots (“…”) that appear at the end of that row.
- In the dropdown, click Analyze in Excel.

- Download the ODC (Office Data Connection) file and open it in Excel.
- If your account is connected to Onedrive, then it will save the Excel file in OneDrive.

- Either use Excel online, or you can open the Desktop view.

- You get the same live, connected experience.

3.2. From Excel (Get Data from Power BI)
- Open Excel (must be signed into the same Microsoft 365 account with Power BI access).
- Go to the Data tab >> select Get Data >> select From Power Platform >> select From Power BI (Microsoft).
- Choose the workspace and dataset you just published.
- Excel opens a PivotTable connected live to the Power BI dataset.
- All tables and fields from your model are available in the PivotTable field list.
- You can build PivotTables, PivotCharts, and even use Excel formulas with the data.
Note:
- Any row-level security or permissions applied in Power BI are enforced in Excel.
- The Excel file doesn’t store the data, just the connection, so it’s always up to date.
Step 4: Build Your Excel Report
- Build PivotTables and PivotCharts from the Power BI model.
- Format and style your reports as usual.
- Use Slicers, Timelines, and formulas (like GETPIVOTDATA).
- Share the Excel file: all users will see the latest data from Power BI (if they have permission).

Refresh:
- When you update the model (new columns, new measures, data refresh schedules) in Power BI, all connected Excel reports use the latest data instantly.
- Data refresh, security, and governance are managed in the Power BI Service.
Best Practices & Tips
- Organize fields with Display Folders in Power BI for cleaner PivotTables.
- Hide unnecessary columns in Power BI to simplify the field list for Excel users.
- Use meaningful measure names, which become your analysis fields in Excel.
- Educate users that the data is live, and there is no need to copy/paste data for updates.
Troubleshooting
- Cannot see the dataset in Excel?
- Ensure you have access to the Power BI workspace and are signed in with the correct account.
- Connection issues?
- Sometimes corporate networks block live connections. You can consult IT if needed.
- “Analyze in Excel” greyed out?
- Only works for published datasets, not for reports in “My Workspace”.
Conclusion
Using Power BI as a back-end engine for Excel supercharges your reporting workflow. It combines the best of both worlds, powerful, centralized data management and the flexibility of Excel for ad-hoc analysis and custom reporting. You get the flexibility of Excel with the data strength and governance of Power BI. It is ideal for organizations scaling up from spreadsheet chaos to structured, governed, and dynamic analytics.
Get FREE Advanced Excel Exercises with Solutions!
