


Power BI usually works in two common data connection modes: Import and DirectQuery. Import mode loads a copy of the data into Power BI’s in-memory engine, which makes reports fast but requires refreshes. DirectQuery keeps the data in the source and sends queries back to that source when visuals load, which is useful when the data is very large or needs to stay close to real time. But what if your project requires both? That’s exactly what Composite Models are designed for. They allow you to combine Import and DirectQuery tables in the same Power BI semantic model, giving you the speed of imported data alongside the freshness of live data.
In this tutorial, we will show how you can use composite models in Power BI to blend import and DirectQuery data. This hybrid approach is ideal for large-scale datasets and real-time requirements.
What Is a Composite Model?
A composite model allows you to combine different storage modes within a single Power BI semantic model. For example, you can keep a large transaction table in DirectQuery mode while importing smaller supporting tables such as targets, budgets, product categories, or custom mapping tables.
In a composite model, storage mode is set per table, not per report. When you add a table to your model, Power BI asks (or infers) whether that table should be:
- Import: Data is copied into Power BI’s in-memory engine (VertiPaq) at refresh time.
- DirectQuery: No data is copied; every visual that touches this table generates a live query sent to the source.
- Dual: A special mode available only in composite models, where the table can behave as either Import or DirectQuery depending on the context of the query. Power BI decides at query time for more efficient execution.
The model becomes composite because it contains tables with more than one storage mode. A composite model can combine multiple DirectQuery sources or combine DirectQuery data with imported data.
Why Use Composite Models?
Use a composite model when you need both performance and freshness. It is useful when your main fact table is too large to import, but you still want to enrich it with smaller imported business tables.
- Performance + Freshness: Import small, frequently used tables (e.g. dimensions) for fast queries while keeping large fact tables in DirectQuery for real-time data.
- Data Integration: Blend enterprise warehouse data (DirectQuery) with local spreadsheets, departmental databases, or other sources.
- Scalability: Handle massive datasets (billions of rows) without importing everything.
- Flexibility: Extend existing semantic models or combine multiple DirectQuery sources.
However, composite models can also become slower or harder to maintain if they are not designed carefully. It is recommended to evaluate simpler model designs first, because composite models can introduce performance issues or unexpected calculation behavior in some situations.
Building a Composite Model in Power BI
Step 1: Connect to the DirectQuery Source
- Open Power BI Desktop
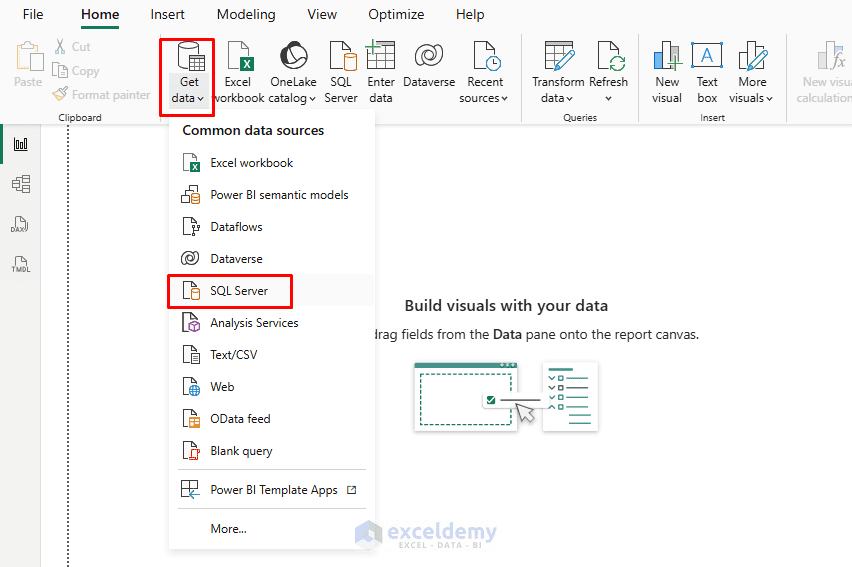
- Go to Home tab >> select Get Data >> select SQL Server
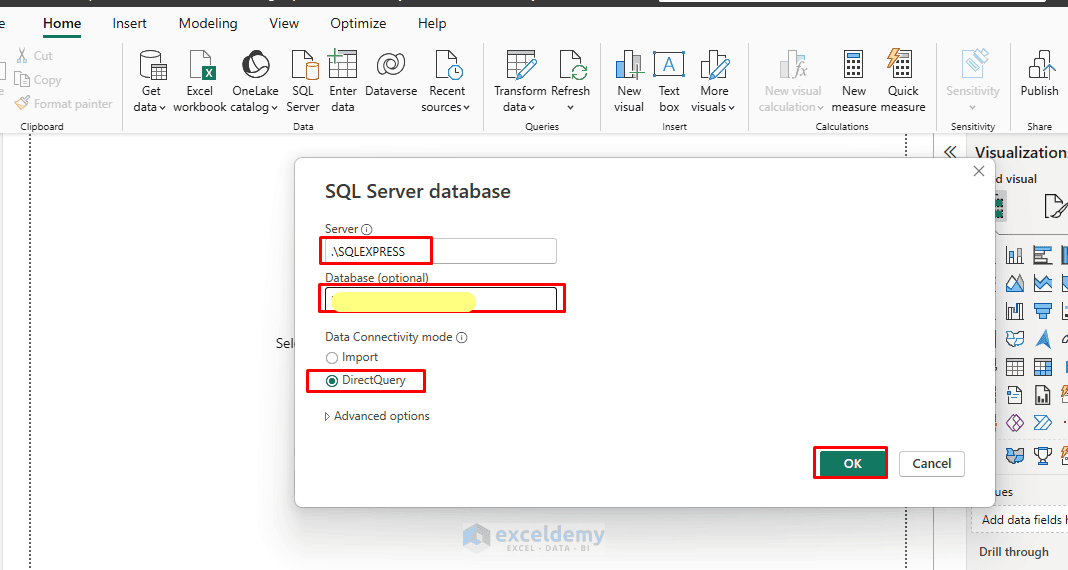
- Enter your Server and Database name
- Choose Data Connectivity mode: DirectQuery
- Click OK
- Then select your main sales tables >> click Load
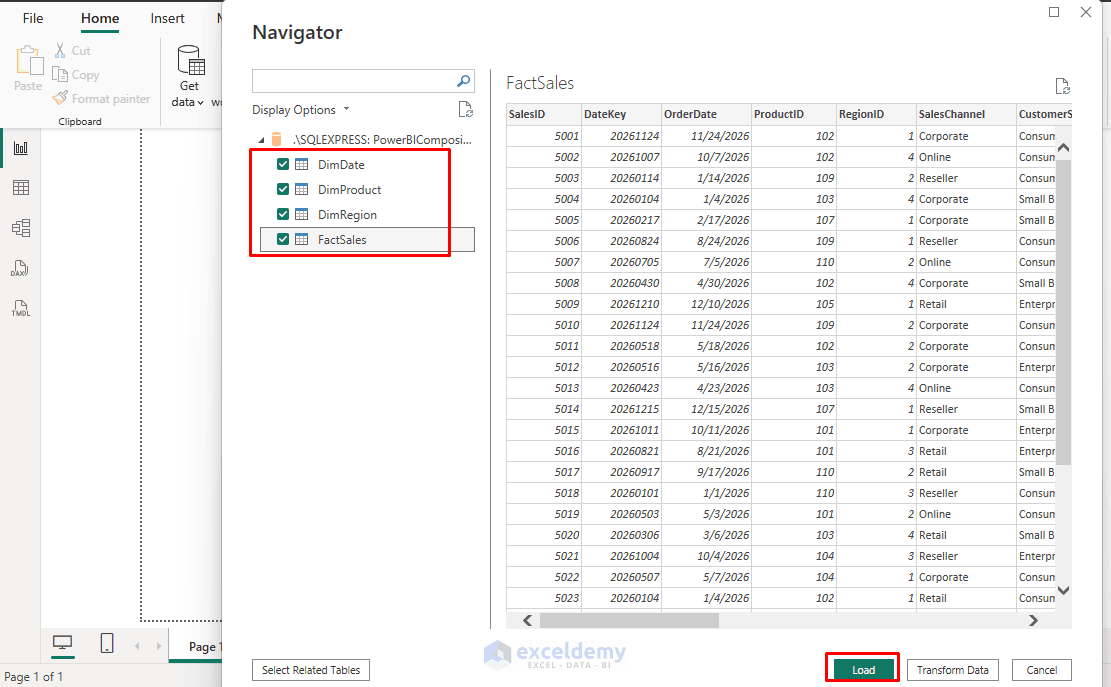
Your large sales transaction table is now connected using DirectQuery. Power BI will not import all sales rows into the model. Instead, it will query the source database when report visuals need data.
Step 2: Import the Excel Target Table
- Now, add the small Excel target file
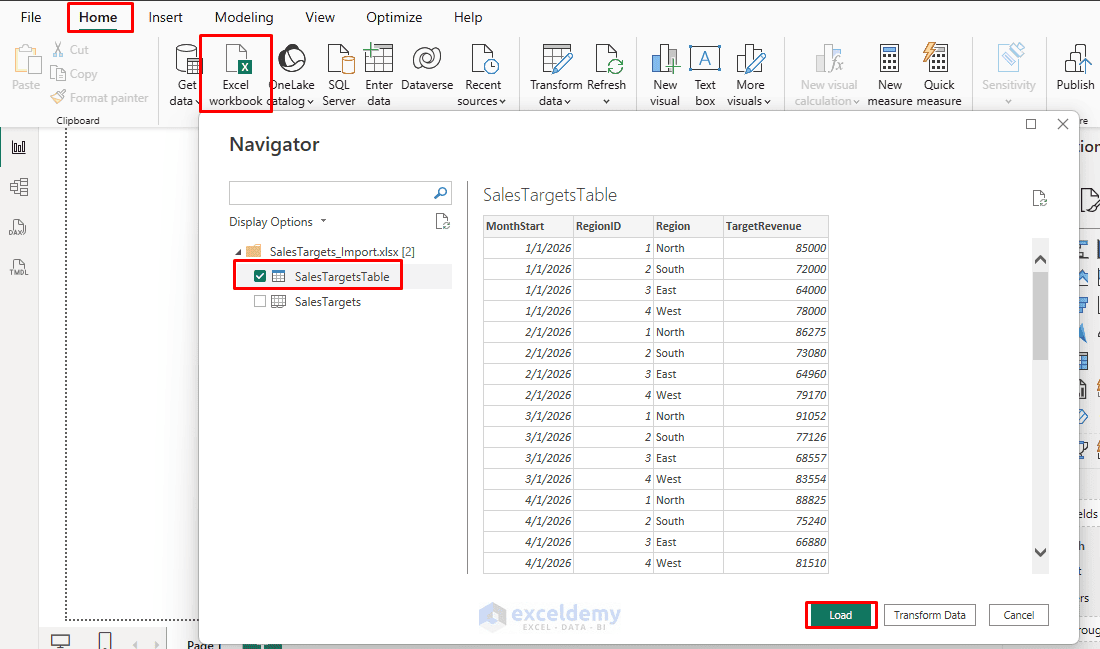
- Go to the Home tab >> select Get Data >> select Excel workbook
- Select your file, for example: SalesTargets.xlsx
- Select the target table >> click Load
- At this point, Power BI Desktop will show a notification: “Potential security risk of adding multiple data sources”
- This is your confirmation that you have officially created a composite model
- Click OK
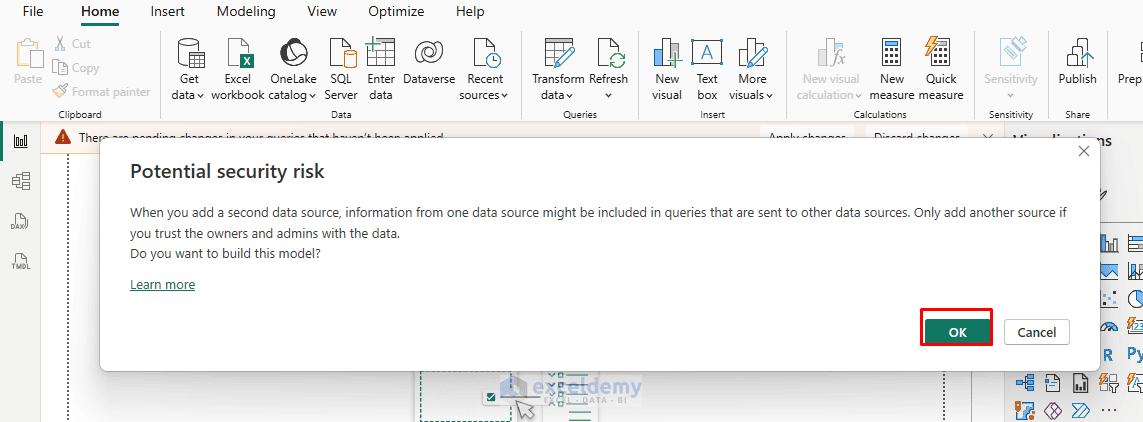
Power BI imports this table into the model. Since the target file is small and does not need to be updated every second, import mode is the right choice.
Step 3: Check the Storage Mode of Each Table
- Go to Model view
- Select a table >> open the Properties pane
- Under Advanced >> check Storage mode
Set the storage modes as follows:
| Table | Storage Mode |
| FactSales | DirectQuery |
| DimDate | Dual |
| DimProduct | Dual |
| DimRegion | Dual |
| SalesTargets | Import |
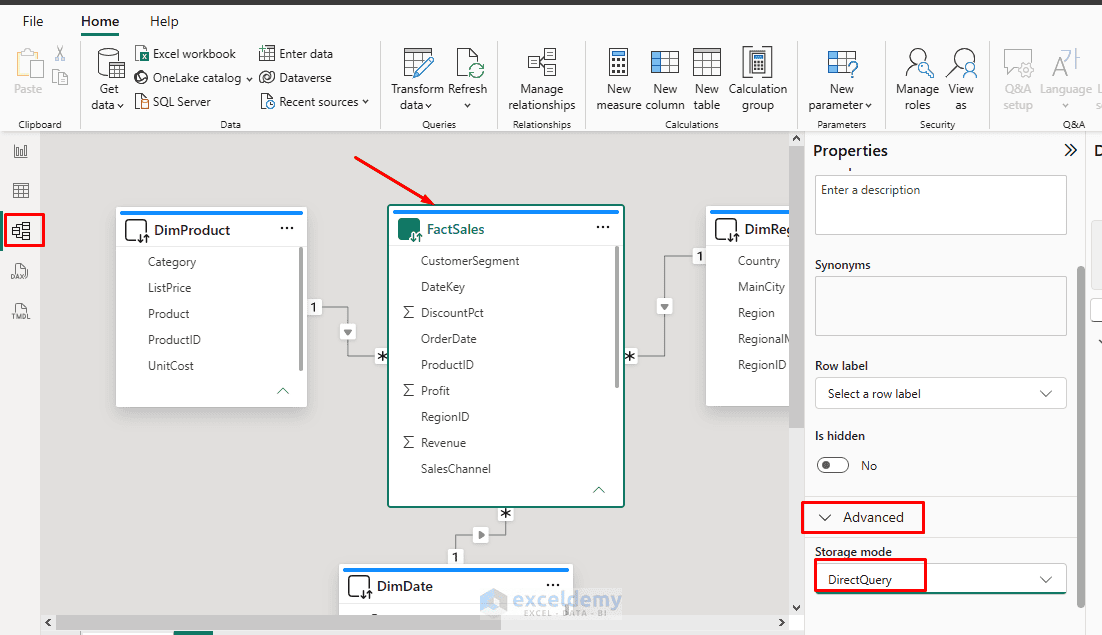
If your dimension tables came from the same DirectQuery source as FactSales, Power BI may allow you to set them to Dual. Dual tables can help because they can use cached data for some queries and DirectQuery behavior for others.
Step 4: Create Relationships
- Now, create the relationships between the tables
- Power BI will automatically validate the relationships of DirectQuery tables
- Use the following structure to create many-to-one relationships:
- Drag FactSales[DateKey] to DimDate[DateKey]
- Drag FactSales[ProductID] to DimProduct[ProductID]
- Drag FactSales[RegionID] to DimRegion[RegionID]
- Drag Sales Target[MonthStart] to DimDate[Date]
- Drag Sales Target[RegionID] to DimRegion[RegionID]
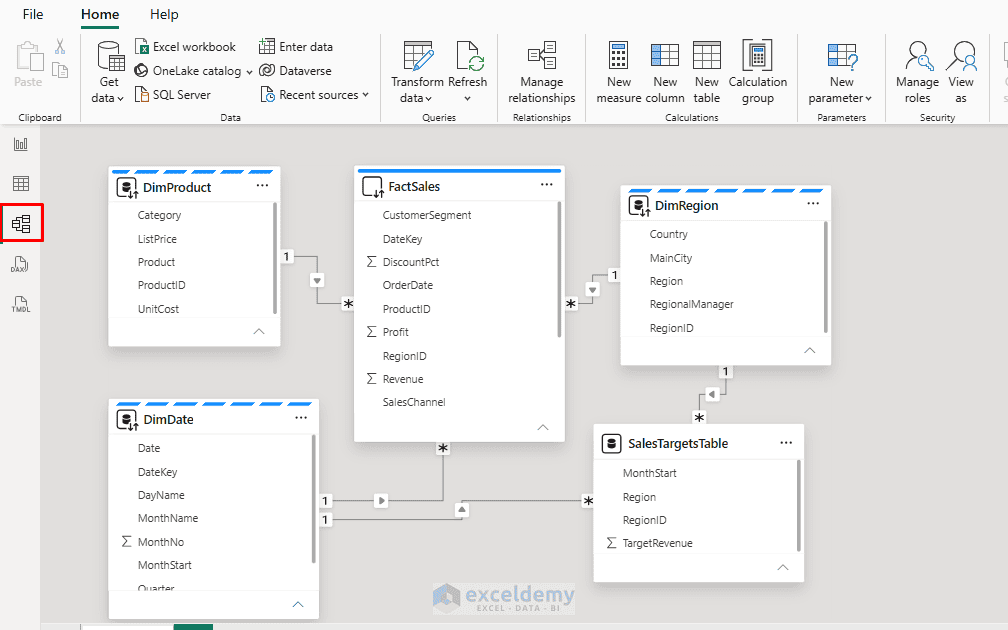
In composite models, relationships can exist within one source group or across source groups. Imported data, DirectQuery sources, and the VertiPaq cache can act as different source groups, so cross-source relationships require more care.
For best results, keep relationships simple:
- Use one-to-many relationships where possible
- Avoid unnecessary many-to-many relationships
- Use single-direction filtering unless you clearly need both directions
- Keep dimension keys clean and unique
Step 5: Create Basic Measures
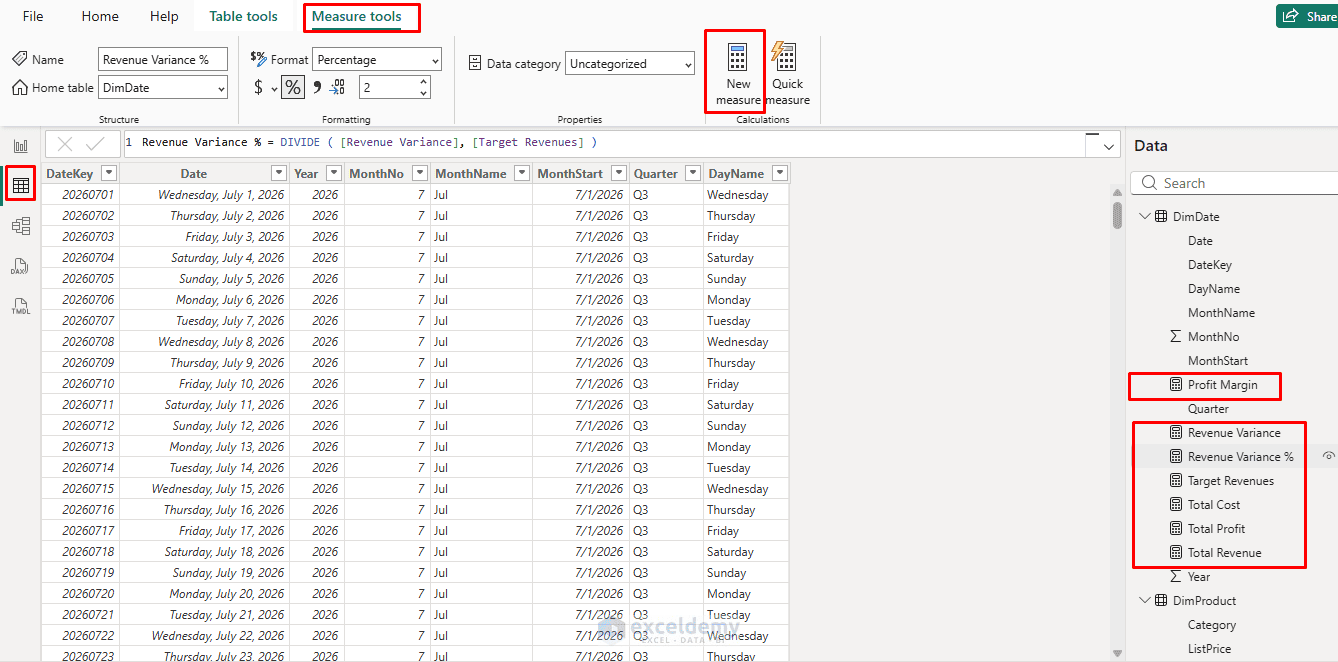
- Go to Table view >> click New measure
- Create these measures:
Total Revenue = SUM ( FactSales[Revenue] )
Total Cost = SUM ( FactSales[TotalCost] )
Total Profit = [Total Revenue] - [Total Cost]
Profit Margin = DIVIDE ( [Total Profit], [Total Revenue] )
Target Revenues = SUM (SalesTargetsTable[TargetRevenue])
Revenue Variance = [Total Revenue] - [Target Revenues]
Revenue Variance % = DIVIDE ( [Revenue Variance], [Target Revenues] )
These measures combine live DirectQuery sales data with imported Excel target data.
Step 6: Build the Report Visuals
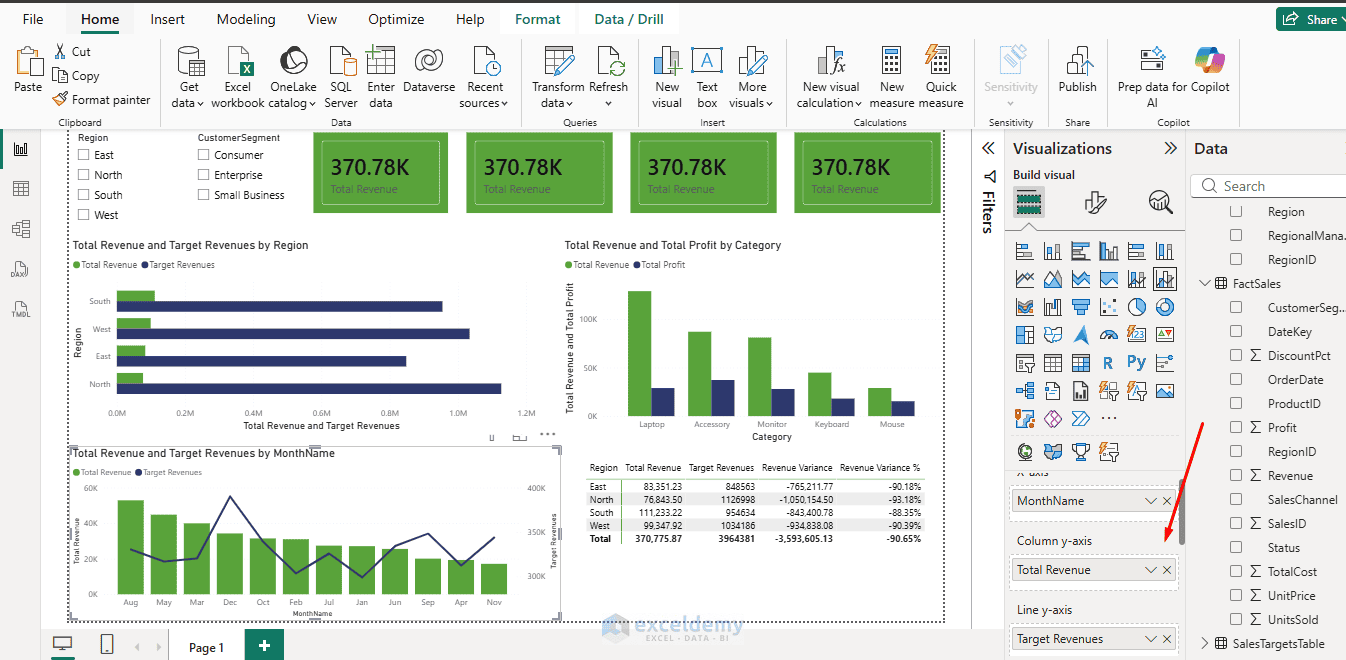
Create the following visuals blending both imported and DirectQuery data.
- Line and clustered column chart: Monthly Revenue vs. Target
- X-axis: DimDate[Month]
- Column y-axis: Total Revenue
- Line y-axis: Target Revenues
This visual compares live sales revenue against imported monthly targets.
- Use a Clustered bar chart: Revenue by Region
- Y-axis: DimRegion[Region]
- X-axis: Total Revenue, Target Revenues
This helps compare actual revenue and target revenue by region.
- Use a Table visual: Variance Table
- Add these fields:
- DimRegion[Region]
- Total Revenue
- Target Revenues
- Revenue Variance
- Revenue Variance %
Format Revenue Variance % as a percentage.
- Use a Stacked column chart: Product Category Performance
- X-axis: DimProduct[Category]
- Y-axis: Total Revenue, Total Profit
This shows which product categories are generating the most revenue and profit.
- Add Cards to show KPIs and Slicers to filter
Step 7: Test the Model
After creating the visuals, test the report carefully.
Check these points:
- Filters: Region, date, and product filters should affect the correct visuals
- Totals: Total Revenue should match the database result
- Target comparison: Target Revenue should match the Excel target file
- Performance: Visuals should load in a reasonable time
- Relationships: No duplicate or incorrect totals should appear
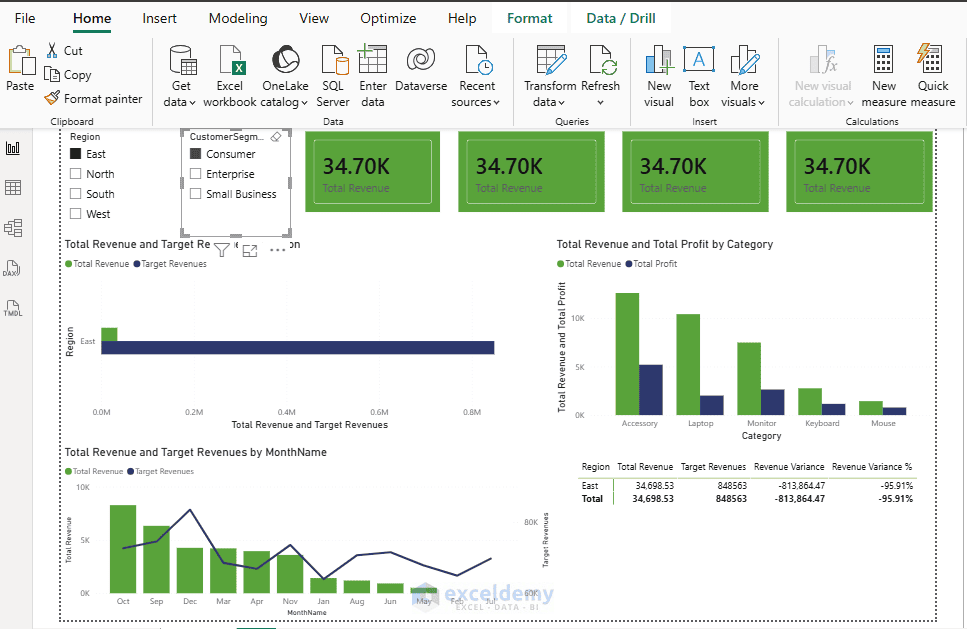
If numbers look too high, you may have a relationship problem. Common causes include duplicate keys in dimension tables, many-to-many relationships, or target data that does not match the same grain as actual sales data.
Enhancing Performance with Aggregations
User-defined aggregations are a game-changer in composite models:
- Create Import-mode aggregation tables at higher grains (e.g. monthly summaries of daily facts)
- Map them to the detail tables in the Manage aggregations dialog
- Rule of thumb: the aggregation table should be roughly 10x smaller than the detail table
Common Mistakes to Avoid
- Using DirectQuery for Everything: DirectQuery is useful, but it is not always faster. If a table is small and does not change frequently, import mode is usually better. Use DirectQuery for very large tables and frequently changing tables.
- Importing a Huge Fact Table Unnecessarily: If your fact table has millions or billions of rows and changes often, importing it may increase refresh time and file size. In that case, DirectQuery may be more practical.
- Creating Complex Relationships: Composite models can become slow when relationships are complex. Avoid unnecessary many-to-many relationships and bidirectional filters.
- Writing Too Many Calculated Columns on DirectQuery Tables: DirectQuery tables have more restrictions than imported tables. Some DirectQuery limitations still apply in composite models, and calculated columns on DirectQuery tables can only refer to columns from the same table. Use measures instead of calculated columns whenever possible.
- Ignoring Source Database Performance: In DirectQuery mode, Power BI sends queries to the source. If the source database is slow, your report will also be slow.
Conclusion
Composite models in Power BI offer a powerful solution when one storage mode is not enough. By blending Import and DirectQuery data, you can build reports that combine fast cached tables with large or frequently updated live data. The key is to choose the right storage mode for each table: use DirectQuery for large and frequently changing data, Import for small supporting tables, and Dual for shared dimensions when appropriate. If you design the relationships carefully and keep the model simple, composite models can give you a powerful balance of speed, flexibility, and near-real-time reporting.
Get FREE Advanced Excel Exercises with Solutions!

