What Is Multiple Regression?
When the number of independent variables is two or more while doing linear regression, it is called multiple linear regression analysis. The equation for calculating multiple regression analysis is as follows.
y=b+b1X1+b2X2+....bnXn
Where
Y is the dependent variable
b is the intercept
X1 and X2 are the independent variables
b1 and b2 are coefficients of the corresponding independent variables.
How Can You Do Multiple Regressions in Excel
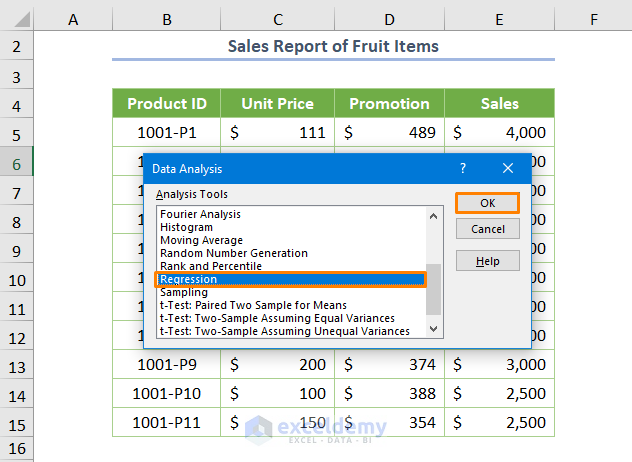
We have the following sample dataset where Sales Report is given with Unit Price, Promotion (for advertisement) and Sales.
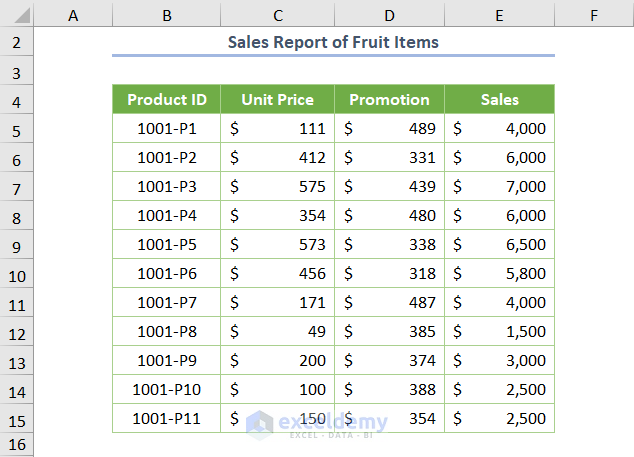
We need to run the multiple regression model to find the relationship between the dependent variable (Sales) and the independent variables (Unit Price and Promotion).
To run the regression model, you need the Data Analysis command. If you don’t have it in the ribbon by default, you may add it the following way.
- Go to File > Options.
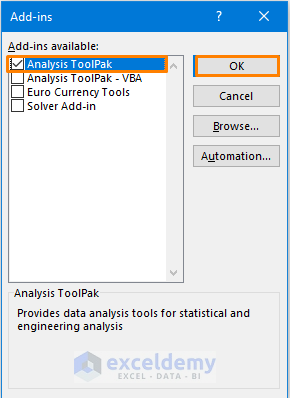
- In the Excel Options, navigate to the Add-ins and press the Go button.
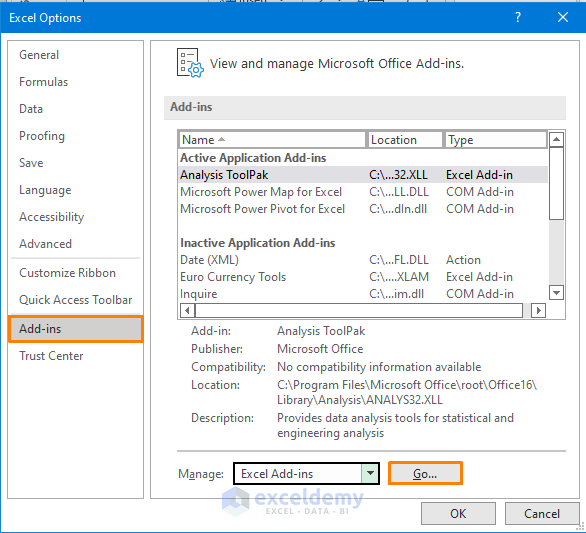
- Check the Analysis ToolPak and press OK.
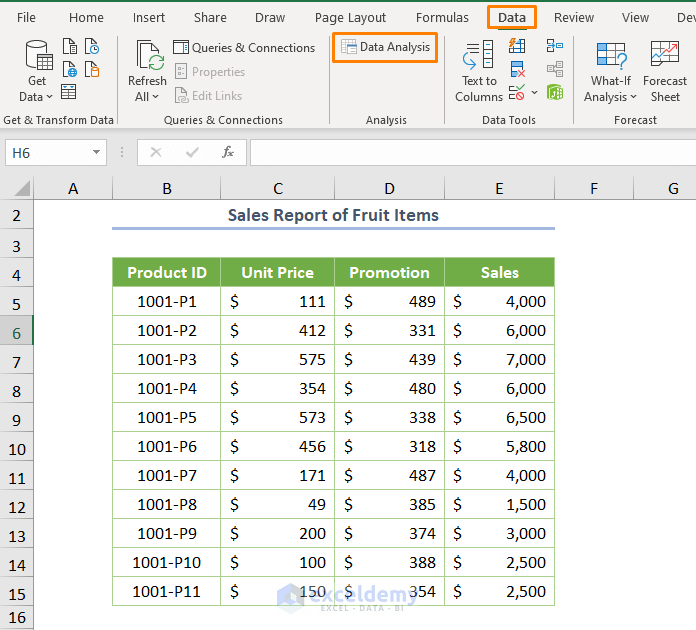
You’re ready to run the regression model for the above dataset.
- Select the Data Analysis command from the Data tab.
- Pick the Regression tool.
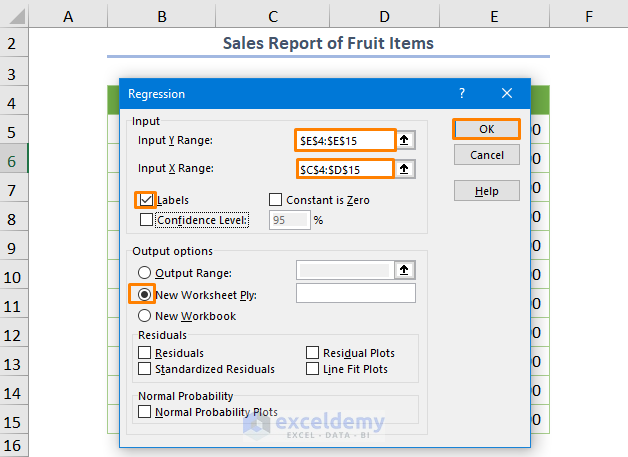
- Specify the Input Y Range as $E$4:$E$15 and Input X Range as $C$4:$D$15. Check the box Labels and press OK.
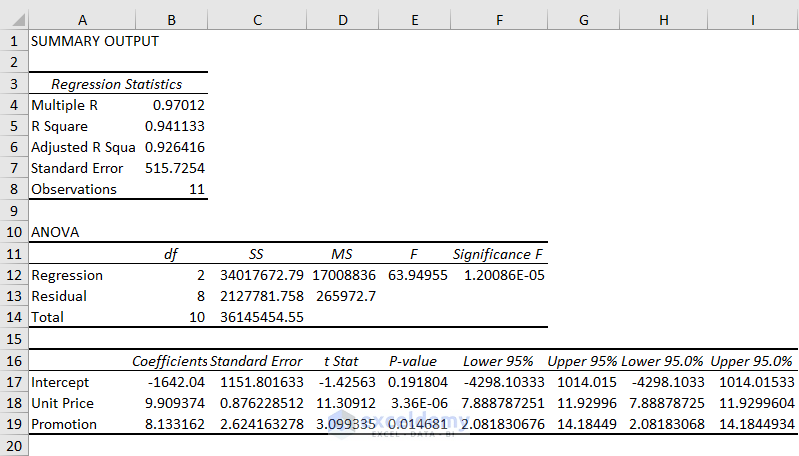
You’ll get the following output.
Example 1 – Interpreting Results of Multiple Regression Statistics Table in Excel
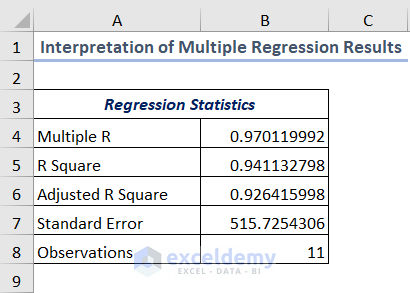
If you look at the upper portion of the regression output, you’ll see a table titled Regression Statistics as shown in the following image.
Here’s how to understand the terms.
- Multiple R (Correlation Coefficient): Multiple R refers to the degree of linear relationship among the variables. The following table may help you to better understand the term.
| Value of Multiple R | Refers to |
|---|---|
| 1 | Strong positive relationship |
| 0 | No relationship |
| -1 | Strong negative relationship |
- R Square (Coefficient of Determination): R Square reveals the goodness of fit. That means how many points fit with the regression line. The higher the value of R Square, the better-fitted the regression line you’ll get. Here, the value of R Square represents an excellent fit as it is 0.94. It means that 94% variation in the dependent variable can be explained by the independent variable. In the case of multiple regression relationships, you have to keep attention to the Adjusted R square.
- Adjusted R Square: Adjusted R Square is fruitful when you have two or more independent variables. As it provides the comparison among the variables which one is more important than the other. The value will be higher than the R Square if a new independent variable improves the model or vice versa. In this dataset, the value of the Adjusted R Square is 0.92. That means 92% of the points fit the regression line.
- Standard Error: The Standard error tells us about the precision of our multiple regression analysis.
- Observations: It shows the number of products which is 11.
Example 2 – Interpreting Regression Results of ANOVA Table in Excel
In the middle of the output, you’ll see the ANOVA (Analysis of Variance) Table.
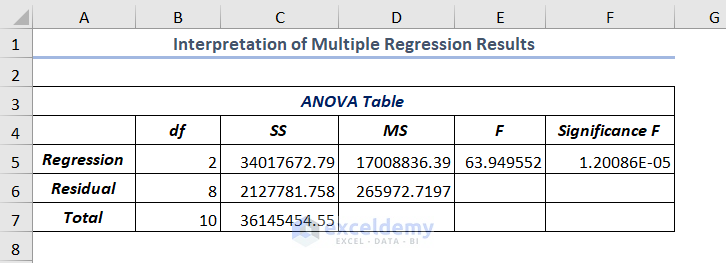
The terms used in the table are as follows.
- df (degrees of freedom): df refers to degrees of freedom. It can be calculated using the df=N-k-1 formula where N is the sample size and k is the number of regression coefficients.
- SS (Sum of Squares): The Sum of Squares is the square of the difference between a value and the mean value. The higher the value of the Sum of Squares refers to higher variation in the values or vice-versa.
- MS (Mean Squares): Mean Squares is mainly the mean of the square of the variation of an individual value and the mean value of the set of observations.
- F (F-test): F or F statistic provides the overall importance of the regression model for the null hypothesis. If you divide the MS of regression by the MS of Residual, you’ll get the F-test.
- Significance F: Significance F is a crucial term to find the output of your model whether it is statistically significant or not. When the value of the Significance F is not greater than 0.05, the independent variables have a statistically significant relationship with the dependent variable. Here, it is 0.00001 which represents that there is a significant relationship between the Unit Price and Promotion (x values) and Sales (y values).
Example 3 – Interpreting Results of Multiple Regression Coefficients Table in Excel
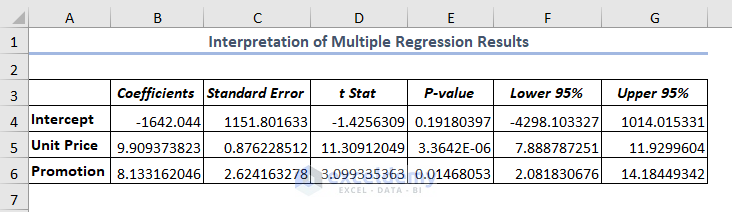
- Coefficients: Coefficients are calculated using the least square method. In this example, the regression equation will be-
y(Sales)=-1642.04 + 9.91*Unit Price + 8.13*Promotion
- Standard Error: It is the standard deviation of least square estimates.
- t Stat: t Stat: refers to the coefficient being equal to zero in the case of the null hypothesis.
- P-value: The P-value shows the statistically significant relationship between the independent and dependent variables. Here, P-value for Unit Price is 0.000003 which is below 0.05. So, Unit Price is statistically significant with the Sales.
- Lower 95%: It means the lower limit when the confidence interval is 95%.
- Upper 95%: It is the upper limit of the confidence interval.
Read More: How to Calculate P Value in Linear Regression in Excel
Download Practice Workbook
Related Articles
- How to Do Simple Linear Regression in Excel
- How to Do Logistic Regression in Excel
- How to Plot Least Squares Regression Line in Excel
- How to Interpret Linear Regression Results in Excel
- How to Interpret Regression Results in Excel
<< Go Back to Regression Analysis in Excel | Excel for Statistics | Learn Excel
Get FREE Advanced Excel Exercises with Solutions!
