In this article, we will show how to use the DEVSQ function in Excel. The DEVSQ function is used to calculate the sum of squares of deviations of data points from the mean of the samples. It indicates the difference between data points. Through this function, we can understand market instability and increasing investment risks in stock exchanges. Also, we use this function to determine temperature variations and blood pressure reading variations. Today, we will show you 3 suitable examples. So, without any delay, let’s start the discussion.
Introduction to DEVSQ Function
- Function Objective:
The DEVSQ function is used to find the sum of squares of deviations of data points from the mean of the samples.
- Syntax:
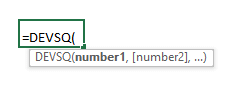
=DEVSQ(number1, [number2], ...)- Arguments Explanation:
| ARGUMENTS | REQUIRED/OPTIONAL | EXPLANATION |
| number1 | Required | 1st number of the data points. |
| [number2] | Optional | 2nd number or array of data points. |
| [number 255] | Optional | Maximum 255 data points can be inserted. |
- Return Parameter:
A value containing the sum of squares of deviations of data points from the mean of the samples.
- Version:
The DEVSQ function is available in Excel 365, Excel 2019, Excel 2016, Excel 2013, Excel 2011 for Mac, Excel 2010, and Excel 2007.
Using DEVSQ Function in Excel: 3 Suitable Examples
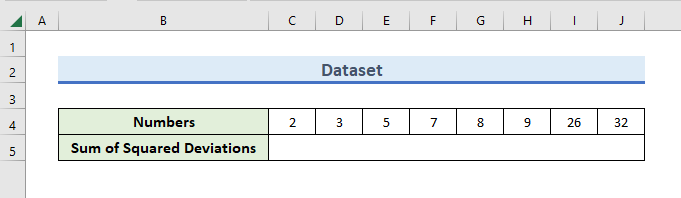
The sum of squared deviations serves as a measure of data variance. It indicates how different the data is. But figuring them out can be a lot of work if we have a big dataset. With the DEVSQ function, we can do the job easily in a single step. In the next section, 3 examples show how to use the DEVSQ function in Excel. Here, we will use 3 datasets. In the 1st dataset, we will randomly take 8 numbers.
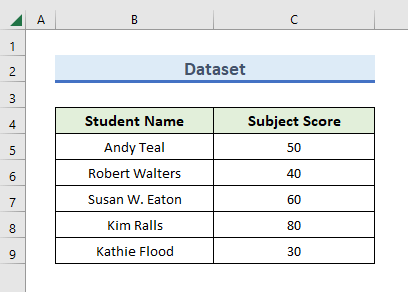
In the 2nd dataset, we will use a dataset where the names of the students are in column B and their scores are in column C.
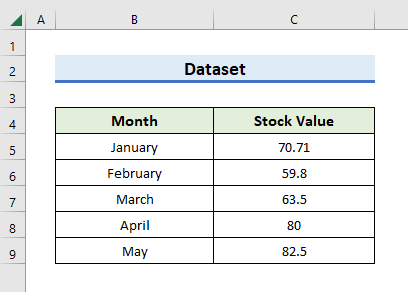
And lastly, in the 3rd dataset, we will use the dataset of a company’s stock value in 4 consecutive months. Now, we have to find the sum of squared deviations for these datasets.
1. Apply DEVSQ Function to Find Out Sum of Squared Deviations of Random Numbers in Excel
Before working with previously declared datasets, we will show the method for a simple dataset for simplicity. For that reason, we will randomly generate some numbers and find out the sum of squared deviations of these random numbers. Let’s follow the steps below to learn the method.
STEPS:
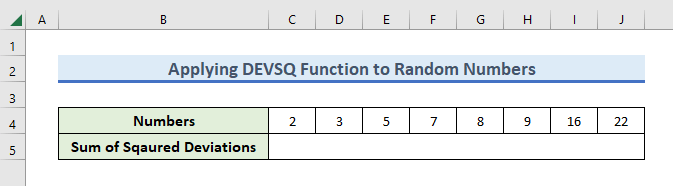
- Firstly, we have taken our 1st dataset.
- Secondly, we will figure out how different the values are.
- To do so, select the C5 cell and write the following formula:
=DEVSQ(B4:J4)
- Then, press Enter to get out of the editing mode.
- Instantly, you can watch the sum of squared deviations of these 8 numbers is 324.
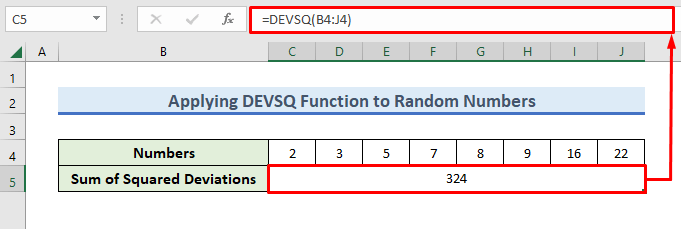
- Here, the results indicate the difference in data.
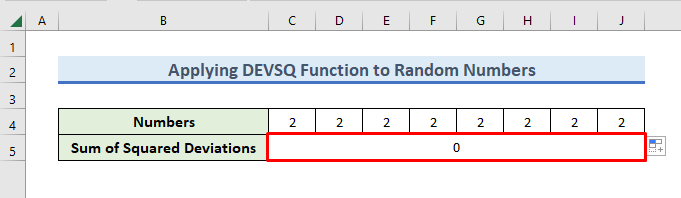
- So, if all the numbers are the same, the result will be 0.
- Similarly, if the data showed a larger value gap, the result would be higher than 324.
- So, we have set all the numbers to 2 for checking.
- As a result, the C5 cell is showing 0 as there is no difference between numbers.
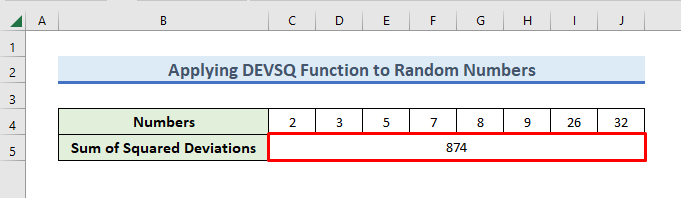
- In the following step, we will increase the difference between numbers.
- Therefore, we have changed the last 2 numbers.
- Here, we have inserted 26 & 32 in place of 16 & 22.
- As a result, the Sum of Squared Deviations has increased from 324 to 874.
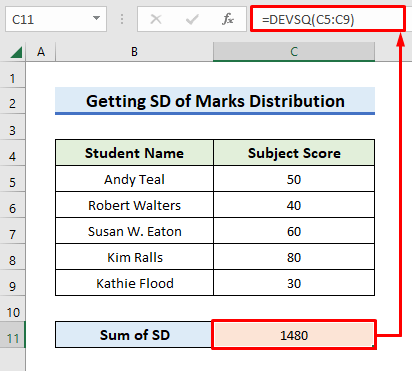
2. Get Sum of Squared Deviations of Marks Distribution Using Excel DEVSQ Function
In this section, we will perform the calculation of the sum of Squared Deviations of marks distribution. So, let’s follow the steps below to learn the method.
STEPS:
- In this case, we have information on students’ names and their respective marks.
- In the C11 cell, we will calculate the result.
- So, we need to write the following formula in the C11 cell:
=DEVSQ(C5:C9)
- After that, press Enter to see the result.
- As a result, we can see the Sum of the Squared Deviation of the marks distribution of the students.
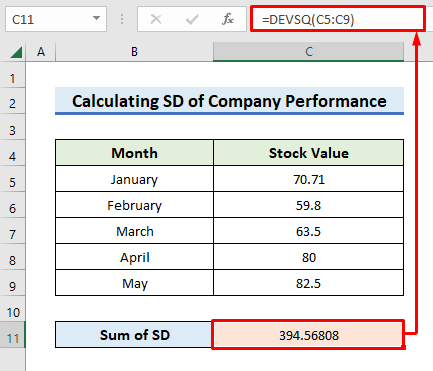
3. Insert DEVSQ Function to Calculate Sum of Squared Deviations of Performance of Company in Excel
In the stock exchange, it is important to monitor the change in the stock value of a company over a period of time. High deviation over a short time shows that the condition of the company is not stable and risk is involved there. So, let’s follow the step below to calculate the Sum of Squared Deviations of the performance of the company using the DEVSQ function in Excel.
STEPS:
- Here, we have information on the company’s stock price over 4 months.
- In the C11 cell, we will calculate the result.
- Firstly, type the following formula in the C11 cell:
=DEVSQ(C5:C9)
- After that, press Enter to see the result.
- As a result, we can see the Sum of the Squared Deviation of the performance of the company.
Download Practice Workbook
To practice by yourself, download the following workbook
Conclusion
In this article, we have demonstrated how to use the DEVSQ function in Excel. Moreover, there is a practice workbook at the beginning of the article. So, go ahead and give it a try. Lastly, please use the comment section below to post any questions or make any suggestions you might have.
<< Go Back to Excel Functions | Learn Excel
Get FREE Advanced Excel Exercises with Solutions!
