As financial analysts, we use Excel functions to calculate the sum of squared deviations in evaluating the variation in daily stock values. Moreover, it indicates market instability and increasing investment risks. Also, we use this function to determine temperature variations and blood pressure reading variations, among other things. This article will show you 2 suitable ways to find the sum of squared deviations in Excel.
How to Find Sum of Squared Deviations in Excel: 2 Easy Ways
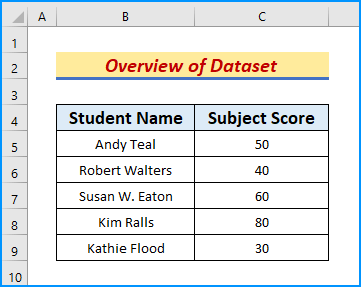
Finding the sum of squared derivations serves as a measure of data variance. However, calculating them can be really cumbersome if we take a large dataset. With that in mind, we will try to implement 2 methods to calculate the sum of squared deviations in Excel. To demonstrate, we take a dataset where column B represents the students’ names and column C indicates their respective scores.
Method 1: Find the Sum of Squared Deviations Using the Mean Average
The first method aims to calculate the sum of squared deviations from the mean using a computational equation in a spreadsheet. The difference between the data values and the mean, squared, makes up the sum of squares. The equation is
![]()
Where,
SS = Sum of Squared Deviations
x = Deviations
n = Mean
Based on this equation, we will compute the SS ( sum of squared deviations) using the AVERAGE and SUM functions. Let’s go through 4 steps to implement the methods.
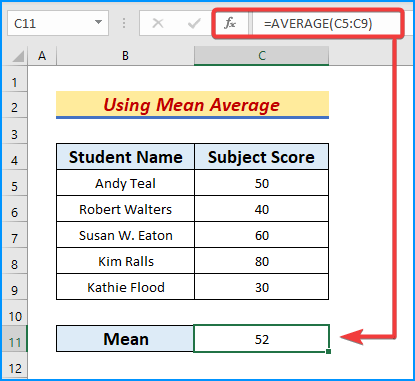
Step 1: Use AVERAGE Function to Find Mean Average
The objective of the first step is to find the arithmetic mean of the given dataset. To do so, we will use the average function as mentioned earlier. The AVERAGE function is categorized under the Statistical functions in Excel. This function returns the average value of a given argument.
- Firstly, in cell C11, type the following formula.
=AVERAGE(C5:C9)
- Afterward, press the Enter or Tab keys to get 52 as output.
- Thus, we obtain the mean of the scores as 52.
Step 2: Subtract Mean to Determine Deviations
In the second step, we will take the mean obtained in the previous step and subtract it from each value of column C. That will thoroughly determine the Deviations in the scores. Follow the procedure below to see the demonstration.
- To begin with, subtract in D5 using the formula
=C5-52
- Next, pressing Enter key will display the output.
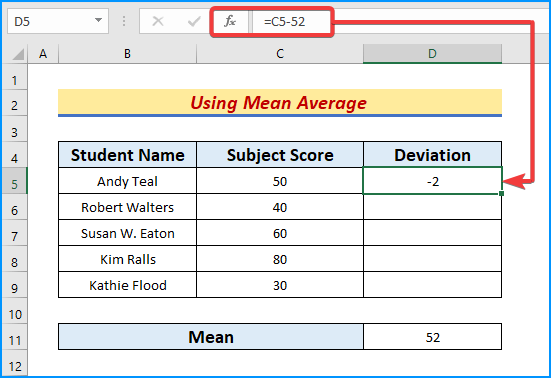
- Later, hold the AutoFill tool and drag it down to get the other derivations.
- Hence, the derivations pop up in the display.

Step 3: Calculate Squared Deviations
We will compute the squared derivations in the third step. Follow the below procedure again to do so.
- First, in cell E5, type
=D5*D5
- Further, press Enter.
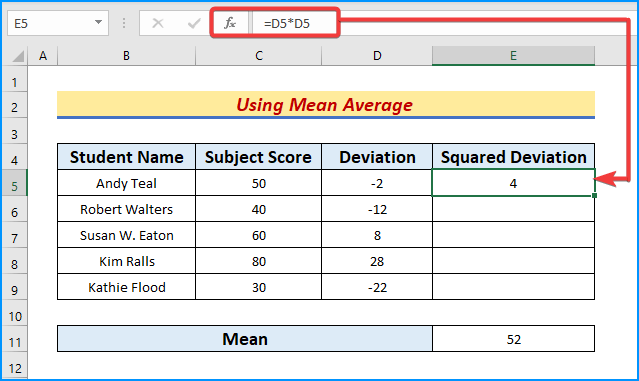
- After obtaining the output, drag the formula cell down using the AutoFill tool.
- Thus, we obtain the squared derivations.

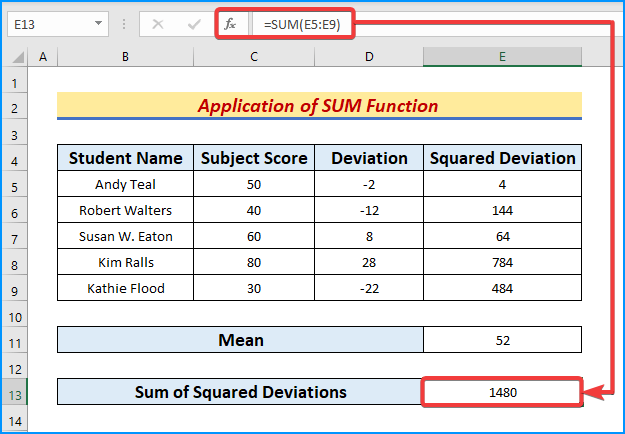
Step 4: Apply the SUM Function to Get Sum of Squared Deviations
In the final step, we will use the SUM function to find the sum of squared derivations. The SUM function returns the summation of an array or range. Let’s see the given procedure.
- In E13, type the following SUM formula,
=SUM(E5:E9)
- Here, the SUM function returns 1480 as the sum of the range (E5:E9).
Read More: How to Calculate Variance and Standard Deviation in Excel
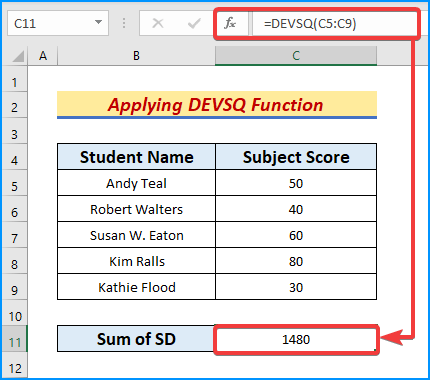
Method 2: Apply DEVSQ Function to Get Sum of Squared Deviations
Excel’s Statistical functions include the DEVSQ function. We compute the total squared deviations from the mean through this function. The DEVSQ function finds the total squared deviations from the mean. Therefore, in this method, we will apply the function to determine the sum of squared derivations. Follow the steps.
Steps:
- Firstly, in cell C11, write the formula below.
=DEVSQ(C5:C9)
- Afterward, press the Enter or Tab keys to obtain 1480 as output.
- The range of the arguments is from 1 to 255. However, the DEVSQ function in Excel 2003 can only take 30 number inputs. Instead of the arguments, use a reference to an array, separated by commas.
- Thus, we obtain the sum of squared derivations.
Read More: How to Calculate Quartile Deviation in Excel
Download Practice Workbook
Download this practice workbook to exercise while reading this article. It contains all the datasets in different spreadsheets for a clear understanding. Try it yourself while you go through the methods.
Conclusion
In conclusion, we have discussed some suitable ways to find the sum of squared deviations in Excel. Please leave any further queries or recommendations in the comment box below.
Related Articles
<< Go Back to Deviation in Excel | Excel for Statistics | Learn Excel
Get FREE Advanced Excel Exercises with Solutions!
