Microsoft Excel is one of the most powerful programs. Its features and functions allow us to use any information fully. In this piece, we’ll go through the steps required to make an Excel template for your Deviation Reports. A Deviation Report may be helpful when looking at the causes of problems and the measures taken to fix them. With this in mind, we’ll look at the detailed procedures for making a Deviation Report Format in Excel.
What Is Deviation Report?
A corporation may record and handle quality control system deviations when it has a deviation protocol. A deviation analysis review’s major goal is to provide evidence that the source of the deviation has been determined, that remedial steps have been implemented and that the company’s security, authenticity, power, and pureness have been restored.
Step-by-Step Procedures to Create Deviation Report Format in Excel
If we know the proper steps, it can be easy to use Excel to make a Deviation Report Format. This post will show you how to make an Investigation report format in Excel in 4 steps. In the first step, it will set up the Data Model. The following step will discuss how we can implement the Excel Validation for the Data. In the next step, we’ll input the data required for the report. Last but not least, we will make a deviation in Excel. Follow these steps carefully to quickly figure out how to do something like the demonstration below.
Step 1: Set up Data Model for Deviation Report in Excel
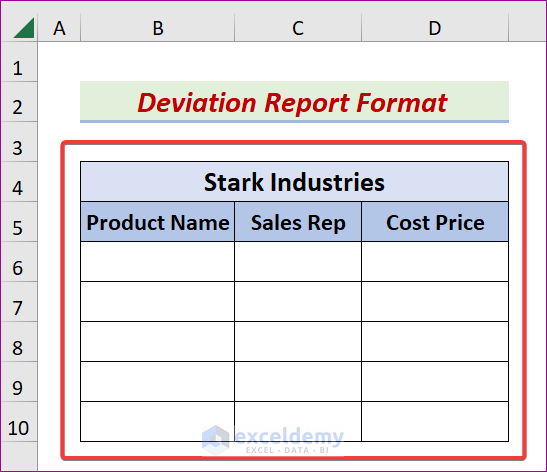
The first and foremost step we will take is to build a Data Model for a company named Stark Industries. For demonstration, let’s assume the company sells computer accessories, and here, we will generate three columns titled Product Name, Sales Rep, and Cost Price. Please follow the steps below to set up the Data Model for the Deviation Report of Stark Industries.
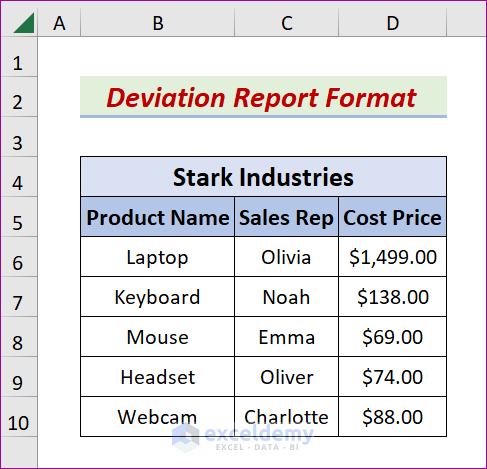
- First, we will build a table titled Stark Industries, with three columns named Product Name, Sales Rep, and Cost Price in the B4:D10 field.
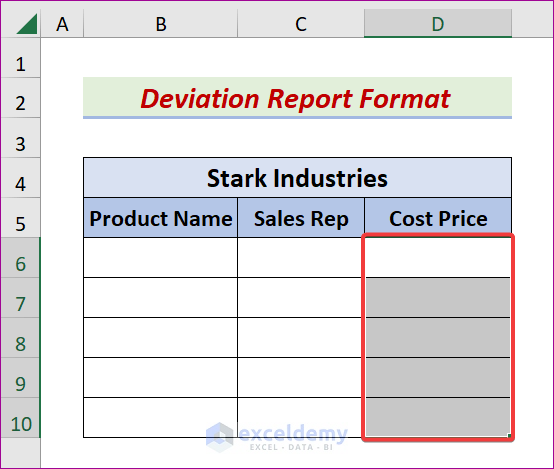
- Second, select the D6:D10 range.
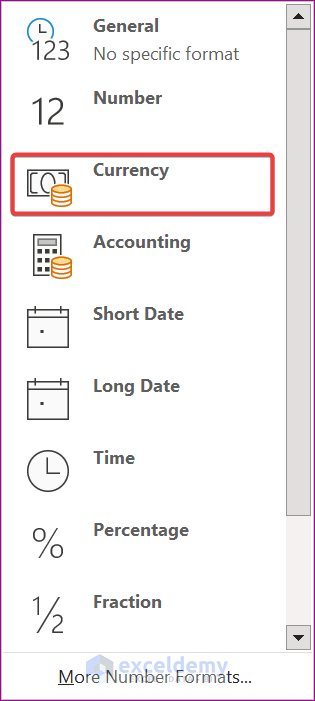
- After that, navigate to the Home tab.
- Later, click the Down Arrow icon from the Number group.
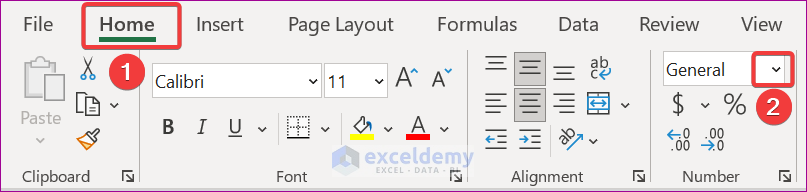
- Subsequently, a menu bar will open, and choose Currency.
- Finally, the Initial Model will look like the below one.
Read More: How to Calculate Variance and Standard Deviation in Excel
Step 2: Apply Excel Validation to Report Data
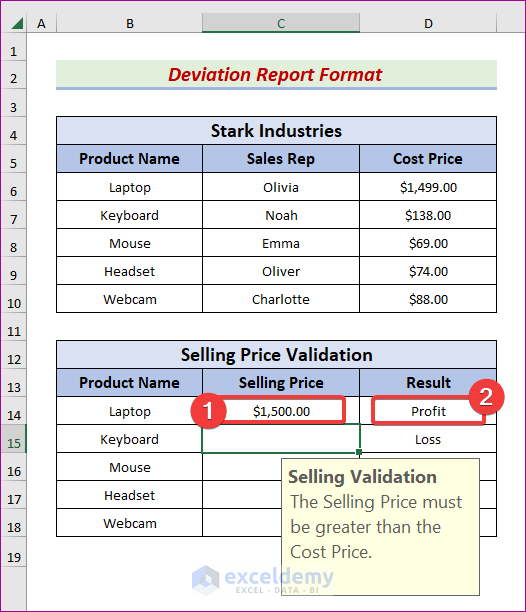
In this article context, we will implement Excel Validation for the Data. To illustrate, let’s assume a table titled Selling Price Validation with three columns named Product Name, Selling Price, and Result. Throughout the Selling Price column, we will validate the Selling information. A warning message window will pop up when the Selling Price is not greater than the Cost Price. In contrast, the Result column will plot whether it is profit or loss. Please do the assignment by following the instructions below.
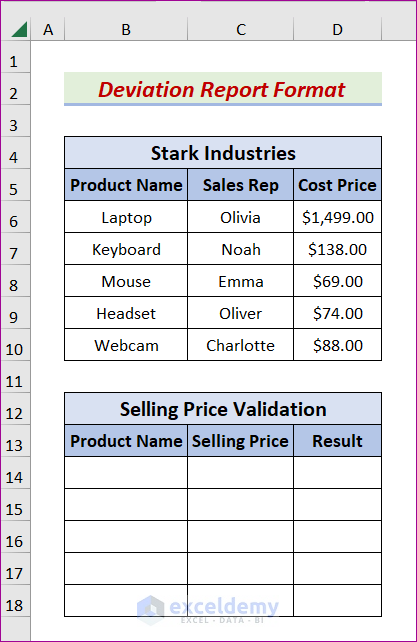
- To begin, make another table in the field B12:D18 and name it Selling Price Validation.
- Second, take three columns titled Product Name, Selling Price, and Result.
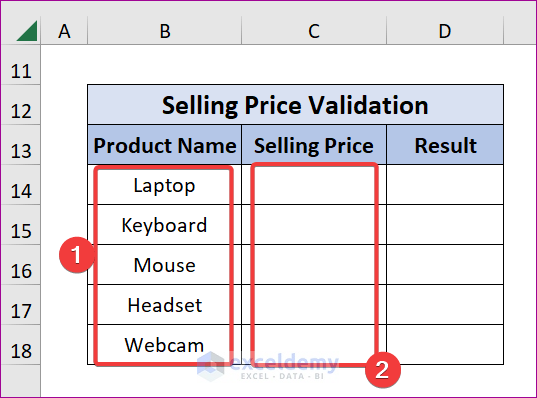
- After that, input the items in the Product Name column.
- Later, select the C14:C18 range and make the cell data type Currency.
- Presently, pick the C14 cell.
- Latterly, go to the Data tab and the Data Tools.
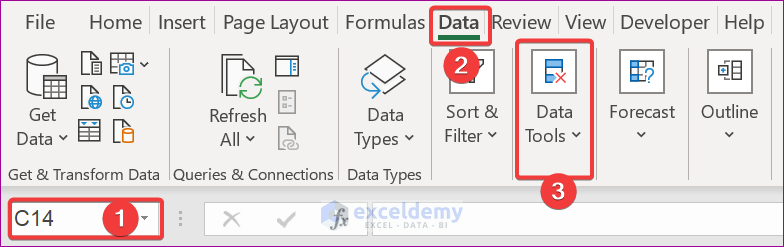
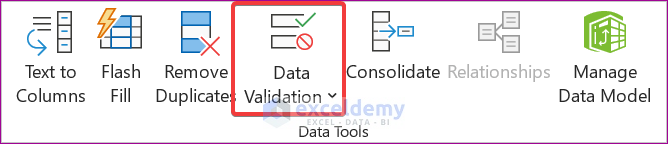
- Next, choose the Data Validation icon.
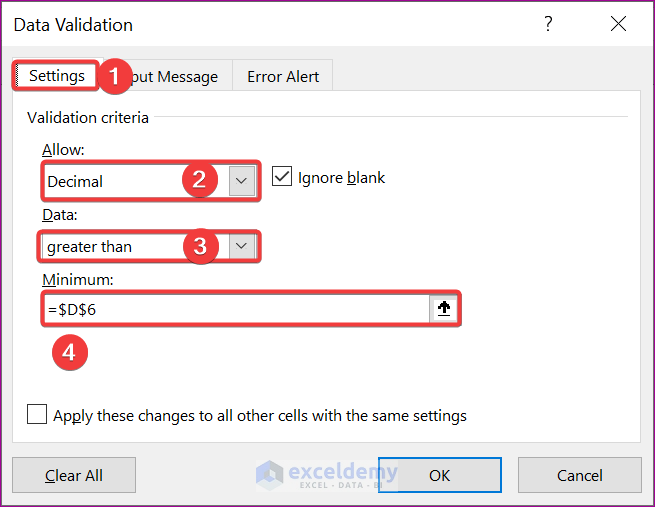
- Consequently, the Data Validation window will appear, and go to the Settings tab from the same window.
- Currently, choose Decimal from the Allow drop-down, and select the greater than option from the Data drop-down.
- Type the following formula in the Minimum box.
=$D$7- It is essential to modify the formula for Validation to other cells.
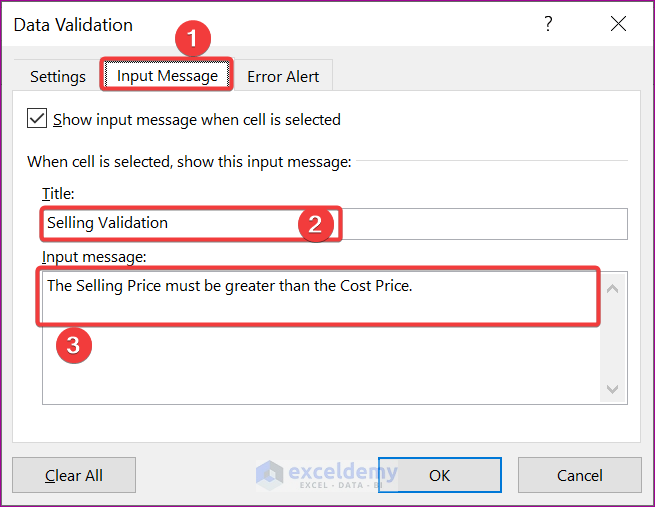
- Now, go to the Input Message tab from the Data Validation window.
- Later, input the Title and write a message in the Input message section.
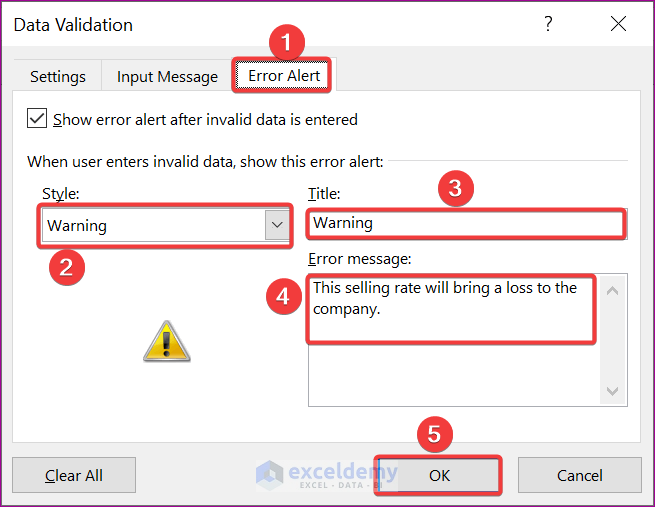
- Now, go to the Error Alert tab and select Warning from the Style drop-down.
- Lastly, type the Error title, input an error message, and hit OK.
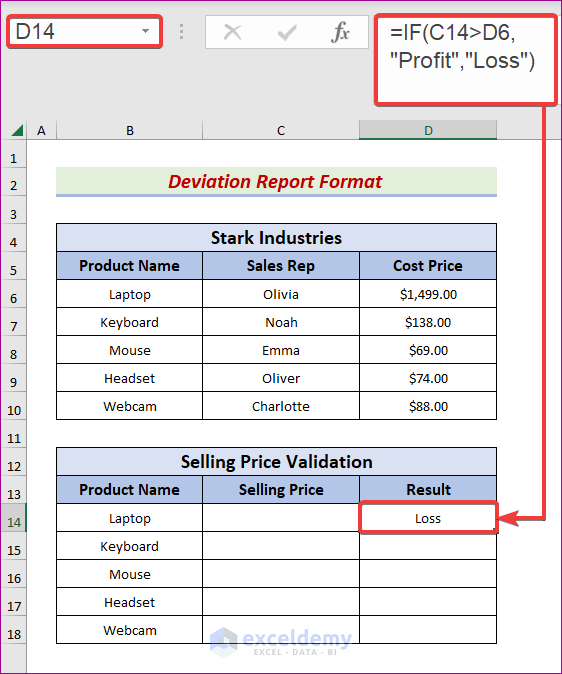
- Currently, select the D14 cell.
- Afterward, input the following formula and hit the Enter key.
=IF(C14>D6,"Profit","Loss")- Due to this, we will get the below outcome.
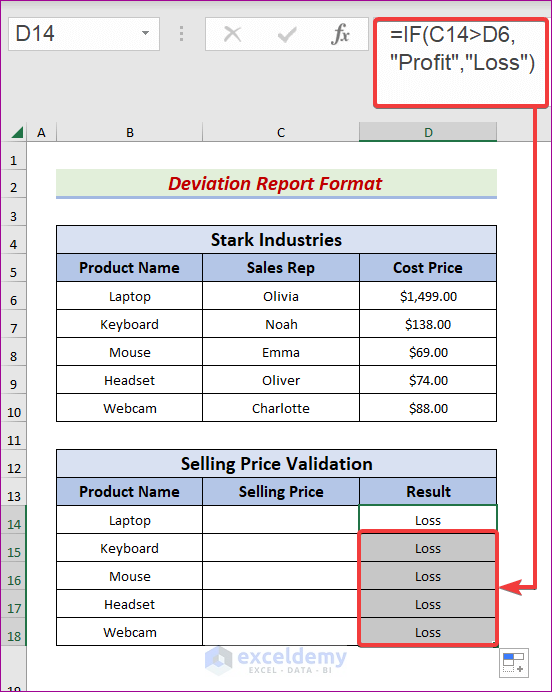
- We have to do the same procedure for the other cells in the Result column at this stage.
- To achieve this, use the AutoFill Handle icon and drag it to the D18 cell.
- As a result, we will get the intended output.
Read More: How to Calculate Quartile Deviation in Excel
Step 3: Input Required Data to Create Deviation Report in Excel
We must input the required data to analyze and deliver a final report. To finish the assignment, kindly follow the instructions that are provided below.
- First, select the C14 cell.
- Immediately, we will notice the Input message to prevent unintended entry into the cell.
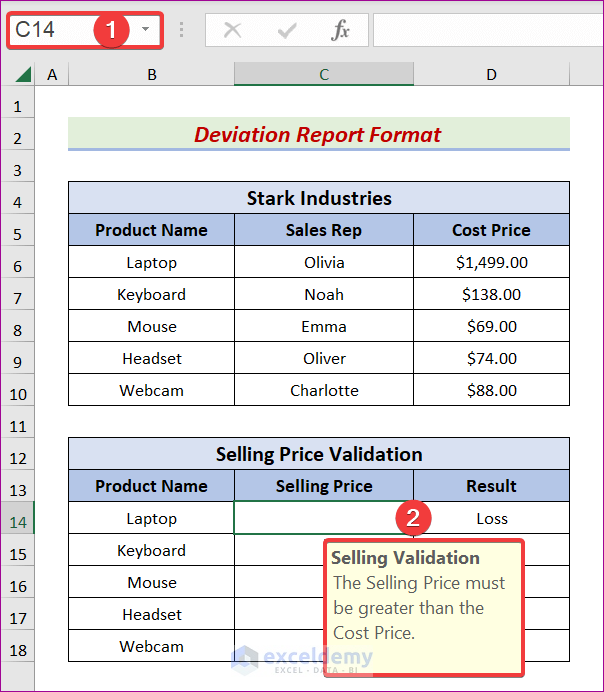
- Now, input a value greater than the Cost price and look at the Result section.
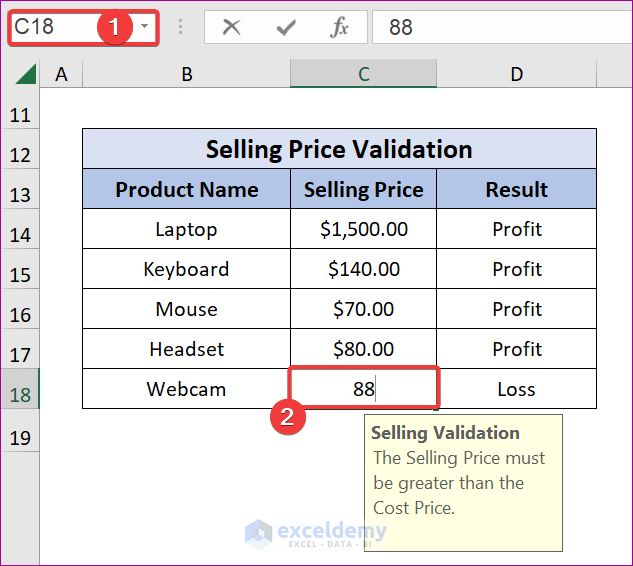
- Likewise, do the same procedure for the other cells except for the C18 cell.
- Pick the C18 cell and enter a value less than the Cost price.
- Later, hit Enter.
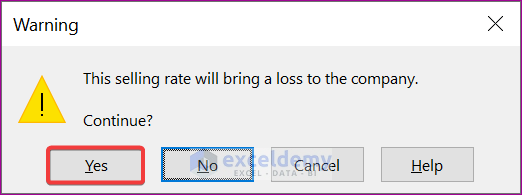
- Consequently, a Warning window will pop up, and then choose Yes.
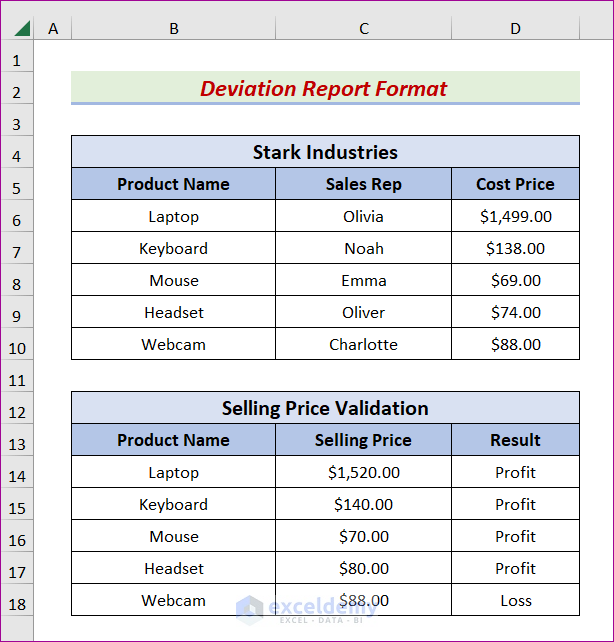
- At this stage, our Deviation Report Format will look like this.
Step 4: Generate Report Form to Conclude
Last but not least, we will create a Report Form to make comments, suggestions, and many more for the manager of Stark Industries. Please read the instructions carefully and follow them to accomplish the task.
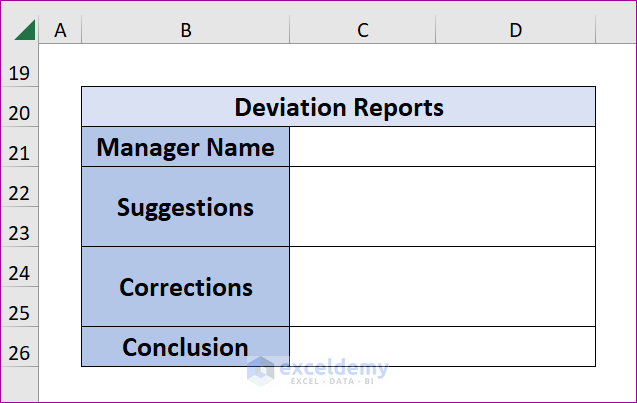
- To begin, create a table titled Deviation Reports containing four pieces of information Manager Name, Suggestions, Corrections, and Conclusion.
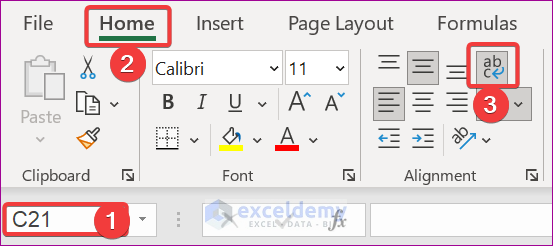
- After that, choose C21, go to the Home tab, and click Wrap Text.
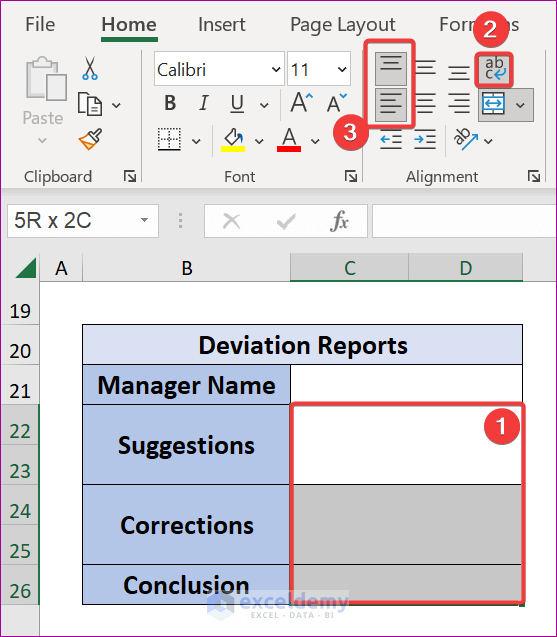
- Later, select the other boxes, and from the Alignment group, tap Wrap Text and choose Top and Left align to see the Deviation Reports below.
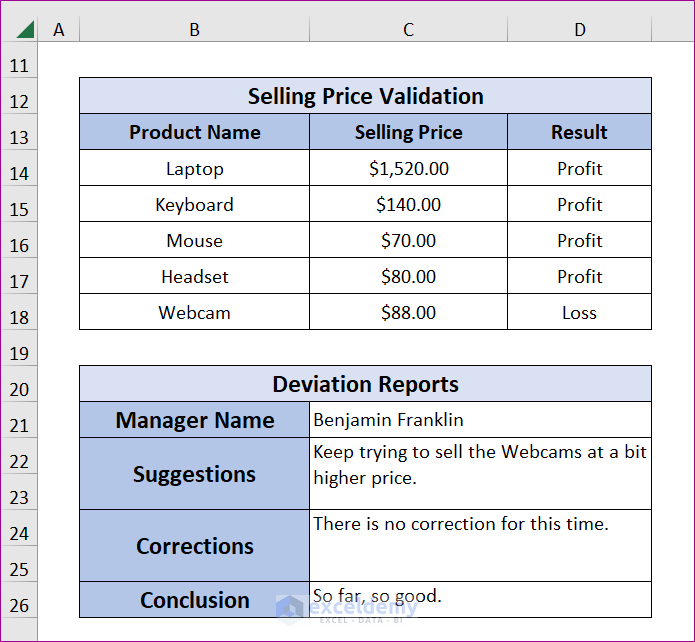
- After that, input all your desired entries, as we did down.
Download Practice Workbook
If you would like a free copy of the sample workbook discussed in the presentation, please click the link below.
Conclusion
You can create a Deviation Report Format in Excel by following the instructions below. Please include any further suggestions or improved approaches as you continue to employ them. Remember to include your views, inquiries, and directions in the designated space.

