Basics of Variance and Standard Deviation
Variance examines how distinct numerical values relate to one another within a data collection. It treats all values that have deviated from the mean equally, regardless of their direction. Standard Deviation overviews how the values are distributed over a given dataset.
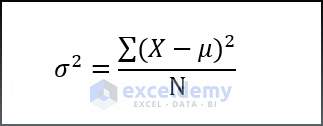
There are two types of Variance statisticians usually take into account, and the corresponding formula can be described as follows:
- Population variance
- Sample variance
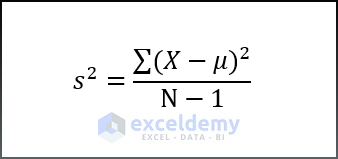
- X= Value of each data point,
- μ= Mean value,
- N= Sample Size.
The formula of Standard Deviation is nearly identical to that of the Variance. When you square root each Variance, you get the corresponding Standard Deviation.
Methods to Calculate the Variance and Standard Deviation in Excel
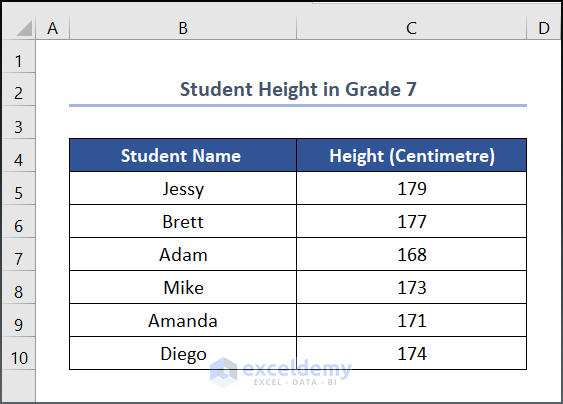
We have a dataset for Student Height in Grade 7.
Part 1 – Calculating Variance
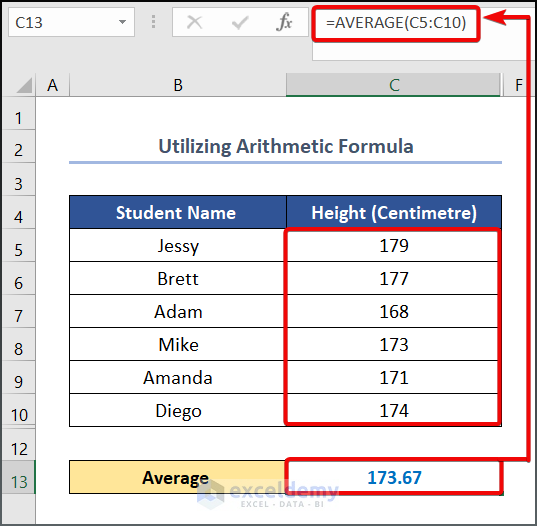
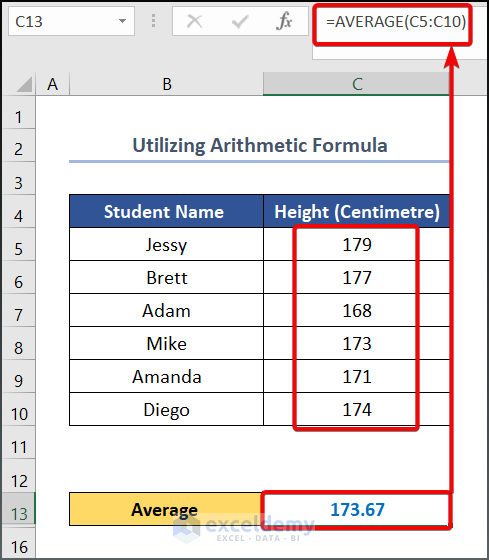
Method 1.1 – Using an Arithmetic Formula
Steps:
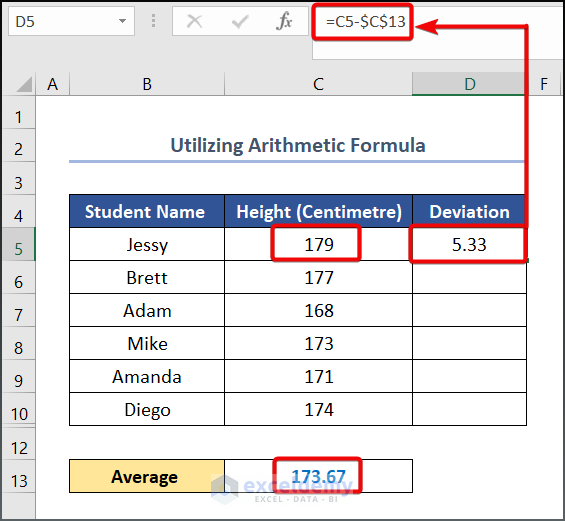
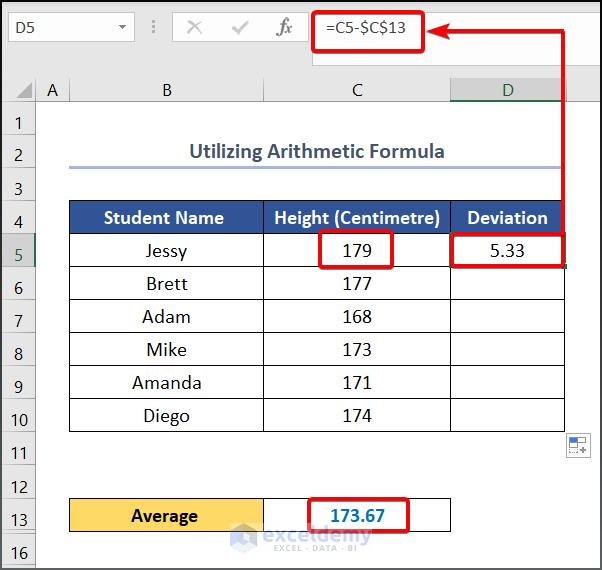
- Enter the following formula in cell C13.
=AVERAGE(C5:C10)- Hit Enter.
- Use the following formula in cell D5.
=C5-$C$13
C5 and C13 cells refer to the student’s Height and the Average values, respectively.
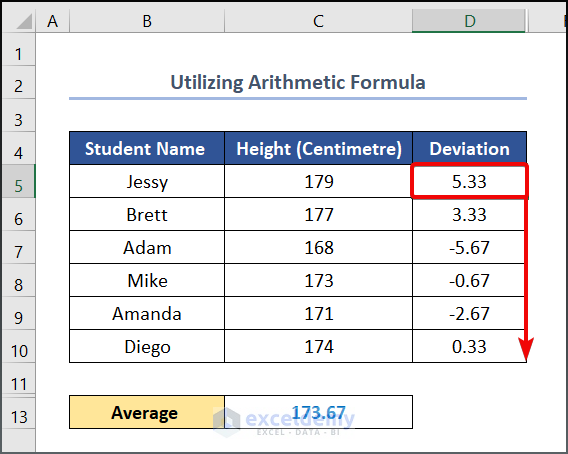
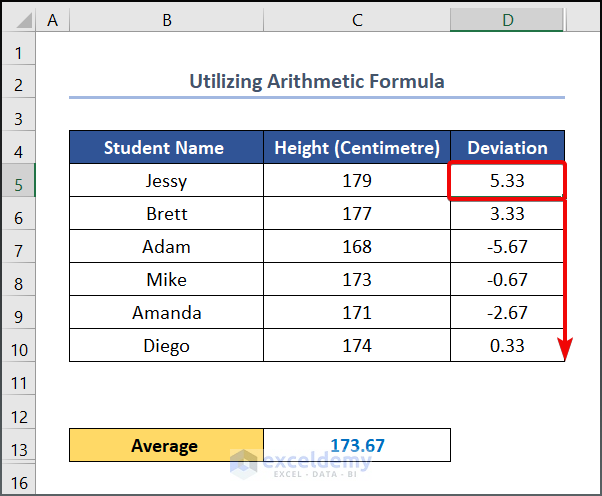
- Drag the Fill Handle tool to get the other values.
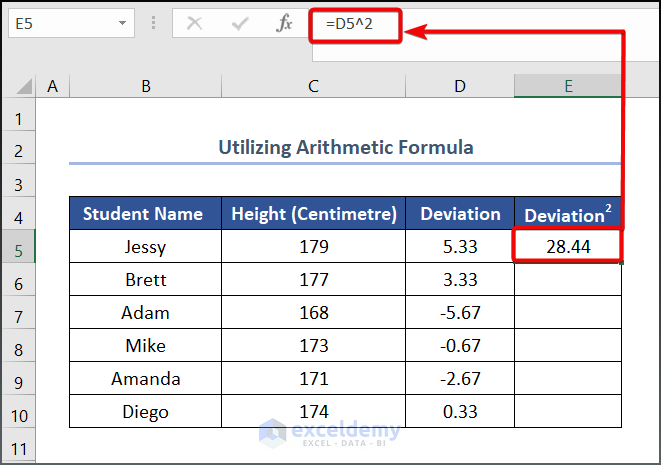
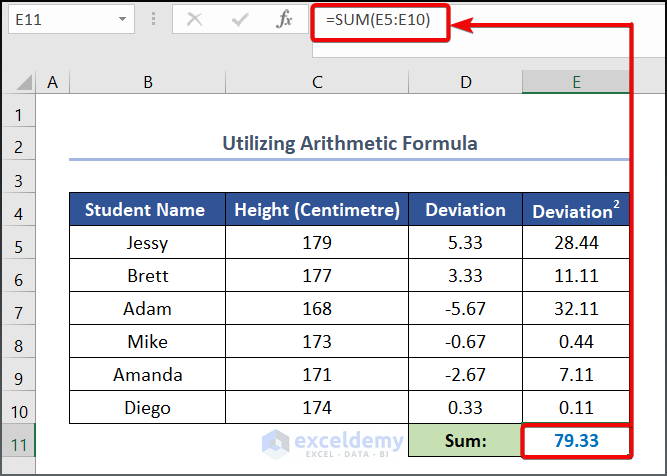
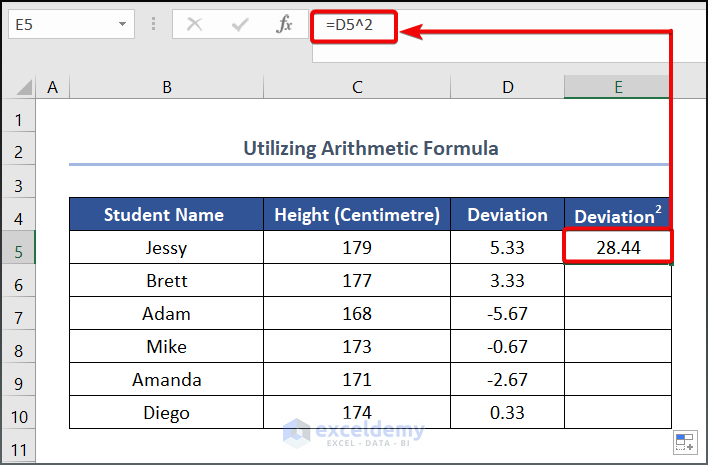
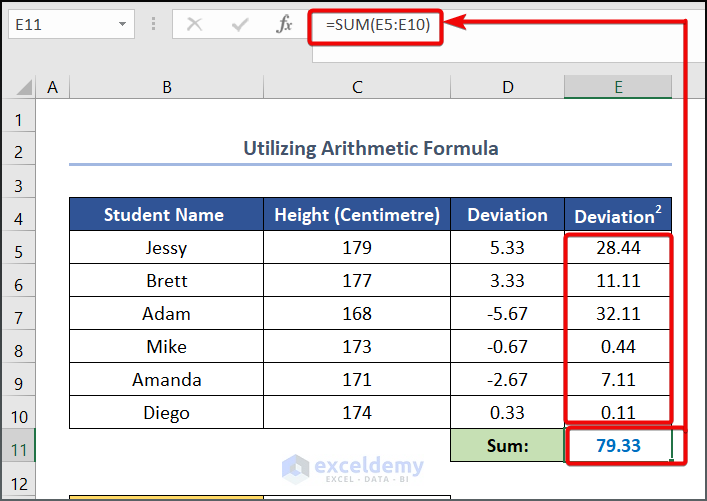
- To get the squared value of Deviation, use the following formula in cell E5.
=D5^2
D5 refers to the Deviation.
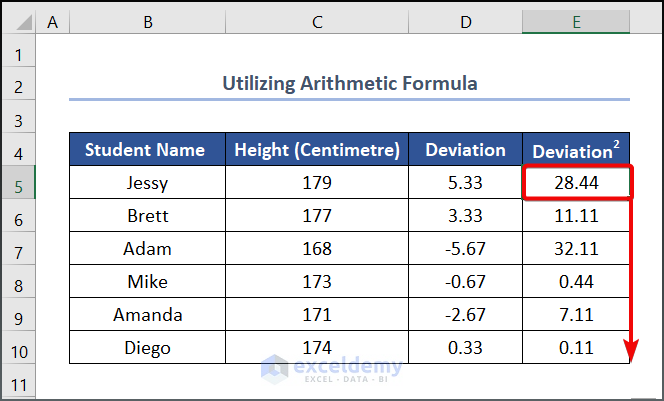
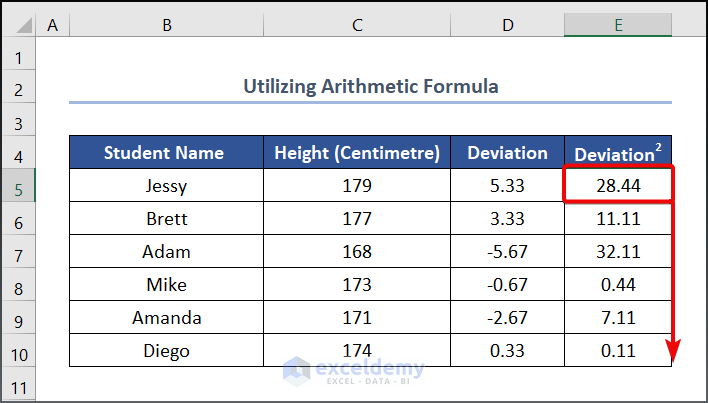
- Drag the Fill Handle tool from E5 to E10.
- Use the following formula in cell E11 to calculate the sum of the squared deviation value.
=SUM(E5:E10)
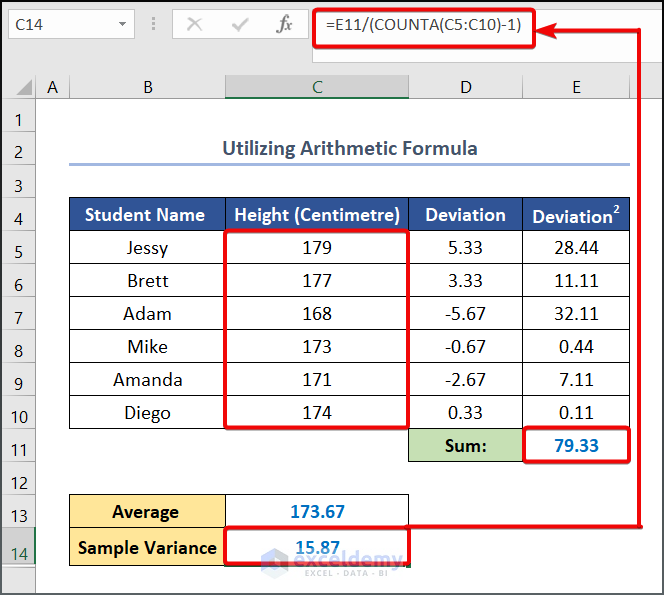
- To calculate the Sample Variance, enter the following formula in cell C14.
=E11/(COUNTA(C5:C10)-1)
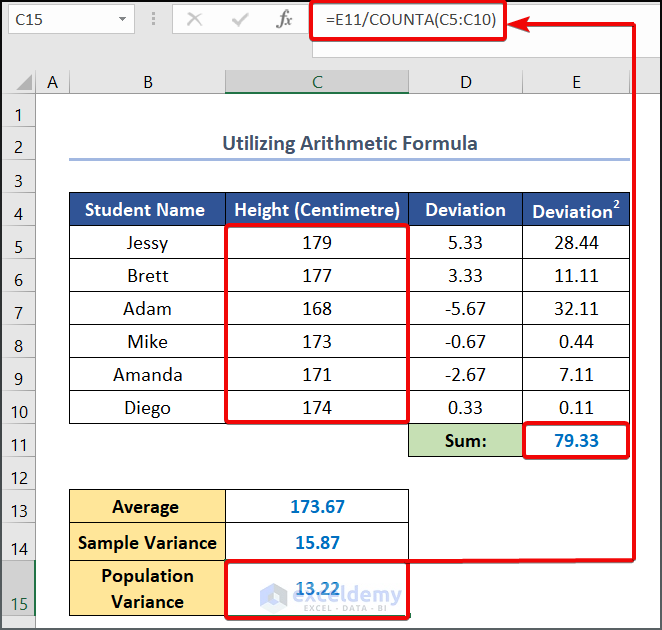
- Use the following formula in cell C15 to calculate the Population Variance.
=E11/COUNTA(C5:C10)
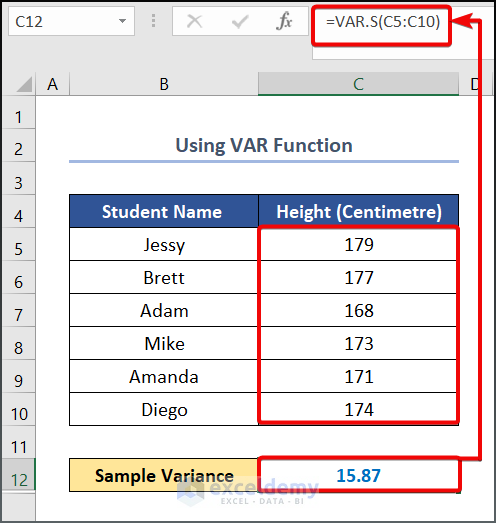
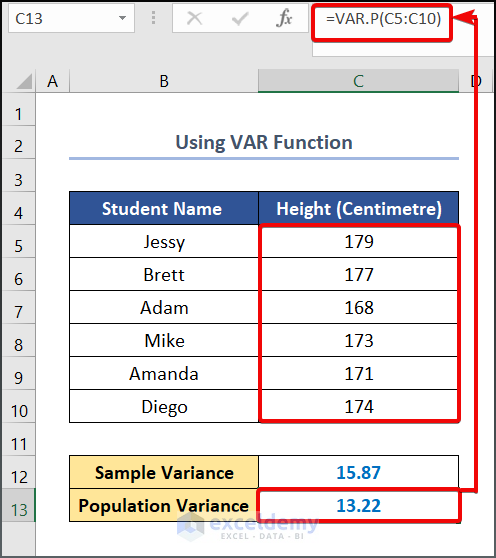
Method 1.2 – Using the VAR Function
Steps:
- Use the following formula in cell C12.
=VAR.S(C5:C10)
- Enter the following formula in cell C13 to calculate Population Variance.
=VAR.P(C5:C10)
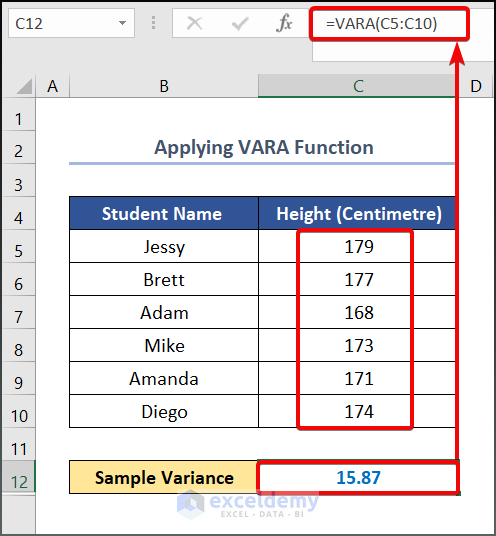
Method 1.3 – Applying the VARA Function
Steps:
- Use the following formula in cell C12.
=VARA(C5:C10)
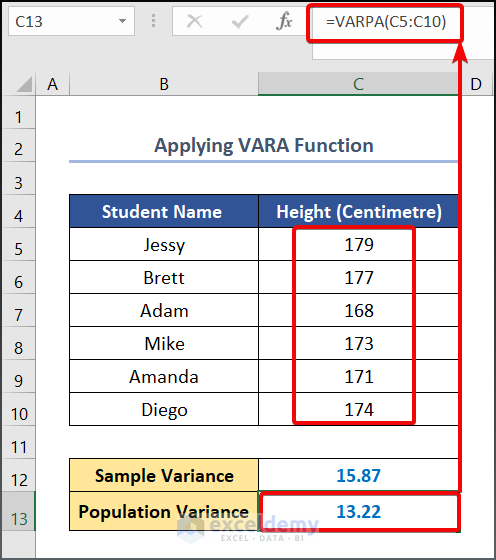
- Enter the following formula in cell C13.
=VARPA(C5:C10)
Read More: How to Calculate Quartile Deviation in Excel
Part 2 – Calculating Standard Deviation
Method 2.1 – Utilizing an Arithmetic Formula
Steps:
- Enter the following formula in cell C13.
=AVERAGE(C5:C10)
- Press the Enter button to see the output.
- Use the following formula in cell D5.
=C5-$C$13
- Drag the Fill Handle tool to get the other values.
- Use the following formula in cell E5.
=D5^2
- Drag the Fill Handle tool down.
- Use the following formula in cell E11 to calculate the sum of the squared deviation value.
=SUM(E5:E10)
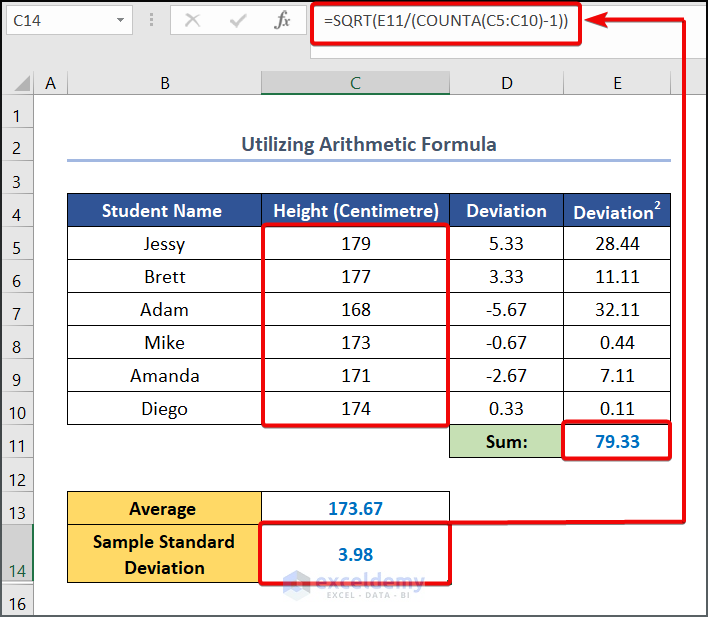
- To calculate the Sample Standard Deviation, enter the following formula in cell C14.
=SQRT(E11/(COUNTA(C5:C10)-1))
Formula Breakdown
- COUNTA(C5:C10) → Here the COUNTA function counts the number of cells in a range that are not empty. Here, the C5:C10 is the value1 argument that refers to the Height.
- Output → 6
- SQRT(E11/(COUNTA(C5:C10)-1)) →The given SQRT function divides the E11 cell value to COUNTA(C5:C10)-1 and returns the square root output to cell C14.
- Output → 3.98
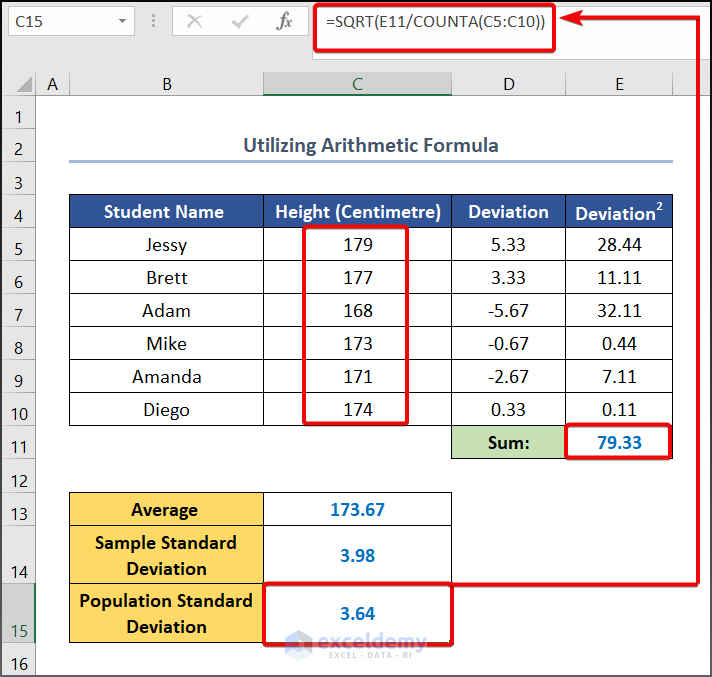
- Use the following formula in cell C15 to calculate the Population Standard Deviation.
=E11/COUNTA(C5:C10)
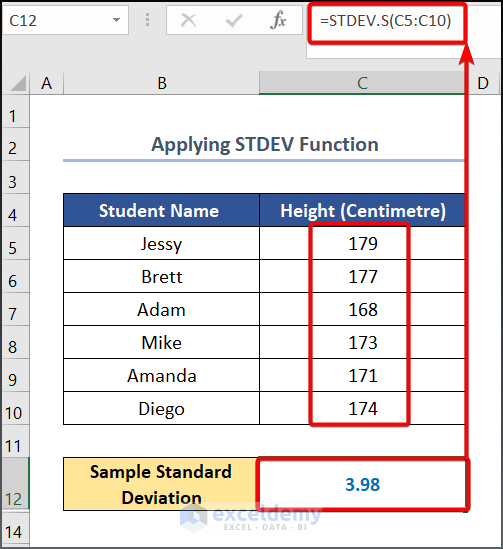
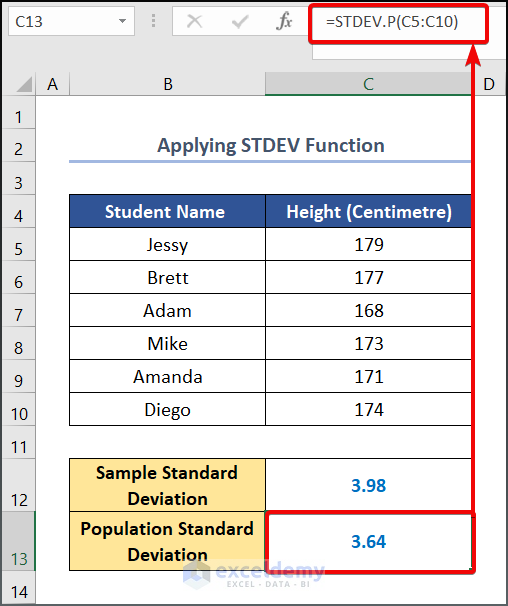
Method 2.2 – Applying the STDEV Function
Steps:
- Use the following formula in cell C12.
=STDEV.S(C5:C10)
- Use the following formula to get the Population Standard Deviation.
=STDEV.P(C5:C10)
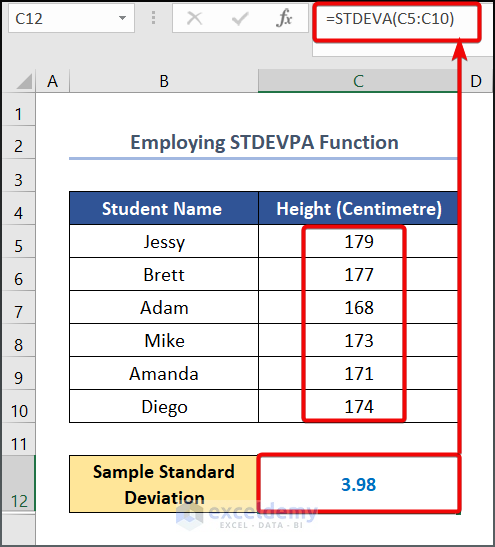
Method 2.3 – Using the STDEVPA Function
Steps:
- Input the following formula in cell C12.
=STDEVA(C5:C10)
- Copy and paste the following formula in cell C13.
=STDEVPA(C5:C10)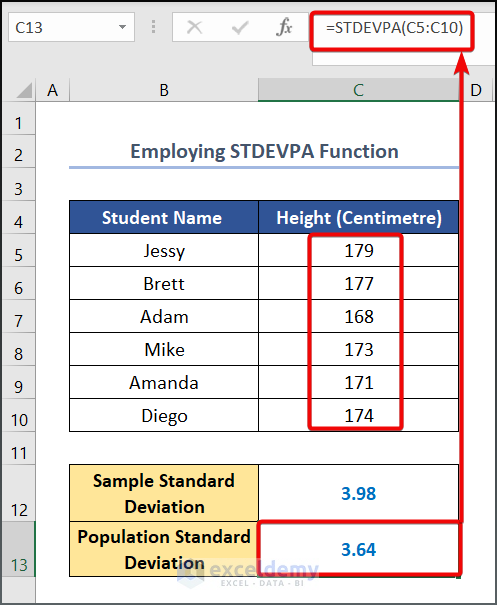
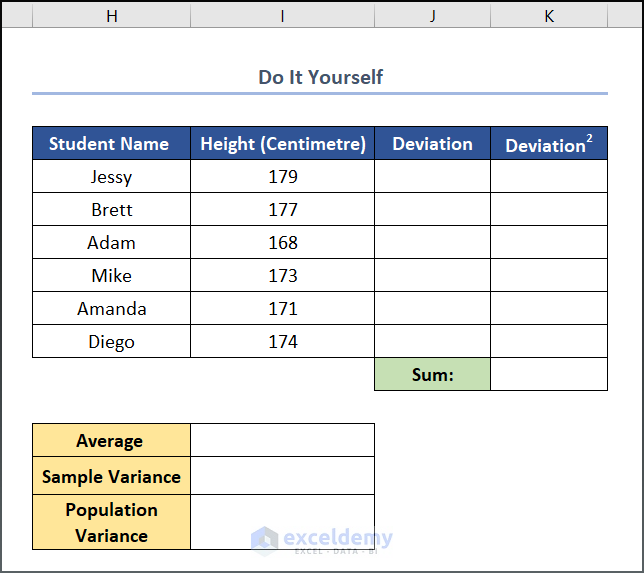
Practice Section
We have provided a Practice section on the right side of each sheet where you can test these methods.
Download the Practice Workbook
Related Articles
<< Go Back to Deviation in Excel | Excel for Statistics | Learn Excel
Get FREE Advanced Excel Exercises with Solutions!
