In this article, I will show you how to calculate standard deviation in Excel. In many situations, we need to calculate standard deviation whether performing any business calculations or dealing with large statistical data. Fortunately, Excel offers multiple functions to deal with those situations. Here, I will try to explain each function with proper illustrations and examples. So, let’s get started.
What Is Standard Deviation?
Before jumping into the ways of calculating the Standard Deviation in Excel, let’s understand what the Standard Deviation is. In statistics, standard deviation is a measurement of the data’s dispersion from the mean. If a certain data set has a higher standard deviation, then the data points are more dispersed from the average. The general formula for standard deviation is as follows.
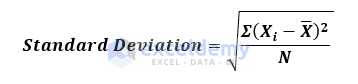
Here,
Xi= each value from the dataset
X̄= mean value of the entire data set
N= number of data points
For example, below, I have calculated the standard deviation for two sets of data.

Here, we can see that the marks on Chemistry are more dispersed from the average mark (65.3) compared to Physics. Hence, the standard deviation is larger for Chemistry (14.3) compared to Physics (8.1).
Read More: How to Calculate Variance and Standard Deviation in Excel
Types of Standard Deviation
The standard deviation is of two kinds. They are
- Sample Standard Deviation
- Population Standard Deviation
The Sample Standard Deviation measures the deviation for a selected portion of data points of a data set whereas the Population Standard Deviation measures the deviation for the entire data points of the data set. The formulas also differ a bit from each other. Below, the two formulas are given.
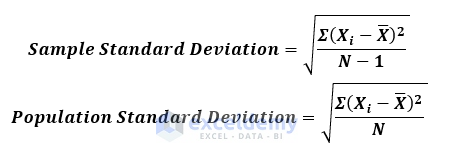
Here,
Xi=each value from the dataset
X̄=mean value of the entire data set
N=Number of data points
6 Functions for Calculating Standard Deviation
There is a total of 6 functions to calculate standard deviation in Excel.
- STDEV.S: This function considers just numerical data to determine the sample standard deviation. It overlooks text and logical values (TRUE or FALSE) in the spreadsheet. The syntax of STDEV.S is
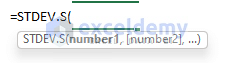
This function can take a maximum of 255 arguments in the form of numbers, arrays, names of ranges, or references that contain numbers. This function is only available in Excel 2010 and later versions. In the earlier versions, we need to use the STDEV function.
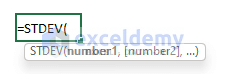
- STDEV: This is an earlier version of the STDEV.S function in Excel used to calculate sample standard deviation before 2007. For the sake of compatibility, it is still available. But Microsoft recommends using the latest counterpart. The syntax of this function is
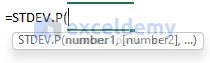
- STDEV.P: This function determines the population standard deviation. It calculates by considering only numerical values. It does not consider texts and logical values in the spreadsheet. The syntax of the STDEV.P function is
Like the STDEV.S function, this function is also available in Excel 2010 and later versions. In earlier versions, we need to use the following function.
- STDEVP: This is an earlier version of the STDEV.P formula that is still available for compatibility issues. It also measures the population standard deviation by considering only numerical values. The syntax of the function is

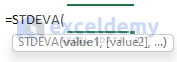
- STDEVA: This function calculates the sample standard deviation of a dataset considering the text and logical values in the calculation. All FALSE values are considered 0, and TRUE values are considered 1. The syntax of the function is
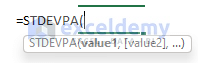
- STDEVPA: This function calculates the population standard deviation considering text and logical values in the calculation. Like STDEVA, all FALSE values are considered 0, and TRUE values are considered 1. The syntax of the function is
How to Calculate Deviation in Excel: 3 Easy Examples
In this section, we will demonstrate 3 effective methods to calculate standard deviation in Excel with appropriate illustrations. Let’s explore those examples one by one.
1. Using STDEV.S and STDEV Functions
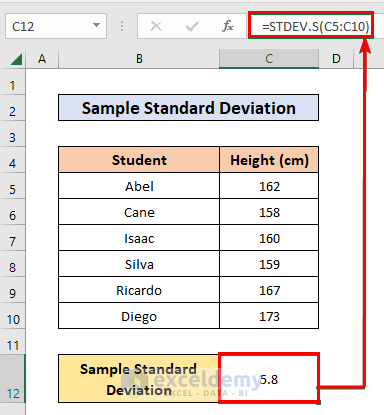
In this example, I will show you how we can calculate the sample standard deviation of a data set using STDEV.S and STDEV functions. For illustration, I have taken a data set where the heights of 6 students in cm are given.
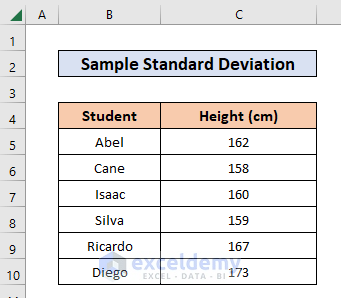
Now, we will calculate the sample standard deviation of the heights. To do that, follow the steps below.
Steps:
- First, select a cell where you want to calculate the standard deviation. Then, write down the following formula.
=STDEV.S(C5:C10)- Now, press OK. As a result, you will see the following outcome.
- Now, we can also use the legacy STDEV function to acquire the same result.
=STDEV(C5:C10)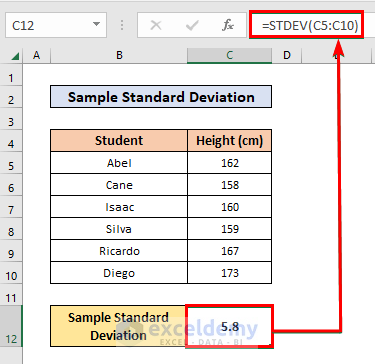
Though we have shown obtaining the same result using the STDEV function, we recommend using the STDEV.S function always as it is the latest function.
Read More: How to Calculate Quartile Deviation in Excel
2. Calculation of Population Standard Deviation
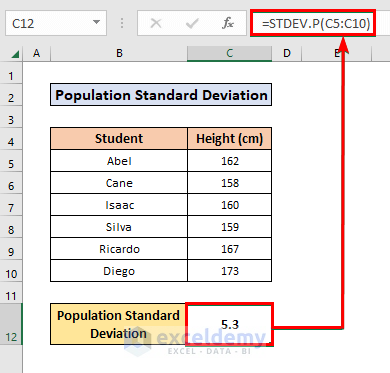
In the 1st example, I have shown the sample standard deviation. In this example, I will work with the same data set but determine the population standard deviation using the STDEV.P and STDEVP functions. So, to know more, follow the steps below.
Steps:
- First, pick a cell and write down the following formula.
=STDEV.P(C5:C10)- Now, press Enter As a result, you will get the population standard deviation of the student’s heights.
- Here, we can also use the STDEVP function to get the same result.
=STDEVP(C5:C10)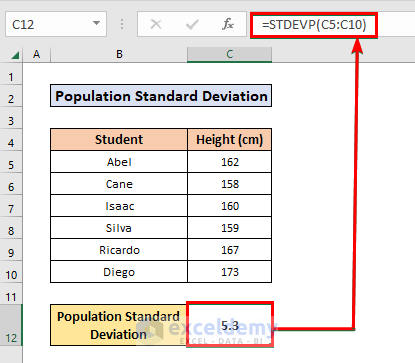
In this way, we can easily get the population standard deviation.
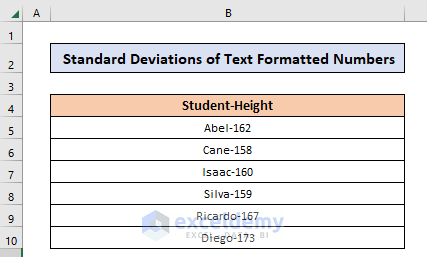
3. Calculating Standard Deviation of Text Representation of Numbers
Many times, our required numbers remain as a part of a large text string and we need to extract the numbers. After extracting the numbers, they are still formatted as text. In order to calculate the standard deviation, we can not directly apply the above 4 functions. Rather, we need to apply STDEVA and STDEVPA functions in this scenario. To illustrate, I have taken a data set where the student’s name and height are merged.
Now, we need to extract the numbers( heights) in another column and then use the STDEVA and STDEVPA functions to Calculate Standard Deviations. To know more, follow the steps below.
Steps:
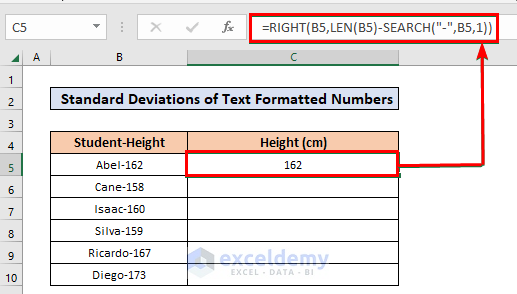
- First, we will extract the numbers from the merged text. To do that, take a cell on the right column(C5), and write down the following formula.
=RIGHT(B5,LEN(B5)-SEARCH("-",B5,1))- Now, press OK. As a result, you will get the height of Abel in cell C5.
🗝️ How Does the Formula Work?
Here, we have taken the LEN function to calculate the length of the total text in cell B5. Then with the SEARCH function, we determine the position of the hyphen(-) inside the text. After that, we subtract the result from the result of the LEN function to get the total number of digits from the right side of the text. Then, with the help of the RIGHT function, we extracted the right portion of the text which is essentially the height value.
- Now, use the Fill Handle to extract the height value for the rest of the cells.
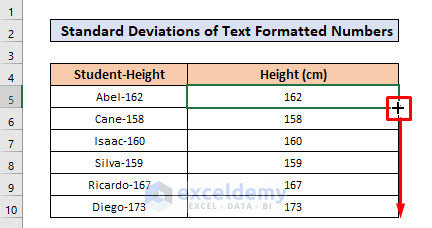
- As the functions used in the formula return text values, the numbers are in text format.
- Now if we use the STDEV.S function, we will get an error like this.
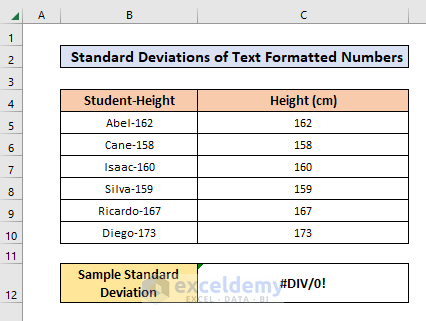
- Hence, to calculate the sample standard deviation, we have to directly insert the height value inside the STDVA function like this.
=STDEVA(RIGHT(B5,LEN(B5)-SEARCH("-",B5,1)),RIGHT(B6,LEN(B6)-SEARCH("-",B6,1)),RIGHT(B7,LEN(B7)-SEARCH("-",B7,1)),RIGHT(B8,LEN(B8)-SEARCH("-",B8,1)),RIGHT(B9,LEN(B9)-SEARCH("-",B9,1)),RIGHT(B10,LEN(B10)-SEARCH("-",B10,1)))
- Here, we have directly inserted the number-extracting formulas as arguments of the STDEVA function.
- In a similar manner, we can use the STDEVPA function to calculate the Population standard deviation.
=STDEVPA(RIGHT(B5,LEN(B5)-SEARCH("-",B5,1)),RIGHT(B6,LEN(B6)-SEARCH("-",B6,1)),RIGHT(B7,LEN(B7)-SEARCH("-",B7,1)),RIGHT(B8,LEN(B8)-SEARCH("-",B8,1)),RIGHT(B9,LEN(B9)-SEARCH("-",B9,1)),RIGHT(B10,LEN(B10)-SEARCH("-",B10,1)))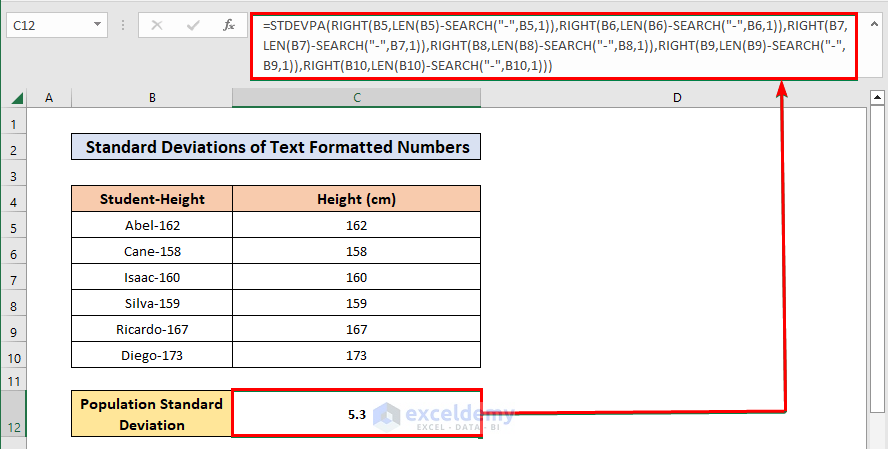
In this way, we can calculate the standard deviation for numbers in text format. But if you have a large number of data, it is best to convert the numerical values into Number format.
Read More: How to Calculate Absolute Deviation in Excel
Things to Remember
- Before applying any of the mentioned functions, check whether it will fit your requirements.
- In the 3rd example, we can also use the STDEV.S and STDEV.P functions to get the same result.
Download Practice Workbook
Download this practice workbook to exercise while you are reading this article.
Conclusion
That is the end of this article regarding how to calculate deviation in Excel. If you find this article helpful, please share this with your friends. Moreover, do let us know if you have any further queries.
Related Articles
<< Go Back to Deviation in Excel | Excel for Statistics | Learn Excel
Get FREE Advanced Excel Exercises with Solutions!
