The GROWTH Function in Excel
- Summary
The GROWTH function is a statistical function in Excel. It is used to calculate predictive exponential growth for a given set of data. The GROWTH function uses the equation:
y = b*ex
b is the y-intercept of the curve. And m is the slope parameter of the curve, which can also be written as:
y=b*eln(m)x
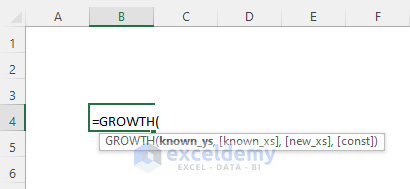
- Syntax
GROWTH(known_ys, [known_xs], [new_xs], [const])
- Arguments
| Argument | Requirement | Explanation |
|---|---|---|
| known_ys | Required | The set of known y values. |
| known_xs | Optional | The set of known x values. If this parameter is not given, the formula uses (1,2,3..) as the known_xs parameter. If it is provided, it should be of the same length as the set of known_ys. |
| new_xs | Optional | It is the x values used to return the corresponding y values. |
| const | Optional | This is either a TRUE or FALSE value. TRUE indicates that the constant b is calculated normally. FALSE means that the constant b is set to 1, and the m-values are adjusted so that y = mx. If this parameter is not given, the formula assumes the constant parameter as TRUE. |
- Return Value
The GROWTH function returns numbers in an exponential growth trend matching known data points. This function returns y values for a series of new x values that we specify using existing x values and y values.
Method 1 – Calculating Growth Between Two Data Ranges Using Excel GROWTH Function
Consider a dataset containing two data ranges (X Values and Y Values). Calculate the growth between these two data ranges:
Steps:
- Enter the formula below in E5.
GROWTH(C5:C13,B5:B13)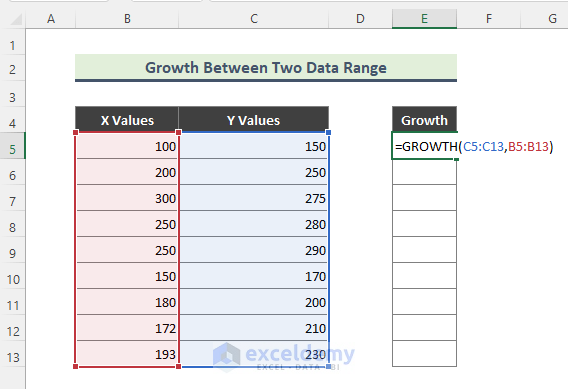
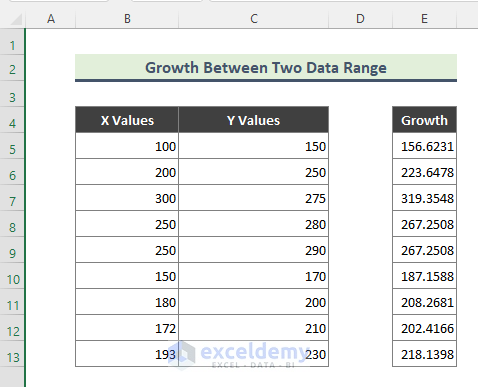
You will get the growth of X Values:
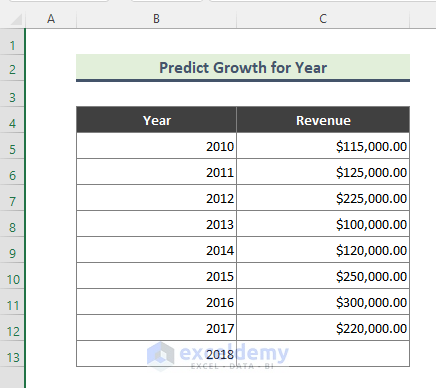
Method 2 – Applying the Excel GROWTH Function to Predict the Year-wise Revenue
The dataset contains a company’s year-wise revenue. Calculate the revenue for 2018.
Steps:
- Enter the formula below in E13.
=GROWTH(C5:C12,B5:B12,B13)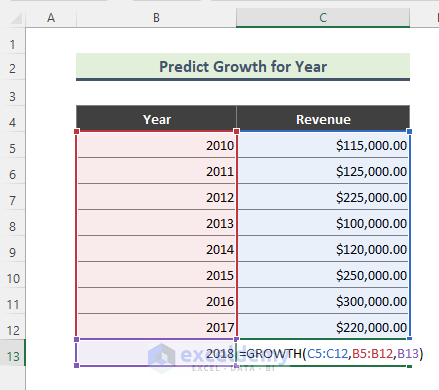
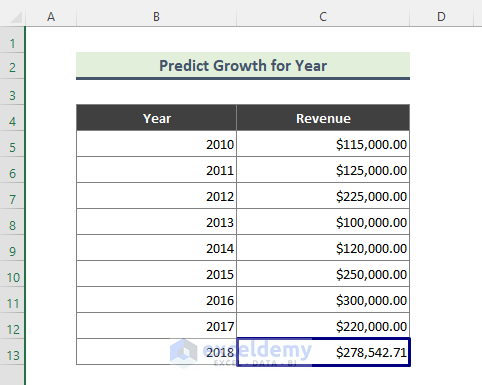
- Press Enter.
You will see the growth of the revenue for 2018.
Method 3 – Combining the Excel ROUND and GROWTH Functions to Predict Revenue
In Method 2, the growth for 2018 was $278,542.71. To round the value to zero decimal places:
Steps:
- Enter the formula below in E13.
=ROUND(GROWTH(C5:C12,B5:B12,B13),0)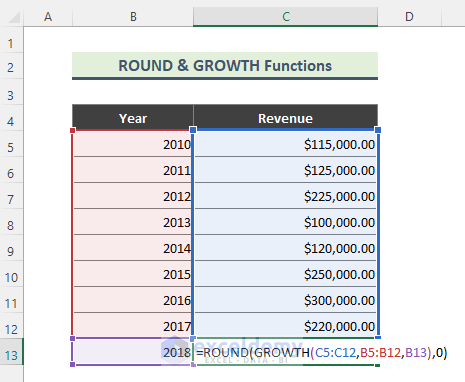
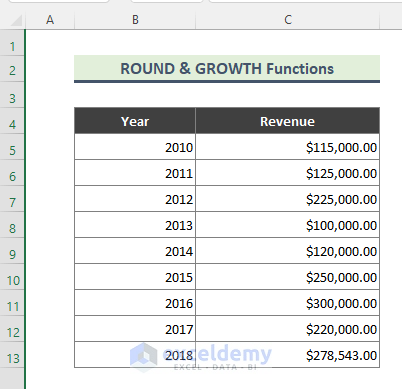
The ROUND function rounds the result of the GROWTH formula ($278,542.71) to zero decimal places.
The approximate revenue is $278,542.
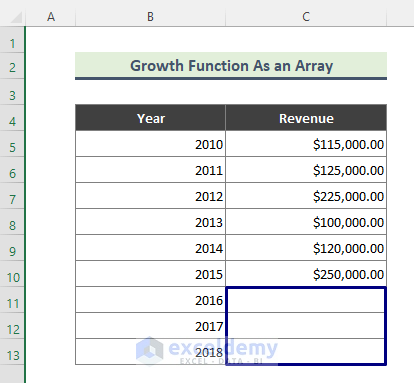
Method 4 – Applying the GROWTH Function As an Array in Excel
Calculate the growth for a range of x-values.
The dataset contains the revenue of 2010-2015. Calculate the growth for the next 3 years (2016-2018):
Steps:
- Enter the formula below in C11.
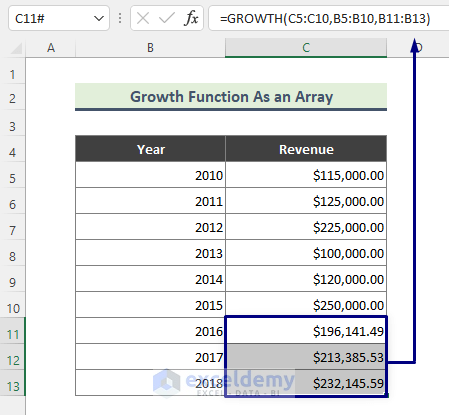
=GROWTH(C5:C10,B5:B10,B11:B13)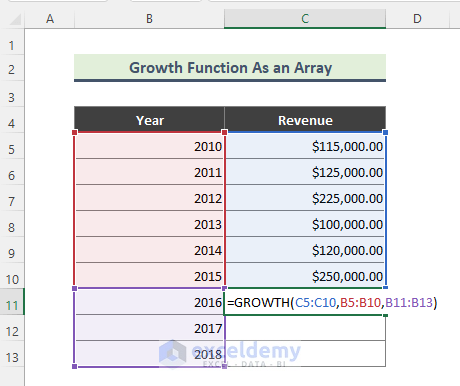
You will get the growth of revenue for 2016, 2017, and 2018.
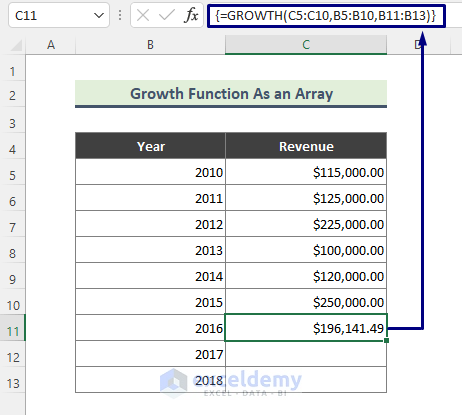
Note:
➤ In Microsoft 365, enter the GROWTH formula. In older versions, press CTRL + SHIFT + Enter to execute the formula. Here, the curly brackets indicate that the function is executed as an array.
Things to Remember
Common errors related to this function:
- #REF! – the [known_xs] range length is not similar to known_ys.
- #NUM! – the value of known_ys. is less than or equal to zero.
- #VALUE! – the value of known_ys, [known_xs], [new_xs] is supplied as text or the values are non-numeric.
Download Practice Workbook
Download the practice workbook.
Excel GROWTH Function: Knowledge Hub
<< Go Back to Excel Functions | Learn Excel
Get FREE Advanced Excel Exercises with Solutions!
